. 2021 Apr 28;41(17):3777-3798.
doi: 10.1523/JNEUROSCI.2401-20.2021. Epub 2021 Mar 18.

Purkinje Neurons with Loss of STIM1 Exhibit Age-Dependent Changes in Gene Expression and Synaptic Components

Affiliations

Purkinje Neurons with Loss of STIM1 Exhibit Age-Dependent Changes in Gene Expression and Synaptic Components

Sreeja Kumari Dhanya et al. J Neurosci. .

Abstract

The stromal interaction molecule 1 (STIM1) is an ER-Ca2+ sensor and an essential component of ER-Ca2+ store operated Ca2+ entry. Loss of STIM1 affects metabotropic glutamate receptor 1 (mGluR1)-mediated synaptic transmission, neuronal Ca2+ homeostasis, and intrinsic plasticity in Purkinje neurons (PNs). Long-term changes of intracellular Ca2+ signaling in PNs led to neurodegenerative conditions, as evident in individuals with mutations of the ER-Ca2+ channel, the inositol 1,4,5-triphosphate receptor. Here, we asked whether changes in such intrinsic neuronal properties, because of loss of STIM1, have an age-dependent impact on PNs. Consequently, we analyzed mRNA expression profiles and cerebellar morphology in PN-specific STIM1 KO mice (STIM1PKO ) of both sexes across ages. Our study identified a requirement for STIM1-mediated Ca2+ signaling in maintaining the expression of genes belonging to key biological networks of synaptic function and neurite development among others. Gene expression changes correlated with altered patterns of dendritic morphology and greater innervation of PN dendrites by climbing fibers, in aging STIM1PKO mice. Together, our data identify STIM1 as an important regulator of Ca2+ homeostasis and neuronal excitability in turn required for maintaining the optimal transcriptional profile of PNs with age. Our findings are significant in the context of understanding how dysregulated calcium signals impact cellular mechanisms in multiple neurodegenerative disorders.SIGNIFICANCE STATEMENT In Purkinje neurons (PNs), the stromal interaction molecule 1 (STIM1) is required for mGluR1-dependent synaptic transmission, refilling of ER Ca2+ stores, regulation of spike frequency, and cerebellar memory consolidation. Here, we provide evidence for a novel role of STIM1 in maintaining the gene expression profile and optimal synaptic connectivity of PNs. Expression of genes related to neurite development and synaptic organization networks is altered in PNs with persistent loss of STIM1. In agreement with these findings the dendritic morphology of PNs and climbing fiber innervations on PNs also undergo significant changes with age. These findings identify a new role for dysregulated intracellular calcium signaling in neurodegenerative disorders and provide novel therapeutic insights.

Keywords: RNA-Seq; calcium signaling; climbing fibers; excitability; mGluR1; motor coordination.


Figures

Figure 1.
Figure 1.
Genotyping of control and STIM1 KO transgenic mice. A, Top, Schematic diagram showing exon 2 of STIM1 gene flanked by loxP recombination sites (yellow triangles). Deletion of this exon following Cre-mediated recombination is expected to result in a frame shift that generates a premature stop codon in the next exon. Middle, Schematic diagram showing Cre reporter cassette inserted into the intron between endogenous exons 1 and 2 of the Rosa26 locus. Bottom, Schematic diagram showing insertion of Cre-recombinase cDNA into the exon 4 of PCP2 gene. Primers are indicated by arrows (FP, forward primer; RP, reverse primer). B, Top, Reporter mouse line with tdTomato-expressing Purkinje cells was generated by cross breeding floxed stop tdTomato mice (Ai14-tdTomato) and PCP2-Cre. Bottom, STIM1PKO mouse line of tdTomato-expressing Purkinje cells was generated by cross breeding homozygous double transgenic STIM1flox/flox; Ai14-tdTomatotd/td with STIM1flox/+; PCP2- Crecre/+. C, Agarose gel with genotyping of STIM1 KO mice. PCRs of genomic DNA from Stim1flox/flox; Ai14td/+; PCP2Cre/+ (STIM1PKO) mice are given on lanes 1-3 and 4-6. A single band at 399 bp is for homozygous STIM1 flox (lanes 1, 4), two bands at 297 bp (RosaWT) and 196 bp (Ai14tdT insert in the Rosa locus) (lanes 2, 5), and 421 bp for PCP2Cre (lanes 3, 6). PCRs with genomic DNA from Stim1flox/+; Ai14td/+; PCP2Cre/+ (STIM1PHet) mice are shown in lanes 7-9. D, Genotyping of control mice. Lanes 1-4 with Ai14td/+; PCP2Cre/+ (STIM1WT); sizes of DNA bands are as described above for C. L, DNA ladder for both C and D.
Figure 2.
Figure 2.
Loss of STIM1 occurs slowly after STIM1 KO in PNs. Cerebellar sections with PNs from STIM1WT and STIM1PKO mice, immunostained as indicated. Sagittal sections prepared from STIM1WT and STIM1PKO mice at 6 weeks (A), 12 weeks (B), and 1 year (C) were stained with anti-STIM1 antibody and imaged at 20× (left) and 40×. PNs (white arrows), GL (red asterisks), PN dendrites (black arrows), and PN axons (white asterisks) are marked. Scale bars, 50 μm. Quantification of STIM1 levels in the soma of PNs across different ages is shown in Figure 3.
Figure 3.
Figure 3.
Quantification of STIM1 and characterization of PNs and Bergmann glia in cerebellar sections. A, Bar graph with quantification of STIM1 in the soma of PNs compared with the expression of tdTomato seen at 6 weeks (STIM1WT, n = 53 PNs; STIM1PKO, n = 68 PNs), 12 weeks (STIM1WT, n = 64 PNs; STIM1PKO, n = 74 PNs), and 1 year (STIM1WT, n = 65 PNs; STIM1PKO, n = 77 PNs). Immunofluorescence intensities of STIM1 and tdTomato were quantified from PN soma by placing identical hand-drawn ROIs on the respective images, using ImageJ software. The total PNs analyzed are from 3 mice per group. Data are mean ± SEM. *p < 0.001 (two-tailed Student's t test). B, Representative images of confocal sections from the indicated genotypes and ages showing the STIM1 (green) and tdTomato (red) in PN soma (white arrowheads). C, Immunostained cerebellar sections from STIM1WT and STIM1PKO mice 1.5 years of age with intact PNs. Red represents tdTomato. Green represents STIM1. D, Characterization of Bergmann glia marked by S100B in cerebellar sections from control mice 1 year of age. Top, Sagittal sections were imaged at 40× magnification. Bottom, An enlarged image is shown with the location of the Bergmann glial cell body. A PN and a Bergmann glial cell body are marked with white asterisks and white arrowheads, respectively. Cyan arrowheads indicate non-Purkinje cells expressing tdTomato and not marked by S100B. Scale bars: B-D, 50 μm.
Figure 4.
Figure 4.
Motor coordination deficits in STIM1 KO mice. A, Mean latency on the rotarod for STIM1WT and STIM1PKO mice at 9 weeks (STIM1WT and STIM1PKO; n = 5) and (B) at 14 weeks (STIM1WT, n = 7 and STIM1PKO, n = 5). Two-way ANOVA, post hoc test, and Sidak's multiple comparison test were used for comparisons. C–E, Mean latency on the rotarod for STIM1WT (n = 23), STIM1PHet (n = 13), and STIM1PKO (n = 24) mice. Significant changes in latencies were estimated using two-way ANOVA, post hoc test, followed by Tukey's multiple comparisons test. *p < 0.05; **p < 0.001; ***p < 0.0001; comparison of STIM1WT and STIM1PKO mice. F, Latencies to fall from the accelerated rotarod on day 5 for STIM1WT, STIM1PHet, and STIM1PKO mice across different ages, shown as box plots. Horizontal line indicates the median. Black solid diamond represents the mean. Colored diamonds represent individual data points. In every box plot, the limits extend from 25th to 75th percentile.
Figure 5.
Figure 5.
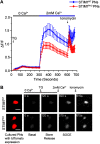
SOCE in cultured PNs. A, Changes in cytosolic Ca2+ on ER store depletion by treatment with thapsigargin (TG) followed by SOCE on addition of extracellular Ca2+. PNs were obtained from P1 mice, cultured 14 DIV, and loaded with the Ca2+-sensitive dye, Fluo-4 AM. Each trace represents the mean response curve of 31 PNs (STIM1WT) and 14 PNs (STIM1PKO). B, Representative images of cultured PNs from the indicated genotypes showing tdTomato fluorescence, basal cytosolic Ca2+ (0 Ca2+) followed by changes in cytosolic Ca2+ levels on ER-Ca2+ store release (TG), SOCE (2 mm Ca2+), and measurement of dye saturation (ionomycin). Scale bars, 20 μm.
Figure 6.
Figure 6.
Reduced membrane depolarization and mGluR1 activation in STIM1 KO PNs. A, Line plot of the mean traces (±SEM) of normalized GCaMP6f fluorescence responses (ΔF/F) in PN soma on 75 mm KCl stimulation (STIM1WT, 84 PNs, 8 mice; STIM1PKO, 44 PNs, 5 mice). B, Representative images of changes in GCaMP6f fluorescence from PN soma at indicated time points following KCl stimulation. Red arrowheads indicate PN soma. Scale bars, 20 μm. C-E, Bar graphs with peak ΔF/F (STIM1WT, 12.41 ± 0.57; STIM1PKO, 7.08 ± 0.40; p = 4.10 × 10⁻¹²), area under the curve (STIM1WT, 360.21 ± 27.82; STIM1PKO, 273.59 ± 31.92, p = 0.04338), and rate of calcium entry ΔF/Sec (STIM1WT, 2.54 ± 0.27; STIM1PKO, 0.56 ± 0.04, p = 2.11 × 10⁻¹⁰) quantified from A, respectively. Each bar is compared with control shown in blue. *p < 0.05; **p < 0.0001; two-tailed Student's t test. Line plots of GCaMP6f fluorescence responses (ΔF/F) in PN soma of (F) control (30 PNs, 4 mice) and (G) STIM1PKO (55 PNs, 4 mice) on addition of the mGluR1 agonist, 200 μm DHPG. H, Snapshots of GCaMP6f responses from PN soma at indicated time points on DHPG stimulation. Red arrowheads indicate the PN soma. Scale bars, 20 μm. I, Mean traces (±SEM) of normalized GCaMP6f fluorescence responses (ΔF/F) in PN soma on DHPG stimulation in slices incubated with 200 μm CPCCOEt, an mGluR1 antagonist (STIM1WT, 39 PNs, 4 mice; STIM1PKO, 43 PNs, 4 mice).
Figure 7.
Figure 7.
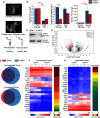
RNA Seq reveals gene expression changes in PNs from STIM1PKO mice. A, Images of a micro-dissected PNL+ML and a schematic representation for extracting RNA and protein. Scale bar, 1 mm. B, Bar graphs represent comparative expression levels of a PN marker, PCP2 (Purkinje cell protein 2), STIM1 (Stromal Interaction Molecule 1), and a GL marker GABRA6 (GABA type A receptor subunit alpha6) normalized to GAPDH (glyceraldehyde 3-phosphate dehydrogenase) in samples of PNL+ML and GL. RNA expression was measured by qRT-PCR from the micro-dissected samples. Fold changes of STIM1 and GABRA6 are relative to the expression levels of Control PCP2 (n = 6 mice, 1 year). Relative fold change of PCP2 in STIM1WT (PNL+ML), 1.02 ± 0.10; STIM1PKO (PNL+ML), 1.03 ± 0.09 versus PCP2 levels in STIM1WT (GL), 0.22 ± 0.02; STIM1PKO (GL), 0.33 ± 0.08; p = 0.00038 for STIM1WT (PNL+ML) versus STIM1WT (GL) and p = 0.00031 for STIM1PKO (PNL+ML) versus STIM1PKO (GL). Relative fold change of STIM1 in STIM1WT (PNL+ML), 3.43 ± 0.21 × 10⁻³; STIM1PKO (PNL+ML), 0.969 ± 0.23 × 10⁻³; p = 1.5 × 10⁻⁵. Relative fold change of GABRA6 in STIM1WT (PNL+ML), 0.01 ± 0.002 versus STIM1WT (GL), 0.17 ± 0.06, p = 0.03931 and STIM1PKO (PNL+ML), 0.01 ± 0.003 versus STIM1PKO (GL), 0.12 ± 0.02, p = 0.00195. Data are mean ± SEM. *p < 0.05; **p < 0.01; ***p < 0.001; two-tailed Student's t test. C, Western blot showing STIM1 levels in control and STIM1 KO micro-dissected samples. D, Volcano plot of gene expression changes. Red dots and green dots represent sets of transcripts expressed at significantly lower and higher levels in STIM1PKO PNs, respectively (EdgeR analysis). RNA-Seq experiments were performed with three biological replicates from 1-year-old mice. E, Venn diagrams representing the number of genes identified as differentially expressed by DEseq and EdgeR analysis. F, G, Heat maps depicting read counts of selected downregulated (F) and upregulated (G) genes, in order of maximal average fold change (right panels), from WT and STIM1 KO conditions, are shown for three biological replicates (left panels).
Figure 8.
Figure 8.
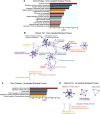
Biological processes affected by the absence of STIM1 in the PNs. A, Biological processes enriched among genes that are downregulated in STIM1 KO PNs. B, Network analysis of significant biological processes from A. C, Biological processes enriched among genes that are upregulated in STIM1 KO PNs. D, Network analysis of significant biological processes of upregulated genes. In the network plots, each circle node represents GO terms where its size is proportional to the number of input genes included in the term, and its color represents its cluster identity. Nodes that share common genes are connected by edges. Edge width corresponds to the number of genes that are shared between nodes, and edge length represents the similarity coefficient between nodes. GO analysis was performed using Metascape and parameters specific for Mus musculus with p value cutoff as 0.01, count threshold at 3, and minimum enrichment as 1.5. Details of GO terms are provided in Extended Data Figures 8-1 and 8-2.
Figure 9.
Figure 9.
GO analysis of enriched cellular components and KEGG pathway among downregulated genes. A, Analysis of enriched cellular components among genes that are downregulated in STIM1 KO PNs. B, Network analysis of significant cellular components from A. C, Enriched KEGG pathway and Reactome analysis of downregulated genes in STIM1 KO PNs. D, Network analysis of significant KEGG and Reactome pathway from C. GO analysis was performed using Metascape and parameters specific for Mus musculus with p value cutoff as 0.01, count threshold at 3, and minimum enrichment as 1.5. Details of GO terms are provided in Extended Data Figures 9-1 and 9-2.
Figure 10.
Figure 10.
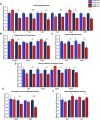
Age-dependent gene expression changes in STIM1PKO PNs. Bar graphs of fold changes in expression levels of the indicated genes from biologically significant pathways, such as (A) calcium signaling, (B) voltage-gated ion channels, (C) synaptic signaling, (D) neuron projection development, (E) transcription factor, and (F) carbohydrate metabolic process. Fold changes were normalized to GAPDH. All measurements are by qRT-PCR of cDNA prepared from RNA isolated from micro-dissected PNL+ML (n = 6). Data are mean ± SEM. *p < 0.05; **p < 0.01; ***p < 0.001; two-tailed Student's t test. Pcp2, Purkinje cell protein 2; Stim1, stromal interaction molecule 1; Gabra6, GABA type A receptor subunit alpha6; Itpr1, inositol 1,4,5-trisphosphate receptor 1; Pvalb, parvalbumin; Calm1, calmodulin1; Casq2, calsequestrin 2; Cacng5, calcium voltage-gated channel auxiliary subunit γ5; Atp1a3, ATPase Na+/K+ transporting subunit α3; Kctd17, potassium channel tetramerization domain containing 17; Syt11, synaptotagmin 11; Vamp1, vesicle-associated membrane protein 1; Dlg4, discs large homolog 4; Robo2, roundabout guidance receptor 2; Gigyf2, GRB10-interacting GYF protein 2; Map4, microtubule-associated protein 4; Tfap2b, transcription factor AP-2β; Setd6, SET domain containing 6; Bad, BclII-associated agonist of cell death; Insr, insulin receptor; Gapdh, glyceraldehyde 3-phosphate dehydrogenase. Details of fold change and exact p value are provided in Table 2.
Figure 11.
Figure 11.
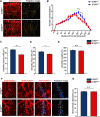
Alteration in dendritic morphology observed in STIM1 KO PNs. A, Confocal analysis of dendritic arborization in PNs of control and STIM1 KO mice using Filament Tracer (Auto Depth) in Imaris software. Confocal images of PN dendrites (left) and their projection image, traced using Imaris (right) are shown. White arrowheads indicate 120 μm. Scale bar, 20 μm. B, Sholl analysis with number of intersections (y axis) and distance from the soma (in µm; x axis) for PN dendrites from control and STIM1PKO animals. *p < 0.05; **p < 0.01; ***p < 0.001; two-way ANOVA with Sidak's multiple comparison test. C, Bar graph with quantification of the total dendritic volume (STIM1WT, 2322.24 ± 69.48 µm3; STIM1PKO, 1840.56 ± 71.49 µm3; p = 5.82 × 10⁻⁶) (D) dendritic area (STIM1WT, 2979.99 ± 90.96 µm2; STIM1PKO, 2658.20 ± 100.96 µm2; p = 0.0202) and (E) dendritic length (STIM1WT, 361.74 ± 12.36 µm; STIM1PKO, 351.35 ± 14.18 µm; p = 0.5821) of control and STIM1PKO dendrites [STIM1WT, n = 54; STIM1PKO, n = 38 PNs]. F, Spine morphology on distal dendrites of PNs from STIM1WT and STIM1PKO. Confocal images of distal PN dendrites expressing tdTomato (from left; scale bar, 4 μm) followed by enlarged images of the marked regions (scale bar, 2 μm). The enlarged confocal image is followed by an overlay with the corresponding projection image traced using Imaris and the projection image from Imaris analysis (extreme right). White arrowheads indicate some of the spines present on a distal dendrite. G, Bar graph represents the quantitative analysis of spine density (spines/10 µm) along the distal dendrites of PN for the indicated genotype [STIM1WT, 31.28 ± 0.38 (n = 16 PNs); STIM1PKO, 31.08 ± 0.43 (n = 14 PNs); p = 0.7324]. Three mice (age 1 year) were analyzed per group. Data are mean ± SEM. *p < 0.05; **p < 0.01; two-tailed Student's t test; n.s., not significant..
Figure 12.
Figure 12.
Defects in synaptogenesis in the PNs of STIM1 KO mutants in vivo. Immunohistochemical analysis of CF innervation of PN dendrites in cerebella from STIM1WT and STIM1PKO 14-week- and 1-year-old mice. A, C, E, G, Immunostaining of PNs with VGLUT2 puncta (green) and Td tomato expression (red; left), overlay of projection images from Imaris analysis with dendritic filaments marked in blue on the image from the left (middle) and VGLUT2 puncta (green) along with projection images of dendritic filaments from Imaris analysis marked in yellow (right) in mice of the indicated ages and genotypes. Scale bars, 10 μm. B, D, F, H, Bar graph represents the density of VGLUT2 puncta (count per 103 µm2) at the indicated dendritic regions in young (14 week) and old (1 year) mice. Proximal 14 weeks: STIM1WT, 42.70 ± 1.16; STIM1PKO, 46.13 ± 1.11; p = 0.0363; distal 14 weeks: STIM1WT, 14.57 ± 1.55; STIM1PKO, 17.13 ± 1.56; p = 0.2569; proximal 1 year: STIM1WT, 31.02 ± 2.41; STIM1PKO, 52.39 ± 2.80; p = 4.06 × 10⁻⁷; distal 1 year: STIM1WT, 12.78 ± 2.32; STIM1PKO, 30.09 ± 2.61; p = 3.87 × 10⁻⁵. Puncta density quantifications were from 3 mice of each age and genotype and 12 or more PNs from each genotype. Data are mean ± SEM. *p < 0.05; **p < 0.0001; two-tailed Student's t test; n.s., not significant..
Figure 13.
Figure 13.
Schematic representation of age-dependent STIM1 functions in cerebellar PNs. The ER-Ca2+ sensor STIM1 lies at the heart of intracellular Ca2+ signaling in PNs. Loss of STIM1 attenuates Ca2+ entry and affects refilling of ER stores, which suppresses mGluR1-stimulated Ca2+ signals and PN excitability. Over time, these changes affect gene expression and optimal synaptic connectivity of cerebellar PNs. Phrases in blue represent changes in STIM1PKO PNs that occur over 17 weeks. Phrases in red represent longer-term changes observed at 1 year. The schematic encapsulates novel findings from this work and from previous studies (Hartmann et al., 2014; Ryu et al., 2017). Model created using Biorender (www.BioRender.com).

Similar articles

Cited by

References

    1. Airaksinen MS, Eilers J, Garaschuk O, Thoenen H, Konnerth A, Meyer M (1997) Ataxia and altered dendritic calcium signaling in mice carrying a targeted null mutation of the calbindin D28k gene. Proc Natl Acad Sci USA 94:1488–1493. 10.1073/pnas.94.4.1488 - DOI - PMC - PubMed
    1. Aiba A, Kano M, Chen C, Stanton ME, Fox GD, Herrup K, Zwingman TA, Tonegawa S (1994) Deficient cerebellar long-term depression and impaired motor learning in mGluR1 mutant mice. Cell 79:377–388. 10.1016/0092-8674(94)90205-4 - DOI - PubMed
    1. Albus S (1971) A theory of cerebellar function. Math Biosci 10:25–61. 10.1016/0025-5564(71)90051-4 - DOI
    1. Anders S, Huber W (2010) Differential expression analysis for sequence count data. Genome Biol 11:R106. 10.1186/gb-2010-11-10-r106 - DOI - PMC - PubMed
    1. Anders S, Huber W (2012) Differential expression of RNA-Seq data at the gene level: the DESeq package. Eur Mol Biol Lab 10:1–24.

Publication types

Substances