. 2021 Apr 28;41(17):3752-3763.
doi: 10.1523/JNEUROSCI.2420-20.2021. Epub 2021 Mar 18.

Noradrenergic Signaling Disengages Feedforward Transmission in the Nucleus Accumbens Shell

Affiliations

Noradrenergic Signaling Disengages Feedforward Transmission in the Nucleus Accumbens Shell

Kevin M Manz et al. J Neurosci. .

Abstract

The nucleus accumbens shell (NAcSh) receives extensive monoaminergic input from multiple midbrain structures. However, little is known how norepinephrine (NE) modulates NAc circuit dynamics. Using a dynamic electrophysiological approach with optogenetics, pharmacology, and drugs acutely restricted by tethering (DART), we explored microcircuit-specific neuromodulatory mechanisms recruited by NE signaling in the NAcSh of parvalbumin (PV)-specific reporter mice. Surprisingly, NE had little direct effect on modulation of synaptic input at medium spiny projection neurons (MSNs). In contrast, we report that NE transmission selectively modulates glutamatergic synapses onto PV-expressing fast-spiking interneurons (PV-INs) by recruiting postsynaptically-localized α2-adrenergic receptors (ARs). The synaptic effects of α2-AR activity decrease PV-IN-dependent feedforward inhibition onto MSNs evoked via optogenetic stimulation of cortical afferents to the NAcSh. These findings provide insight into a new circuit motif in which NE has a privileged line of communication to tune feedforward inhibition in the NAcSh.SIGNIFICANCE STATEMENT The nucleus accumbens (NAc) directs reward-related motivational output by integrating glutamatergic input with diverse neuromodulatory input from monoamine centers. The present study reveals a synapse-specific regulatory mechanism recruited by norepinephrine (NE) signaling within parvalbumin-expressing interneuron (PV-IN) feedforward inhibitory microcircuits. PV-IN-mediated feedforward inhibition in the NAc is instrumental in coordinating NAc output by synchronizing the activity of medium spiny projection neurons (MSNs). By negatively regulating glutamatergic transmission onto PV-INs via α2-adrenergic receptors (ARs), NE diminishes feedforward inhibition onto MSNs to promote NAc output. These findings elucidate previously unknown microcircuit mechanisms recruited by the historically overlooked NE system in the NAc.

Keywords: adrenergic receptor; feedforward inhibition; neorepinephrine; nucleus accumbens; parvalbumin interneurons; prefrontal cortex.


Figures

Figure 1.
Figure 1.
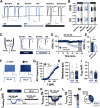
NET blockade decreases glutamatergic drive onto fast-spiking PV-INs but not MSNs in the NAcSh. A, top, Parasagittal mouse brain slice depicting recording region within NAcSh and the PV-IN-containing feedforward inhibitory microcircuit Bottom, Schematic depicting breeding strategy used to generate PVCre-tdTomatofl-STOP-fl (PVtdT) mice. B, left, Representative traces of APs elicited via 350-pA somatic current injection in tdT(+) PV-INs and tdT(–) MSNs. Scale bar: 20 mV/100 ms. C, Schematic of candidate monoaminergic inputs regulating feedforward glutamatergic synapses onto PV-INs. D, Representative traces of EPSCs obtained preapplication and postapplication of DAT inhibitor, GBR12783 (gray), SERT inhibitor, fluoxetine (black), or tricyclic NET inhibitor, desipramine (blue). Scale bars: 100 pA/20 ms. E, Time course summary of EPSCs in tdT(+) PV-INs cells during application of each MAT inhibitor. F, Quantification of average EPSCs amplitude post-MAT inhibitor at t(gray) = 35–40. G, Representative experiment and traces of EPSCs in tdT(+) PV-INs during bath-application of the more selective NET inhibitor, TMx. H, Representative experiment and traces of EPSCs in tdT(–) MSNs during bath-application of TMx. I, Time course of EPSCs obtained from tdT(+) PV-INs and tdT(–) MSNs during TMx application. J, Quantification of average EPSCs before and after [t(gray) = 45–50] TMx application in tdT(+) PV-INs and tdT(–) MSNs. K, Representative experiment and traces of EPSCs in tdT(+) PV-INs during bath-application of NE. L, Representative experiment and traces of EPSCs in tdT(–) MSNs during bath-application of NE. M, Time course summary of EPSCs obtained from tdT(+) PV-INs and tdT(–) MSNs during NE application. N, Summary of average EPSCs before and after [t(gray) = 45–50] NE application in tdT(+) PV-INs and tdT(–) MSNs. All scale bars: 100 pA/50 ms. Error bars indicate SEM; *p < 0.05.
Figure 2.
Figure 2.
α2-ARs mediate the actions of NE signaling at glutamatergic synapses onto PV-INs. A, Schematic depicting NE input regulating PV-IN-embedded feedforward inhibitory microcircuit. B, Representative traces of EPSCs in tdT(+) PV-INs during bath-application of TMx in ACSF containing non-selective α-AR antagonist, phentolamine (left); non-selective β-AR antagonist, propranolol (middle); and selective α2-AR antagonist, atipamezole (right). Scale bars: 100 pA/50 ms. C, Time course summary of EPSCs obtained from tdT(+) PV-INs during bath-application of TMx in ACSF containing non-selective phentolamine (dark blue) or propranolol (light blue). D, Time course summary of EPSCs obtained from tdT(+) PV-INs during bath-application of TMx in ACSF containing atipamezole. Gray-shaded region depicts the ghosted ACSF control. E, Quantification of average EPSCs in tdT(+) PV-INs before and after [t(gray) = 45–50] TMx application in the presence of each AR antagonist. F, Representative traces of EPSCs in tdT(+) PV-INs at baseline, during NE superfusion, and in the presence of atipamezole. Scale bars: 100 pA/50 ms. G, Time course summary of EPSCs obtained from tdT(+) PV-INs during bath-application of NE chased by atipamezole. H, Quantification of average EPSCs following NE superfusion [t(blue) = 15–35] and in the presence of atipamezole [t(gray) = 35–40 min]. I, Representative traces of EPSCs in tdT(+) PV-INs before and after PE or guanfacine. Scale bars: 100 pA/20 ms. J, Time course summary of EPSCs obtained from tdT(+) PV-INs during bath-application of α1-AR agonist, PE (black) or α2A-AR agonist, guanfacine (blue). K, Quantification of average EPSCs following bath-application of PE or guanfacine. L, left, Schematic depicting MSN recording strategy within feedforward inhibitory microcircuits. M, Representative EPSCs and time course summary of electrically-evoked local EPSCs in tdT(–) MSNs during bath-application of guanfacine. N, Quantification of average EPSC amplitude postguanfacine in MSNs. Scale bar: 100 pA/50 ms. Error bars indicate SEM; *p < 0.05.
Figure 3.
Figure 3.
NE signaling is mediated by a postsynaptic mechanism at glutamatergic synapses onto PV-INs. A, Representative traces of 50-ms ISI paired-pulse EPSCs at baseline and in the presence of NE (blue), TMx (light blue), and guanfacine (black). Scale bars: 100 pA/50 ms. B, Quantification of average PPR and CV pre-NE and post-NE, TMx, and guanfacine. C, Representative traces of EPSCs in tdT(+) PV-INs during bath-application of TMx with GDPβS-loaded internal solution (left) and a thermally-hydrolyzed control internal solution (right). Scale bars: 100 pA/50 ms. D, time course summary of EPSCs obtained from tdT(+) PV-INs during bath-application of TMx with GDPβS-loaded internal solution (dark) and a thermally hydrolyzed control internal solution (open circles). E, Quantification of average EPSCs post-TMx [t(gray) = 45–50 min] in GDPβS and control internal solutions. F, Representative traces of APs elicited via 300-pA somatic current injection in ACSF (light blue) or NE (dark blue). Scale bar: 20 mV/100 ms. G, Input-output function of PV-INs following 50-pA sequential increases in current injection (ACSF, open circles; NE, blue circles). H, Rheobase obtained from PV-INs in ACSF or NE. I, VRMP of PV-INs in ACSF or NE. J, left, Representative experiment of an NE-induced shift in IHolding, rendering the cell NE(+) (blue). Right, Representative experiment of a PV-IN not undergoing a change in IHolding, rendering the cell NE(–) (black). Scale bar: 50 pA/10 min. K, Segregated time course summary depicting the effects of NE on IHolding in NE(+) (blue) and NE(–) (open circles) PV-INs. L, Quantification of IHolding post-NE in all 18 PV-INs quantified at t(gray) = 20 min. M, Pie chart summary showing the percentage of cells undergoing a NE-induced change in IHolding (blue). Error bars indicate SEM; *p < 0.05.
Figure 4.
Figure 4.
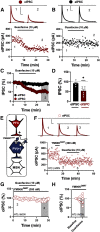
PV-INs mediate PFC-evoked feedforward inhibition of MSNs in the NAcSh. A, Schematic depicting optogenetic targeting of PFC afferents to the NAcSh to examine PFC-evoked FFI in WT mice. B, left, Representative traces of PFC-evoked oIPSCs (red) and local eIPSCs (black) obtained from MSNs at 0 mV in ACSF. Right, Representative traces and quantification of PFC-evoked oIPSCs and local eIPSCs obtained from MSNs in ACSF containing GABAAR antagonist, picrotoxin. C, Quantification of latency onset of eIPSCs and oIPSCs in MSNs. D, Quantification of average e/oIPSC amplitude postpicrotoxin. E, Representative traces of PFC-evoked oIPSCs and local eIPSCs obtained from MSNs at baseline and in ACSF containing pan-AMPAR antagonist, NBQX. F, Quantification of average oIPSC and eIPSC amplitude pre-NBQX and post-NBQX. G, Representative traces of oIPSCs and eIPSCs at baseline and in the presence of CP-AMPAR antagonist, NASPM. H, Quantification of average oIPSC and eIPSC amplitude pre-NASPM and post-NASPM. All IPSC scale bars: 50 pA/50 ms. I, Schematic depicting the use of DART pharmacology to selectively block AMPAR-mediated feedforward glutamatergic transmission onto PV-INs in the NAc. J, Representative traces of Tom/HT(+) PV-IN membrane responses during hyperpolarizing (−150 pA) and depolarizing current steps (350 pA). Scale bar: 20 mV/500 ms. K, Representative traces of Tom/HT(–) MSN membrane responses during hyperpolarizing (−150 pA) and depolarizing current steps (350 pA). Scale bar: 20 mV/500 ms. L, Representative EPSCs from Tom/HT(+) PV-INs (blue) and Tom/HT(–) MSNs (black) preapplication and postapplication of AMPAR DART, YM90KDART. M, Normalized time course summary and quantification of EPSCs in Tom/HT(+) PV-INs (blue) and Tom/HT(–) MSNs (open circles) during YM90KDART superfusion. N, Representative traces of PFC-evoked APs in PV-INs in cell-attached configuration in ACSF (black) or YM90KDART (300 nm; blue). O, Quantification of AP fidelity (number of AP successes × eight pulses) in ACSF versus YM90KDART. Scale bar: 50 mV/2 s. P, Representative traces of PFC-evoked oIPSCs and local eIPSCs obtained from Tom/HT(–) MSNs at baseline and following YM90KDART application. Scale bar: 50 pA/50 ms. Normalized time course summary and quantification of average IPSC amplitude pre-YM90KDART and post-YM90KDART. Error bars indicate SEM; *p < 0.05.
Figure 5.
Figure 5.
α2-ARs decrease PFC-evoked feedforward inhibition of MSNs in the NAcSh. A, B, Representative traces superimposed on experiments of PFC-evoked oIPSCs and local eIPSCs during bath-application of α2A-AR agonist, guanfacine. C, Time course summary of oIPSCs (red) and eIPSCs (black) during bath-application of guanfacine. D, Quantification of average oIPSC and eIPSC amplitude [t(gray) = 25–30 min] postguanfacine. E, Schematic depicting mechanism of YM90KDART on HT-expressing PV-INs in the NAcSh. F, Representative traces superimposed on experiments of PFC-evoked oIPSCs in Tom/HT(–) MSNs during the sequential application of YM90KDART (300 nm) and guanfacine. G, Renormalized time course summary of oIPSCs in the presence of YM90KDART during guanfacine superfusion. H, Quantification of the average YM90KDART-resistant oIPSC amplitude postguanfacine [t(gray) = 25–30 min]. Sale bars: 50 pA/50 ms. Error bars indicate SEM; *p < 0.05.

Similar articles

Cited by

References

    1. Allin R, Russell VA, Lamm MCL, Taljaard JJF (1988) Regional distribution of monoamines in the nucleus accumbens of the rat. Neurochem Res 13:937–942. 10.1007/BF00970765 - DOI - PubMed
    1. Alsene KM, Fallace K, Bakshi VP (2010) Ventral striatal noradrenergic mechanisms contribute to sensorimotor gating deficits induced by amphetamine. Neuropsychopharmacology 35:2346–2356. 10.1038/npp.2010.106 - DOI - PMC - PubMed
    1. Berridge CW, Stratford TL, Foote SL, Kelley AE (1997) Distribution of dopamine beta-hydroxylase-like immunoreactive fibers within the shell subregion of the nucleus accumbens. Synapse 27:230–241. 10.1002/(SICI)1098-2396(199711)27:3<230::AID-SYN8>3.0.CO;2-E - DOI - PubMed
    1. Beurrier C, Malenka RC (2002) Enhanced inhibition of synaptic transmission by dopamine in the nucleus accumbens during behavioral sensitization to cocaine. J Neurosci 22:5817–5822. - PMC - PubMed
    1. Brog JS, Salyapongse A, Deutch AY, Zahm DS (1993) The patterns of afferent innervation of the core and shell in the “accumbens” part of the rat ventral striatum: immunohistochemical detection of retrogradely transported fluoro-gold. J Comp Neurol 338:255–278. 10.1002/cne.903380209 - DOI - PubMed

Publication types

LinkOut - more resources