. 2021 Mar 19;371(6535):eaba8310.
doi: 10.1126/science.aba8310.

γδ T cells regulate the intestinal response to nutrient sensing

Affiliations

γδ T cells regulate the intestinal response to nutrient sensing

Zuri A Sullivan et al. Science. .

Abstract

The intestine is a site of direct encounter with the external environment and must consequently balance barrier defense with nutrient uptake. To investigate how nutrient uptake is regulated in the small intestine, we tested the effect of diets with different macronutrient compositions on epithelial gene expression. We found that enzymes and transporters required for carbohydrate digestion and absorption were regulated by carbohydrate availability. The "on-demand" induction of this machinery required γδ T cells, which regulated this program through the suppression of interleukin-22 production by type 3 innate lymphoid cells. Nutrient availability altered the tissue localization and transcriptome of γδ T cells. Additionally, transcriptional responses to diet involved cellular remodeling of the epithelial compartment. Thus, this work identifies a role for γδ T cells in nutrient sensing.


Conflict of interest statement

Competing interests: Authors declare no competing interests.

Figures

Figure 1.
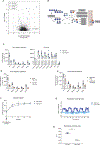
Figure 1.. Carbohydrate availability drives expression of carbohydrate transcriptional program.
(A) Volcano plot showing differentially regulated genes in small intestine epithelial cells in response to a high-carbohydrate or high-protein diet. A full list of genes can be found in table S1. Colored circles correspond to transcripts for brush border enzymes and transporters involved in digestion of carbohydrates, protein, or lipids. (B) Pancreatic enzymes, brush border enzymes, and monosaccharide transporters involved in digestion and absorption of carbohydrates, encoded by carbohydrate transcriptional program. (C to E) qPCR analysis of carbohydrate transcriptional program expression in small-intestine epithelium and pancreas of mice fed a high-carbohydrate or high-protein diet, (C) a high-carbohydrate or high-fat diet (D), or a high carbohydrate diet and treated with the alpha-glucosidase inhibitor acarbose (E). (F) glucose uptake in mice fed high carb or high protein diet. (G) respiratory exchange ratio and corresponding area under the curve (H) in mice fed high carbohydrate or high protein diet. n=3–4 mice per group. p-values in (A) calculated using Sleuth. Data represent mean ± SEM. P-values in B-H calculated by Student’s t test. *P<0.05, **P<0.01, ***P<0.001. Data are representative of at least two independent experiments.
Figure 2.
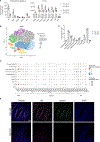
Figure 2.. Diet alters composition of epithelial compartment.
(A) Expression of carbohydrate transcriptional program in small intestine epithelium and pancreas in mice fed high carbohydrate diet for 5 days and subsequently switched to high protein diet for 1 or 5 days (B) t-SNE plots of major epithelial cell subsets with 10,000 cells displayed (C) Frequency of epithelial cell subsets in (B) during high-carbohydrate or high-protein diets. (D) Differential expression of nutrient handling machinery for carbohydrates, protein, and fat. A full list of genes can be found in table S2. (E) Single-molecule fluorescence in situ hybridization imaging of indicated carbohydrate program transcripts in jejunum isolated from mice fed high carbohydrate or high protein diet for 5 days. Scale bar = 100 μm. P-values in (A) calculated using Student’s t test. Data represent mean ± SEM. ***P<0.001. Data in A are representative of at least two independent experiments with n=3–4 mice per group. Data in B-D are from a single experiment with four mice per group pooled into two samples.
Figure 3.
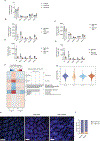
Figure 3.. γδ T cells are required for induction of carbohydrate transcriptional program.
(A) Expression of carbohydrate transcriptional program in small intestine organoids cultured with indicated varying concentrations of glucose (B-E) Expression of carbohydrate transcriptional program in small intestine epithelial cells from mice fed high carbohydrate diet under indicated genotypes and treatment conditions (F) Heatmap showing fold changes in transcript levels in lamina propria (LP) or intraepithelial (IEL) γδ or αβ T cells isolated from small intestine of mice fed high carbohydrate or high protein diet. Genes were grouped by K-means clustering and functionally analyzed by DAVID (54). Full gene lists in table S3. (n=3–4). (G) Transcriptomic reprogramming of γδ T cells in lamina propria. Violin plots showing the changes in RNA expression between high-carbohydrate and high-protein diets. The plots were scaled with the same area. The white dot represents the median. (H) Representative images of cleared ileum tissue from TCRγδ-GFP mice fed high carbohydrate or high protein diet. Dotted lines indicate border used to delineate IEL from LP region. γδ T cells are pseudocolored red. Scale bar = 100μm (I) quantification of LP and IEL γδ T-cells from cleared tissue images. n=3–4 mice per group. Data represent mean ± SEM. P-values in A-E calculated by Student’s t test. *P<0.05, **P<0.01, ***P<0.001. Data are representative of at least two independent experiments (except in F-G, which represent a single sequencing experiment).
Figure 4.
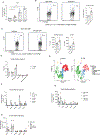
Figure 4.. γδ T cells regulate carbohydrate transcriptional program through the suppression of IL-22.
(A) Il22 transcript expression in whole small intestine from wild-type or Tcrgd-mice fed high carb or high protein diet (B) Representative intracellular cytokine staining and quantification of IL-22 production in small intestine ILC3s from mice fed high-carbohydrate or high-protein diets. (C) Representative intracellular cytokine staining (C) and quantification (D) of RORgT expression and IL-22 production in small intestine ILC3s from mice fed high carbohydrate diet and treated with anti-TCRγδ antibody or isotype control. Frequency (D) and t-SNE plots (E) showing epithelial subtypes in small intestine organoids treated with IL-22 or control media. (F) Expression of carbohydrate transcriptional program in small intestine organoids treated with indicated concentration of IL-22. (G) Expression of carbohydrate transcriptional program in small intestine epithelium of mice fed high carbohydrate or high protein diet and treated with anti-IL22 antibody or isotype control. (H) Expression of carbohydrate transcriptional program small intestine epithelial cells isolated from IL-22-deficient mice fed high carb diet and treated with anti-TCRγδ antibody or isotype control. n=3–4 mice per group. Data represent mean ± SEM. P-values (except in E) in calculated by Student’s t test. P-values in E calculated by Dirichlet-multinomial regression. *P<0.05, **P<0.01, ***P <0.001. All data are representative of at least two independent experiments, except D&E, which represent a single sequencing experiment.

Comment in

References

    1. Karasov WH, Martinez del Rio C, Caviedes-Vidal E, Ecological physiology of diet and digestive systems. Annu Rev Physiol 73, 69–93 (2011). - PubMed
    1. Karasov WH, Douglas AE, Comparative digestive physiology. Compr Physiol 3, 741–783 (2013). - PMC - PubMed
    1. Furness JB, The enteric nervous system and neurogastroenterology. Nat Rev Gastroenterol Hepatol 9, 286–294 (2012). - PubMed
    1. Hoytema van Konijnenburg DP, Mucida D, Intraepithelial lymphocytes. Curr Biol 27, R737–R739 (2017). - PubMed
    1. Gribble FM, Reimann F, Function and mechanisms of enteroendocrine cells and gut hormones in metabolism. Nature Reviews Endocrinology 15, 226–237 (2019). - PubMed

Publication types

MeSH terms