. 2021 Mar 19;371(6535):eabc8433.
doi: 10.1126/science.abc8433.

Structure-based decoupling of the pro- and anti-inflammatory functions of interleukin-10

Affiliations

Structure-based decoupling of the pro- and anti-inflammatory functions of interleukin-10

Robert A Saxton et al. Science. .

Abstract

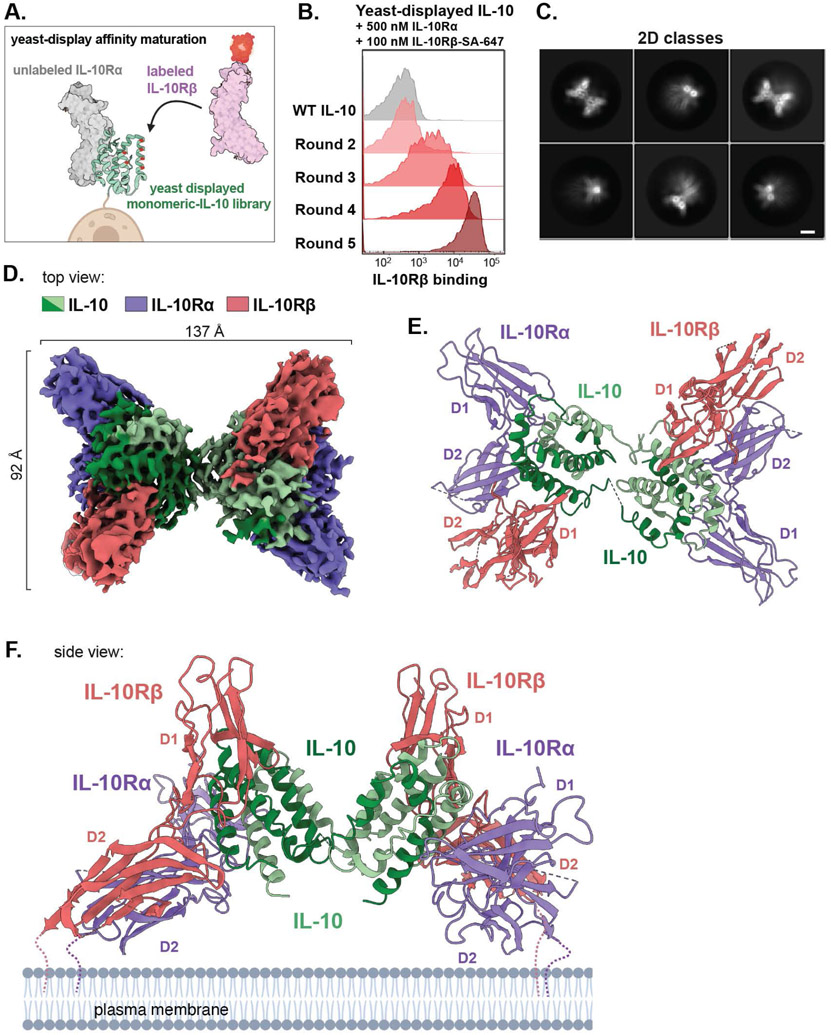
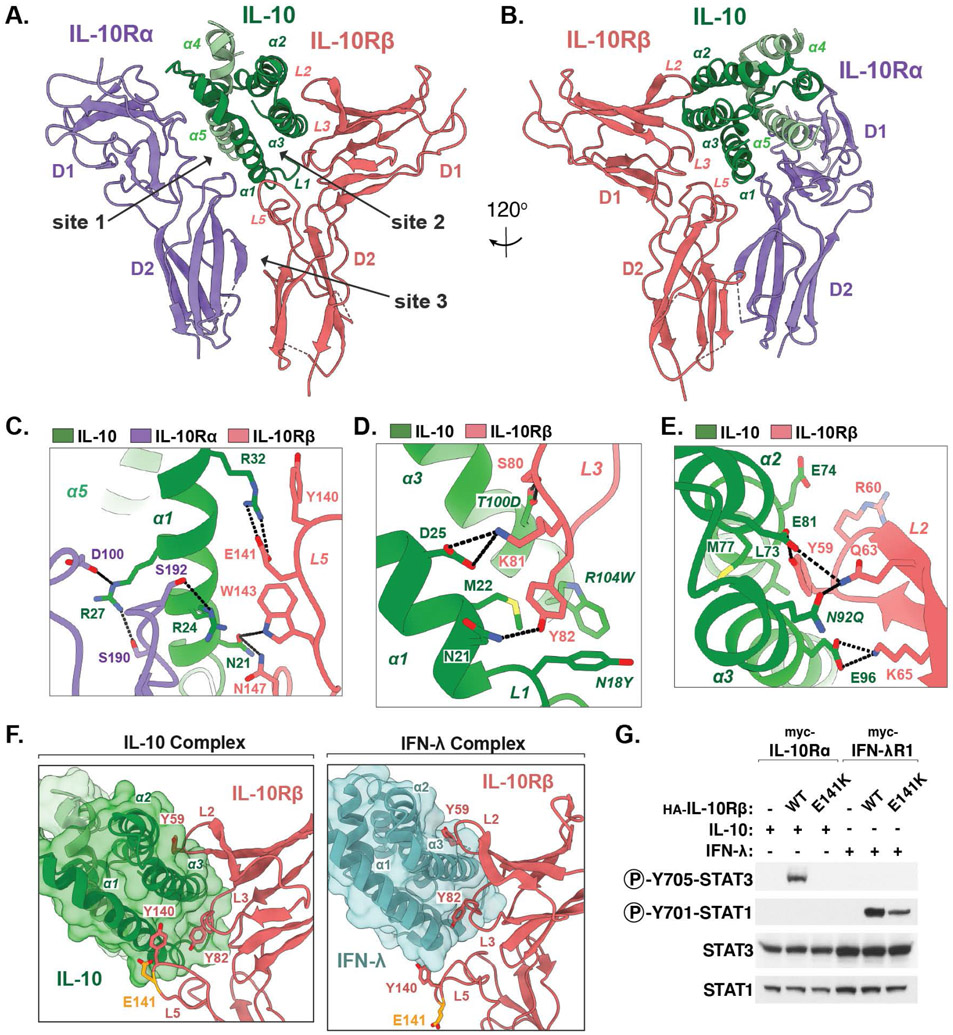
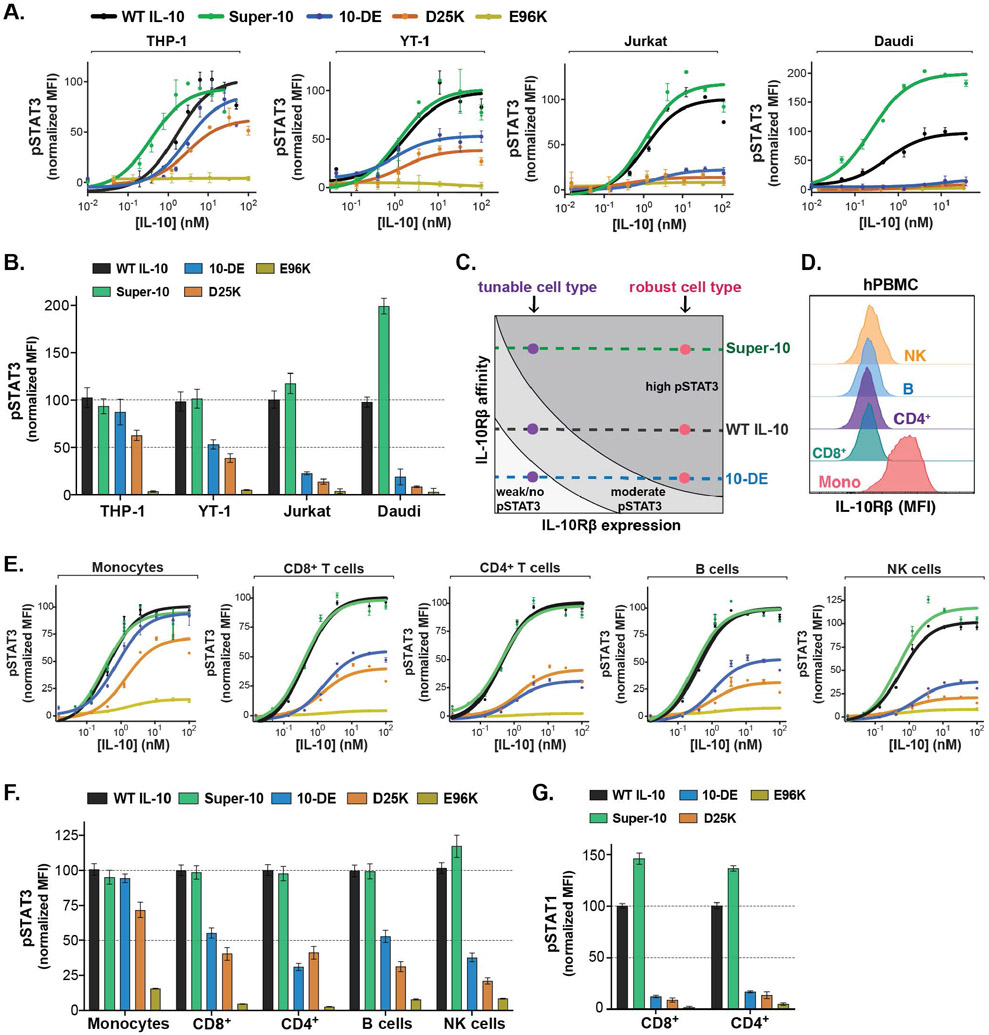
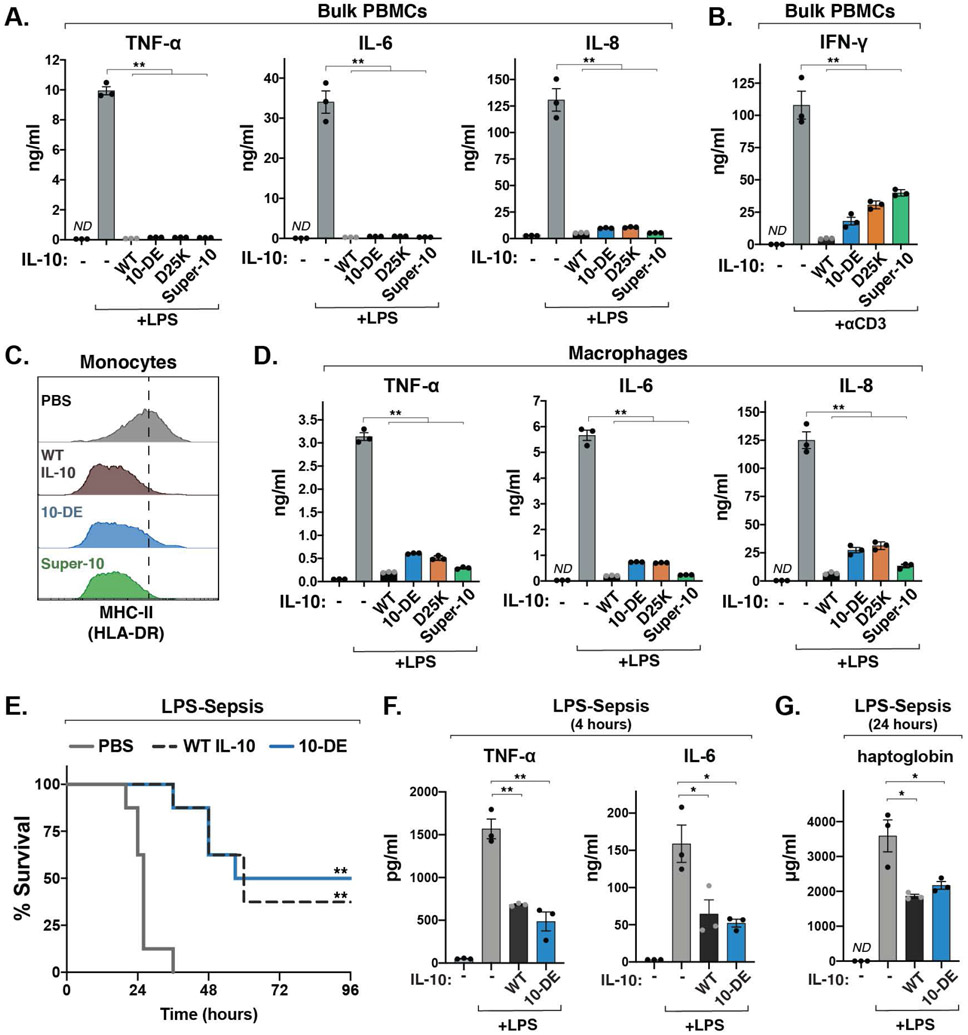
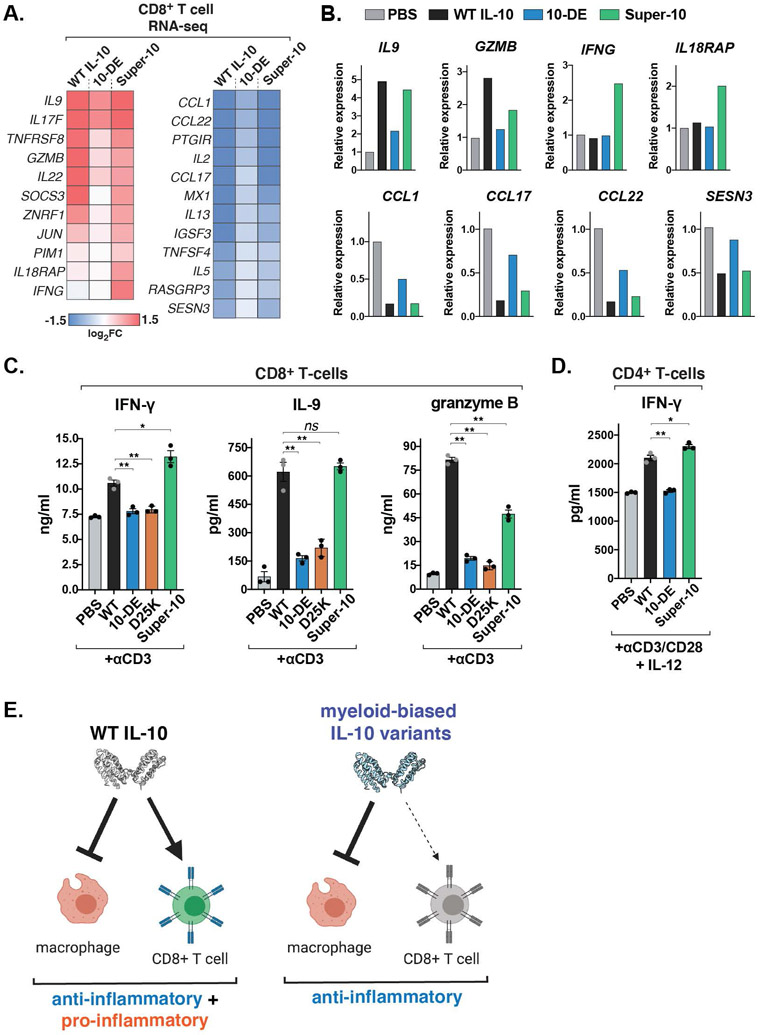
Interleukin-10 (IL-10) is an immunoregulatory cytokine with both anti-inflammatory and immunostimulatory properties and is frequently dysregulated in disease. We used a structure-based approach to deconvolute IL-10 pleiotropy by determining the structure of the IL-10 receptor (IL-10R) complex by cryo-electron microscopy at a resolution of 3.5 angstroms. The hexameric structure shows how IL-10 and IL-10Rα form a composite surface to engage the shared signaling receptor IL-10Rβ, enabling the design of partial agonists. IL-10 variants with a range of IL-10Rβ binding strengths uncovered substantial differences in response thresholds across immune cell populations, providing a means of manipulating IL-10 cell type selectivity. Some variants displayed myeloid-biased activity by suppressing macrophage activation without stimulating inflammatory CD8+ T cells, thereby uncoupling the major opposing functions of IL-10. These results provide a mechanistic blueprint for tuning the pleiotropic actions of IL-10.


Figures

Fig. 1.
Fig. 1.. Assembly and cryo-EM structure of the IL-10 signaling complex.
(A) Schematic of yeast display-based affinity maturation of IL-10. (B) Histograms of IL-10Rβ-binding by mono-IL-10 over iterative rounds of directed evolution (SA-647, Streptavidin-Alexa Fluor 647 conjugate). (C) Representative cryo-EM 2D class averages of the stabilized IL-10–IL-10Rα–IL10Rβ complex (scale bar = 5 nm). (D) Segmented density map of the IL-10 receptor complex resolved to 3.5-Å. Map threshold used in ChimeraX set to 0.25. (E, F) Top and side views of the IL-10 receptor complex with IL-10 in green, IL-10Rα in purple, and IL-10Rβ in salmon (PDB ID: 6X93).
Fig 2:
Fig 2:. Structural basis for IL-10Rβ engagement by IL-10.
(A, B) Two views of the IL-10–IL-10Rα–IL-10Rβ ternary sub-complex, with IL-10 in green, IL-10Rα in purple, and IL-10Rβ in salmon. (C-E) Close-up views of the IL-10–IL-10Rβ binding interface. Hydrogen bonds and salt-bridges are shown as black dashed-lines. Mutated residues in affinity matured super-10 are italicized. (F) Corresponding views of the IL-10–IL-10Rβ interface and the IFN-λ–IL-10Rβ interface (PDB ID: 5T5W). The IBD-associated residue Glu141 is shown in yellow. (G) Immunoblot of lysates prepared from HEK-293T cells transiently expressing the indicated receptor constructs and stimulated with IL-10 or IFN-λ for 20 min.
Fig. 3.
Fig. 3.. Tuning affinity for IL-10Rβ reveals differential IL-10 signaling plasticity across cell types.
(A) Dose-response curves for phospho-STAT3 in cell lines stimulated with WT or mutant IL-10, analyzed by flow cytometry. Data are shown as a percent of maximal WT IL-10 mean fluorescent intensity (MFI) (n≥2, N≥3). (B) Normalized Emax values for phospho-STAT3 calculated from sigmoidal dose-response curves (mean ± SEM). (C) Diagram illustrating how IL-10Rβ expression and ligand affinity influence maximal STAT3 activation. (D) Representative histograms showing IL-10Rβ surface expression in human PBMCs analyzed by flow cytometry. (E) Dose-response curves for phospho-STAT3 in human PBMCs stimulated with WT or mutant IL-10, analyzed by flow cytometry. Data are shown as a percent of maximal WT IL-10 mean fluorescent intensity (MFI) (n≥2, N=3). (F) Normalized Emax values for phospho-STAT3 calculated from sigmoidal dose-response curves (mean ± SEM). (G) Phospho-STAT1 activation in primary immune cells treated with 10 nM of WT or mutant IL-10, analyzed by flow cytometry. (mean ± SEM, n=3, N=2).
Fig. 4.
Fig. 4.. Engineered IL-10 variants retain anti-inflammatory functions of IL-10
(A) Levels of IL-6, IL-8, and TNF-α from bulk human PBMCs treated with LPS and the indicated IL-10 variant, measured by ELISA. (mean ± SEM, n=3, N=3, **P<0.01, two-sided Student’s t test; ND, not detectable). (B) Levels of IFN-γ from bulk PBMCs stimulated with anti-CD3 antibody for 72 hours, alone or in combination with the indicated IL-10 variants, measured by ELISA. (mean ± SEM, n=3, N=3, **P<0.01, two-sided Student’s t test). (C) Representative histograms of MHC class II surface expression on human peripheral monocytes activated with LPS alone or in combination with the indicated IL-10 variant, analyzed by flow cytometry (n=5, N=2). (D) Levels of IL-6, IL-8, and TNF-α produced by primary human monocyte-derived macrophages stimulated with LPS, measured by ELISA. (mean ± SEM, n=3, N=3, **P<0.01, two-sided Student’s t test). (E) Survival after intraperitoneal injection of LPS (15 mg/kg) in combination with PBS, WT IL-10 or 10-DE (n=8 mice, N=2, **P <0.01, log-rank Mantel-Cox test). (H, I) Levels of TNF-α, IL-6, and haptoglobin in mouse serum following injection of LPS (4 mg/kg) and the indicated IL-10 variant, measured by ELISA (mean ± SEM, n=3, N=2, *P<0.05. **P<0.01, two-sided Student’s t test).
Fig. 5.
Fig. 5.. Myeloid-biased IL-10 variants have reduced capacity to promote inflammatory T cell functions
(A) Heatmaps of differentially expressed genes in activated CD8+ T cells treated with the indicated IL-10 variants for 24 hours, analyzed by RNA-seq (n=2 biological replicates). (B) Fold change of select IL-10-regulated genes in activated CD8+ T cells treated with the indicated IL-10 variants for 24 hours, analyzed by RNA-seq (n=2 biological replicates). (C) Levels of IFN-γ, IL-9, and granzyme B from activated human CD8+ T cells cultured with the indicated IL-10 variants, measured by ELISA. (mean ± SEM, n=3, N=3, ns P>0.05, *P<0.05, **P<0.01, two-sided Student’s t test). (D) Levels of IFN-γ from isolated CD4+ T cells polarized to Th1 cells in the presence or absence of the indicated IL-10 variant for 5 days, measured by ELISA (mean ± SEM, n=3, N=2 *P<0.05. **P<0.01, two-sided Student’s t test). (E) Schematic depicting myeloid-biased IL-10 agonists decoupling the pro- and anti-inflammatory functions of IL-10.

References

    1. Medzhitov R, Origin and physiological roles of inflammation. Nature 454, 428–435 (2008). - PubMed
    1. Kotas ME, Medzhitov R, Homeostasis, inflammation, and disease susceptibility. Cell 160, 816–827 (2015). - PMC - PubMed
    1. Moore KW, de Waal Malefyt R, Coffman RL, O'Garra A, Interleukin-10 and the interleukin-10 receptor. Annu. Rev. of Immunol 19, 683–765 (2001). - PubMed
    1. Ouyang W, Rutz S, Crellin NK, Valdez PA, Hymowitz SG, Regulation and functions of the IL-10 family of cytokines in inflammation and disease. Annu. Rev. of Immunol 29, 71–109 (2011). - PubMed
    1. Fiorentino DF, Zlotnik A, Mosmann TR, Howard M, O'Garra A, IL-10 inhibits cytokine production by activated macrophages. J. Immunol 147, 3815–3822 (1991). - PubMed

Publication types

MeSH terms