. 2021 Mar 19;371(6535):1245-1248.
doi: 10.1126/science.abe0981.

Early developmental asymmetries in cell lineage trees in living individuals

Affiliations

Early developmental asymmetries in cell lineage trees in living individuals

Liana Fasching et al. Science. .

Abstract

Mosaic mutations can be used to track cell lineages in humans. We used cell cloning to analyze embryonic cell lineages in two living individuals and a postmortem human specimen. Of 10 reconstructed postzygotic divisions, none resulted in balanced contributions of daughter lineages to tissues. In both living individuals, one of two lineages from the first cleavage was dominant across tissues, with 90% frequency in blood. We propose that the efficiency of DNA repair contributes to lineage imbalance. Allocation of lineages in postmortem brain correlated with anterior-posterior axis, associating lineage history with cell fate choices in embryos. We establish a minimally invasive framework for defining cell lineages in any living individual, which paves the way for studying their relevance in health and disease.


Conflict of interest statement

Competing interests: The authors declare no competing interests.

Figures

Figure 1.
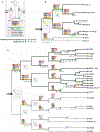
Figure 1.. Reconstruction of early cell lineages in two individuals reveals lineage imbalance across tissues.
(A) Outline showing location of the biopsies used to derive iPSC lines from skin fibroblasts. Sequenced iPSC lines are listed in (B, C) at the terminus of each branch (LT#4, LT#7, LT#1 with shallow coverage are italicized). Counts of mutations per line are shown in Fig. S2. (B,C) Early lineage trees, with circles representing cells and lines likely parental relationships. Open circles mark cells with no mosaic variant leading to ambiguous branching. Mosaic SNVs (black) and indels (green) are denoted by Latin and Greek letters. SNVs found only in bulk tissues are marked with asterisks. Lineage frequencies in bulk samples are shown in log scale by bar graphs, with arrows indicating the expected frequencies for a balanced lineage contribution. Squared plots show correlations between the frequencies in bulk samples for upper (Y-axis) and lower (X-axis) branches, with stars indicating expected frequencies for balanced contributions. Division at branch marked by e, f, g, h may not be fully captured, as frequencies in saliva are inconsistent with diagonal.
Figure 2.
Figure 2.
(A) Fraction of cells contributed from the dominant blastomeres in the first cell division to various tissues. (B) Difference of sister lineages contribution to blood, saliva and urine for fully reconstructed cell divisions. (C) Lineage contribution to different brain regions at each cell division; lineages marked by one of the corresponding mutations. FR-GZ, frontal germinal zone; FR-CX, PA-CX and OC-CX, frontal, parietal and occipital cortex, respectively; CB stands for cerebellum. Arrows indicate the correspondence between mother and daughter lineages. (D) Regression of lineage frequency across brain regions. Significant correlations (p-value < 0.05) are shown by solid lines and are marked by stars in C, while non-significant correlations are shown by dashed lines. Lineages with marginal significance (p-value < 0.1) are marked by variants ‘α’, ‘a’ and ‘o’. Regressions are shown for 11 lineages with independent frequencies (see Methods).
Figure 3.
Figure 3.. Recurrence of a germline SNP in LB’s mother as a mosaic SNV in LB.
(A) Variant allele frequency of the T>A somatic SNV variant across LB’s iPSC lines (orange), LB’s bulk samples (blue), and blood of his parents (green). (B) Schematics of germline haplotype inheritance based on population-based SNP phasing for LB (LB1, LB2), father (P1, P2), and mother (M1, M2). Ten non-contiguous variable positions in parents downstream and upstream from the somatic SNV are shown. (C) Read level evidence for the maternal haplotype with the variant not being inherited by LB. Every row has a single connected (light grey lines) pair of reads (dark grey lines). The SNP in the mother is in phase with 4 nearby variants, none of which is present in LB.

Comment in

  • Human cell-lineage imbalances.
    Burgess DJ. Burgess DJ. Nat Rev Genet. 2021 May;22(5):266-267. doi: 10.1038/s41576-021-00358-4. Nat Rev Genet. 2021. PMID: 33785896 No abstract available.

References

    1. Ju YS et al., Somatic mutations reveal asymmetric cellular dynamics in the early human embryo. Nature 543, 714–718 (2017). - PMC - PubMed
    1. Bae T et al., Different mutational rates and mechanisms in human cells at pregastrulation and neurogenesis. Science 359, 550–555 (2018). - PMC - PubMed
    1. Weinberger DR, Luchins DJ, Morihisa J, Wyatt RJ, Asymmetrical volumes of the right and left frontal and occipital regions of the human brain. Ann Neurol 11, 97–100 (1982). - PubMed
    1. Aitken SJ et al., Pervasive lesion segregation shapes cancer genome evolution. Nature 583, 265–270 (2020). - PMC - PubMed
    1. Ellegren H, Microsatellite mutations in the germline: implications for evolutionary inference. Trends Genet 16, 551–558 (2000). - PubMed

Publication types

LinkOut - more resources