. 2021 Mar 19;371(6535):1249-1253.
doi: 10.1126/science.abe1544.

Landmarks of human embryonic development inscribed in somatic mutations

Affiliations

Landmarks of human embryonic development inscribed in somatic mutations

Sara Bizzotto et al. Science. .

Abstract

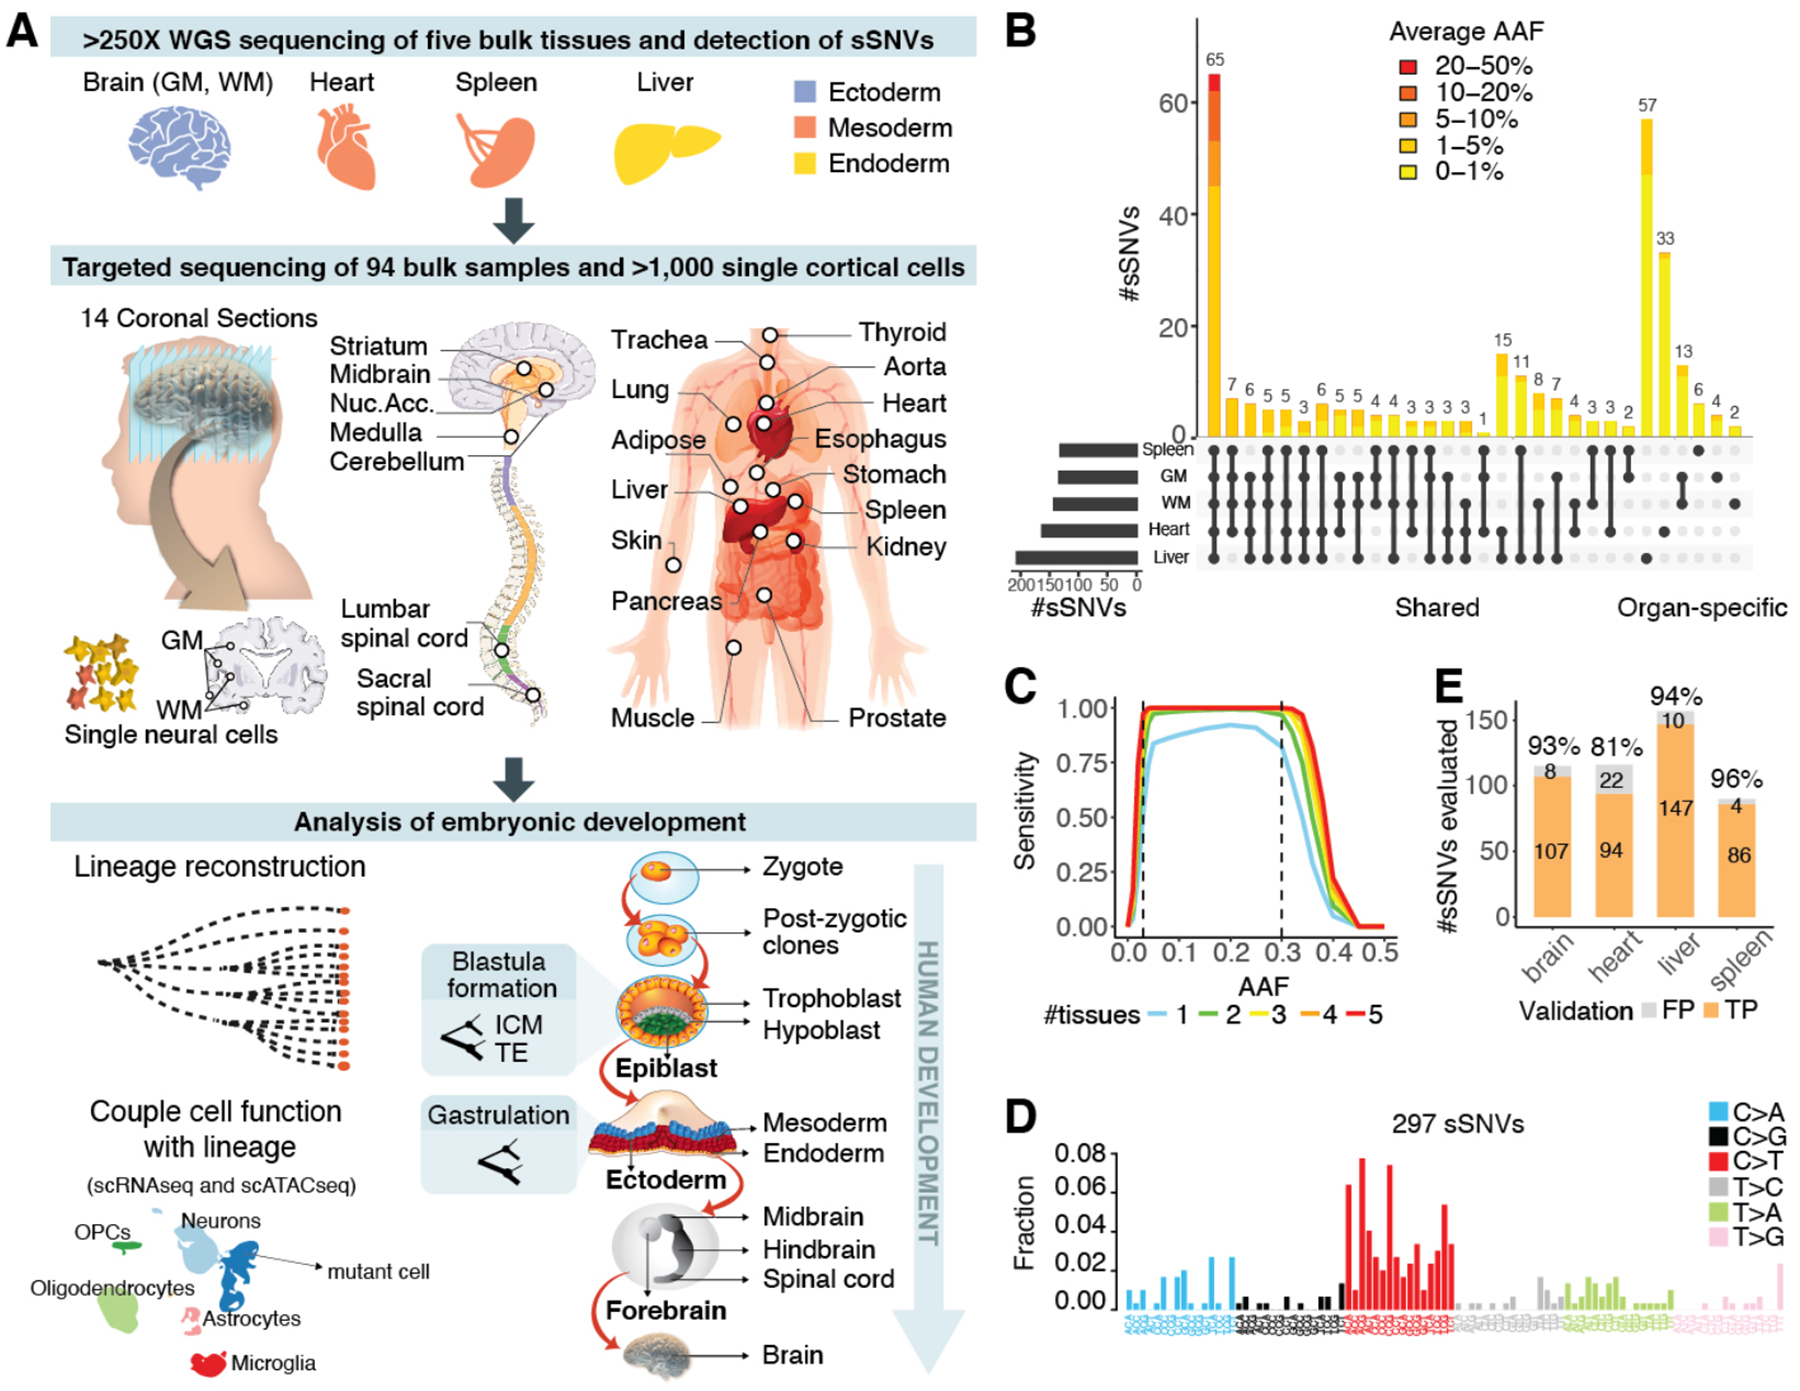
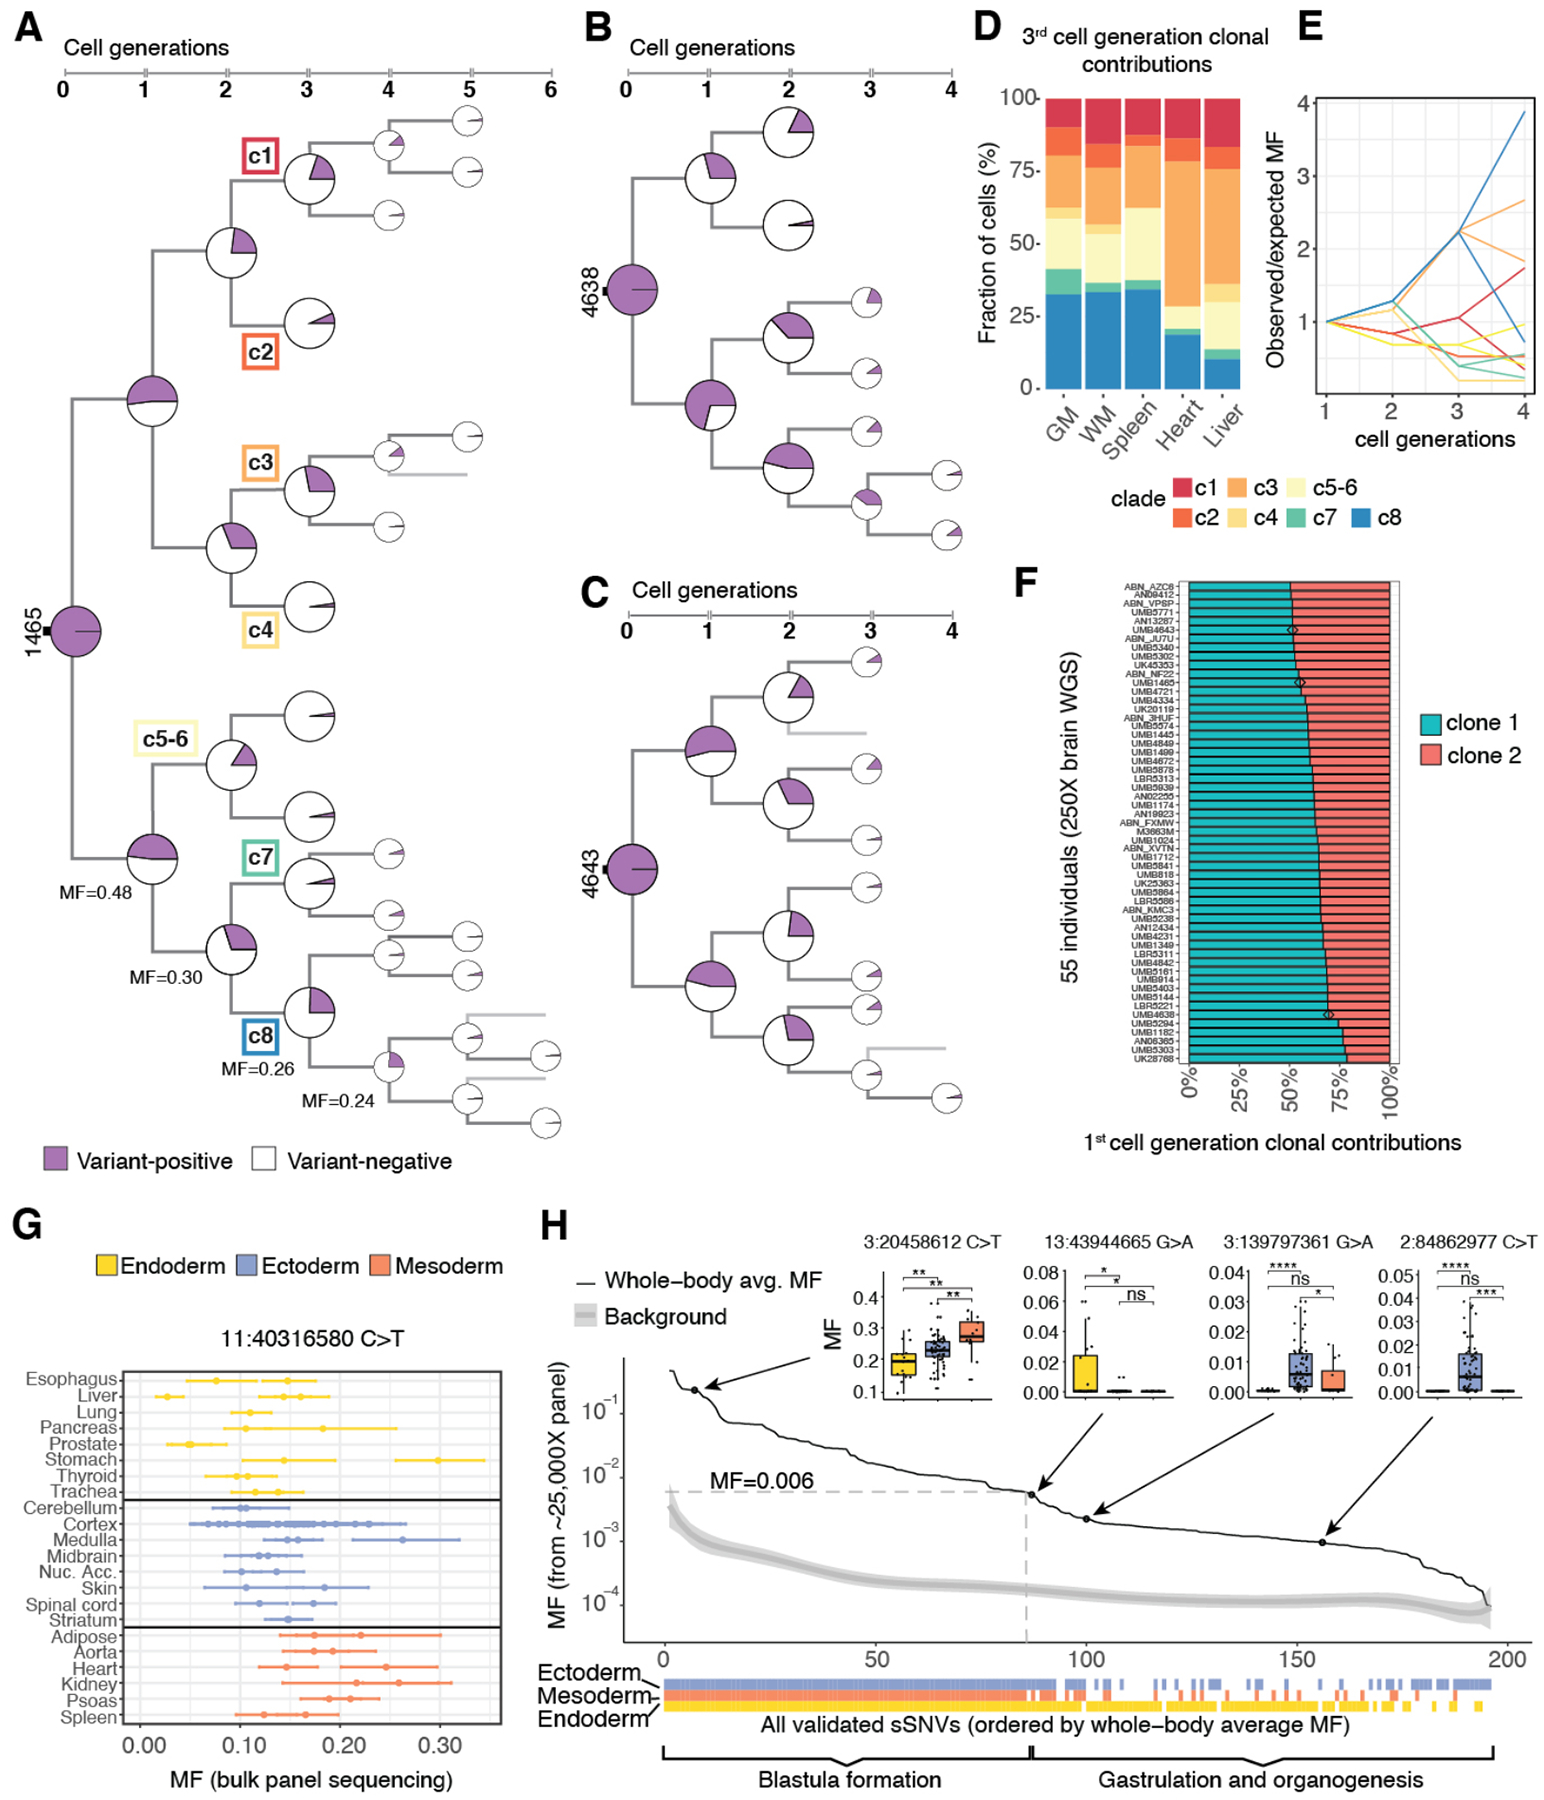
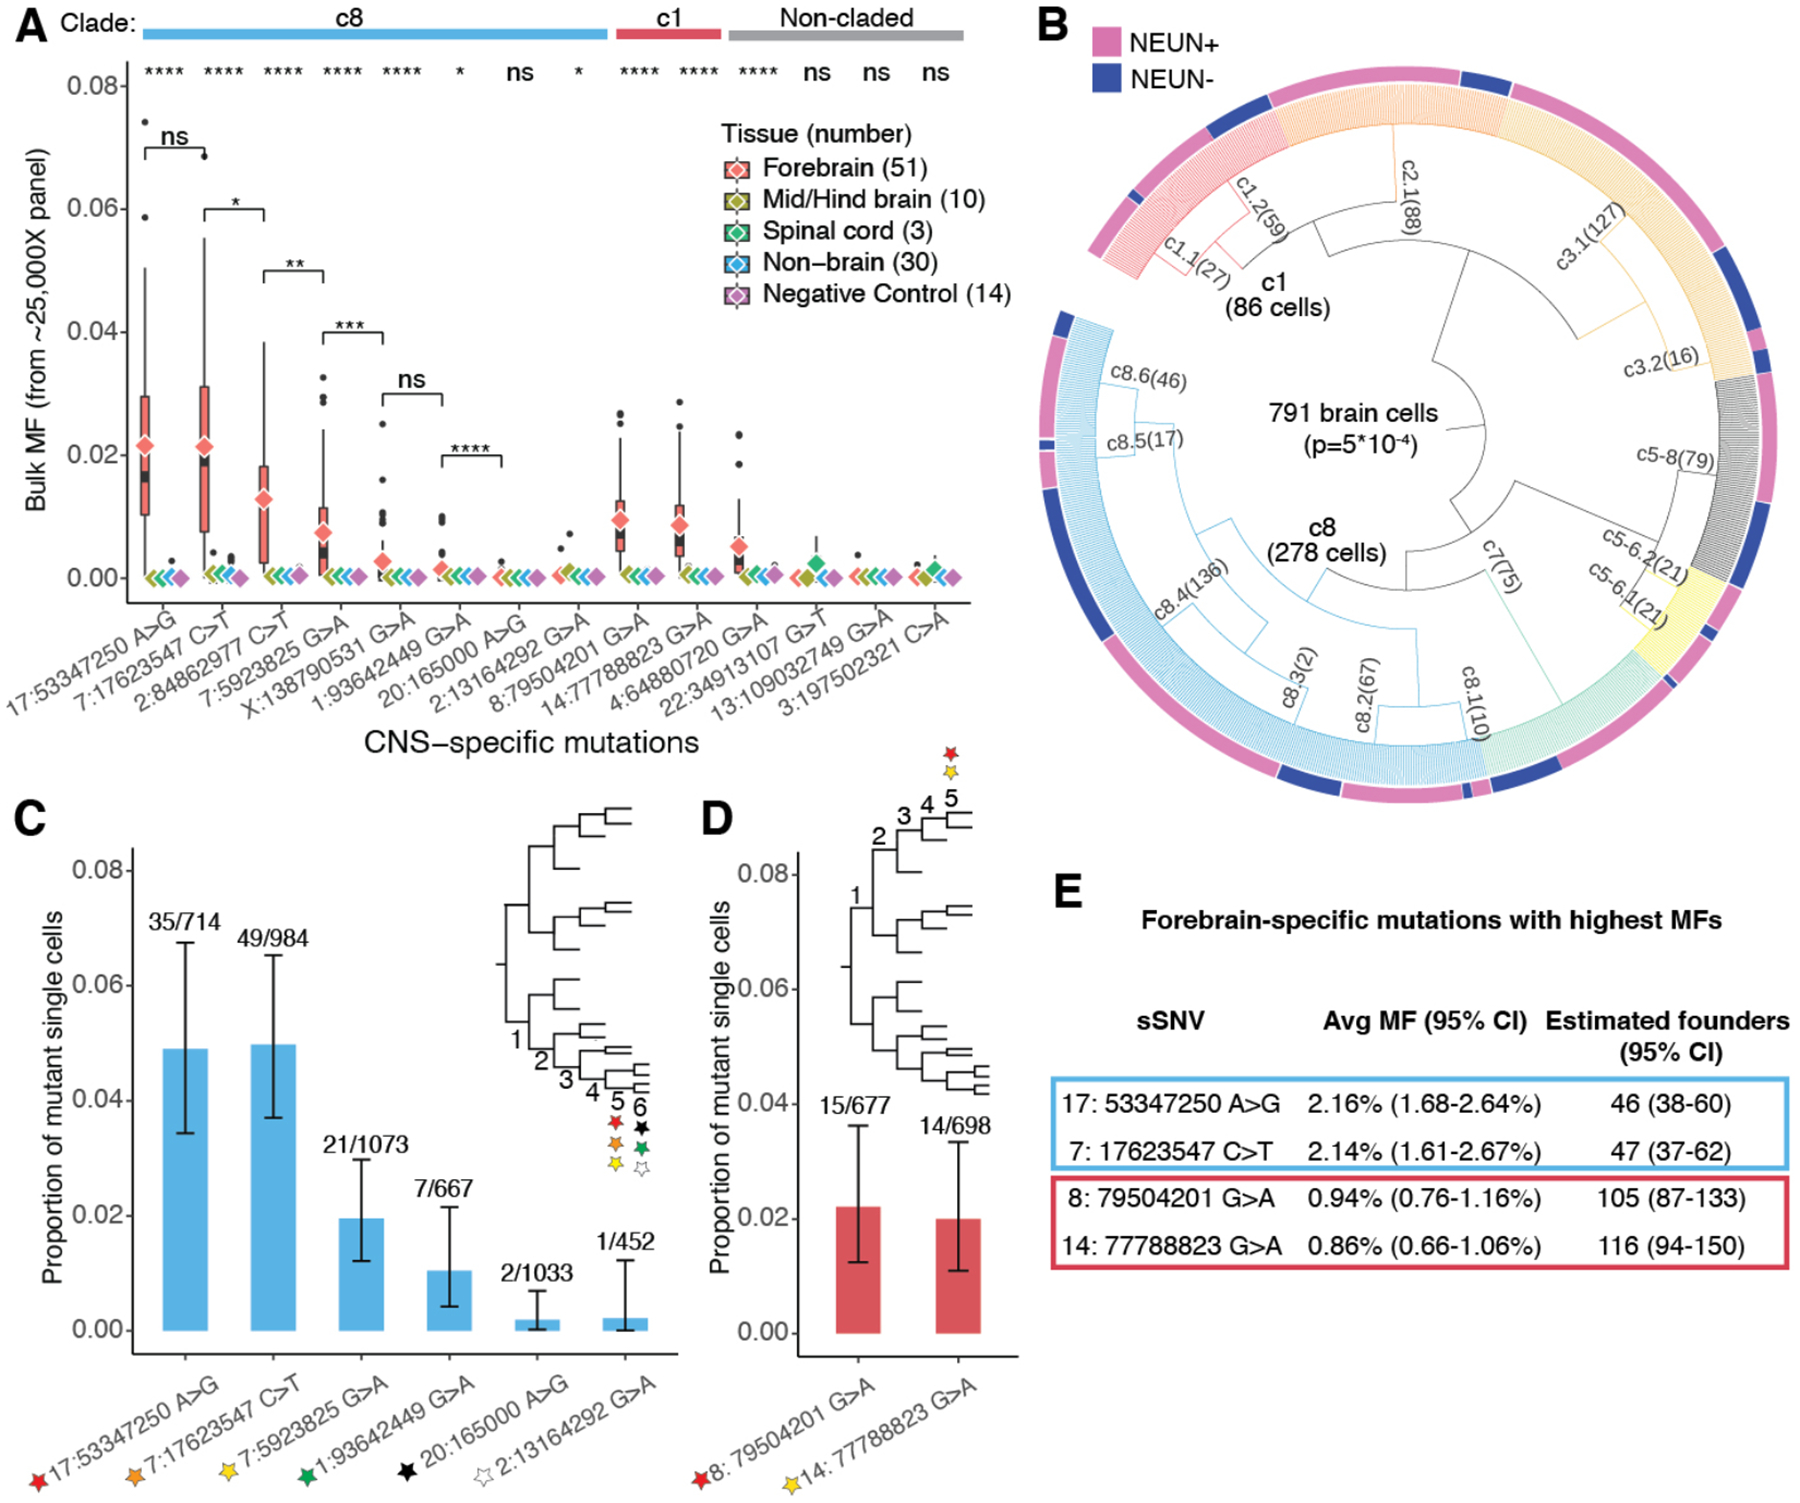
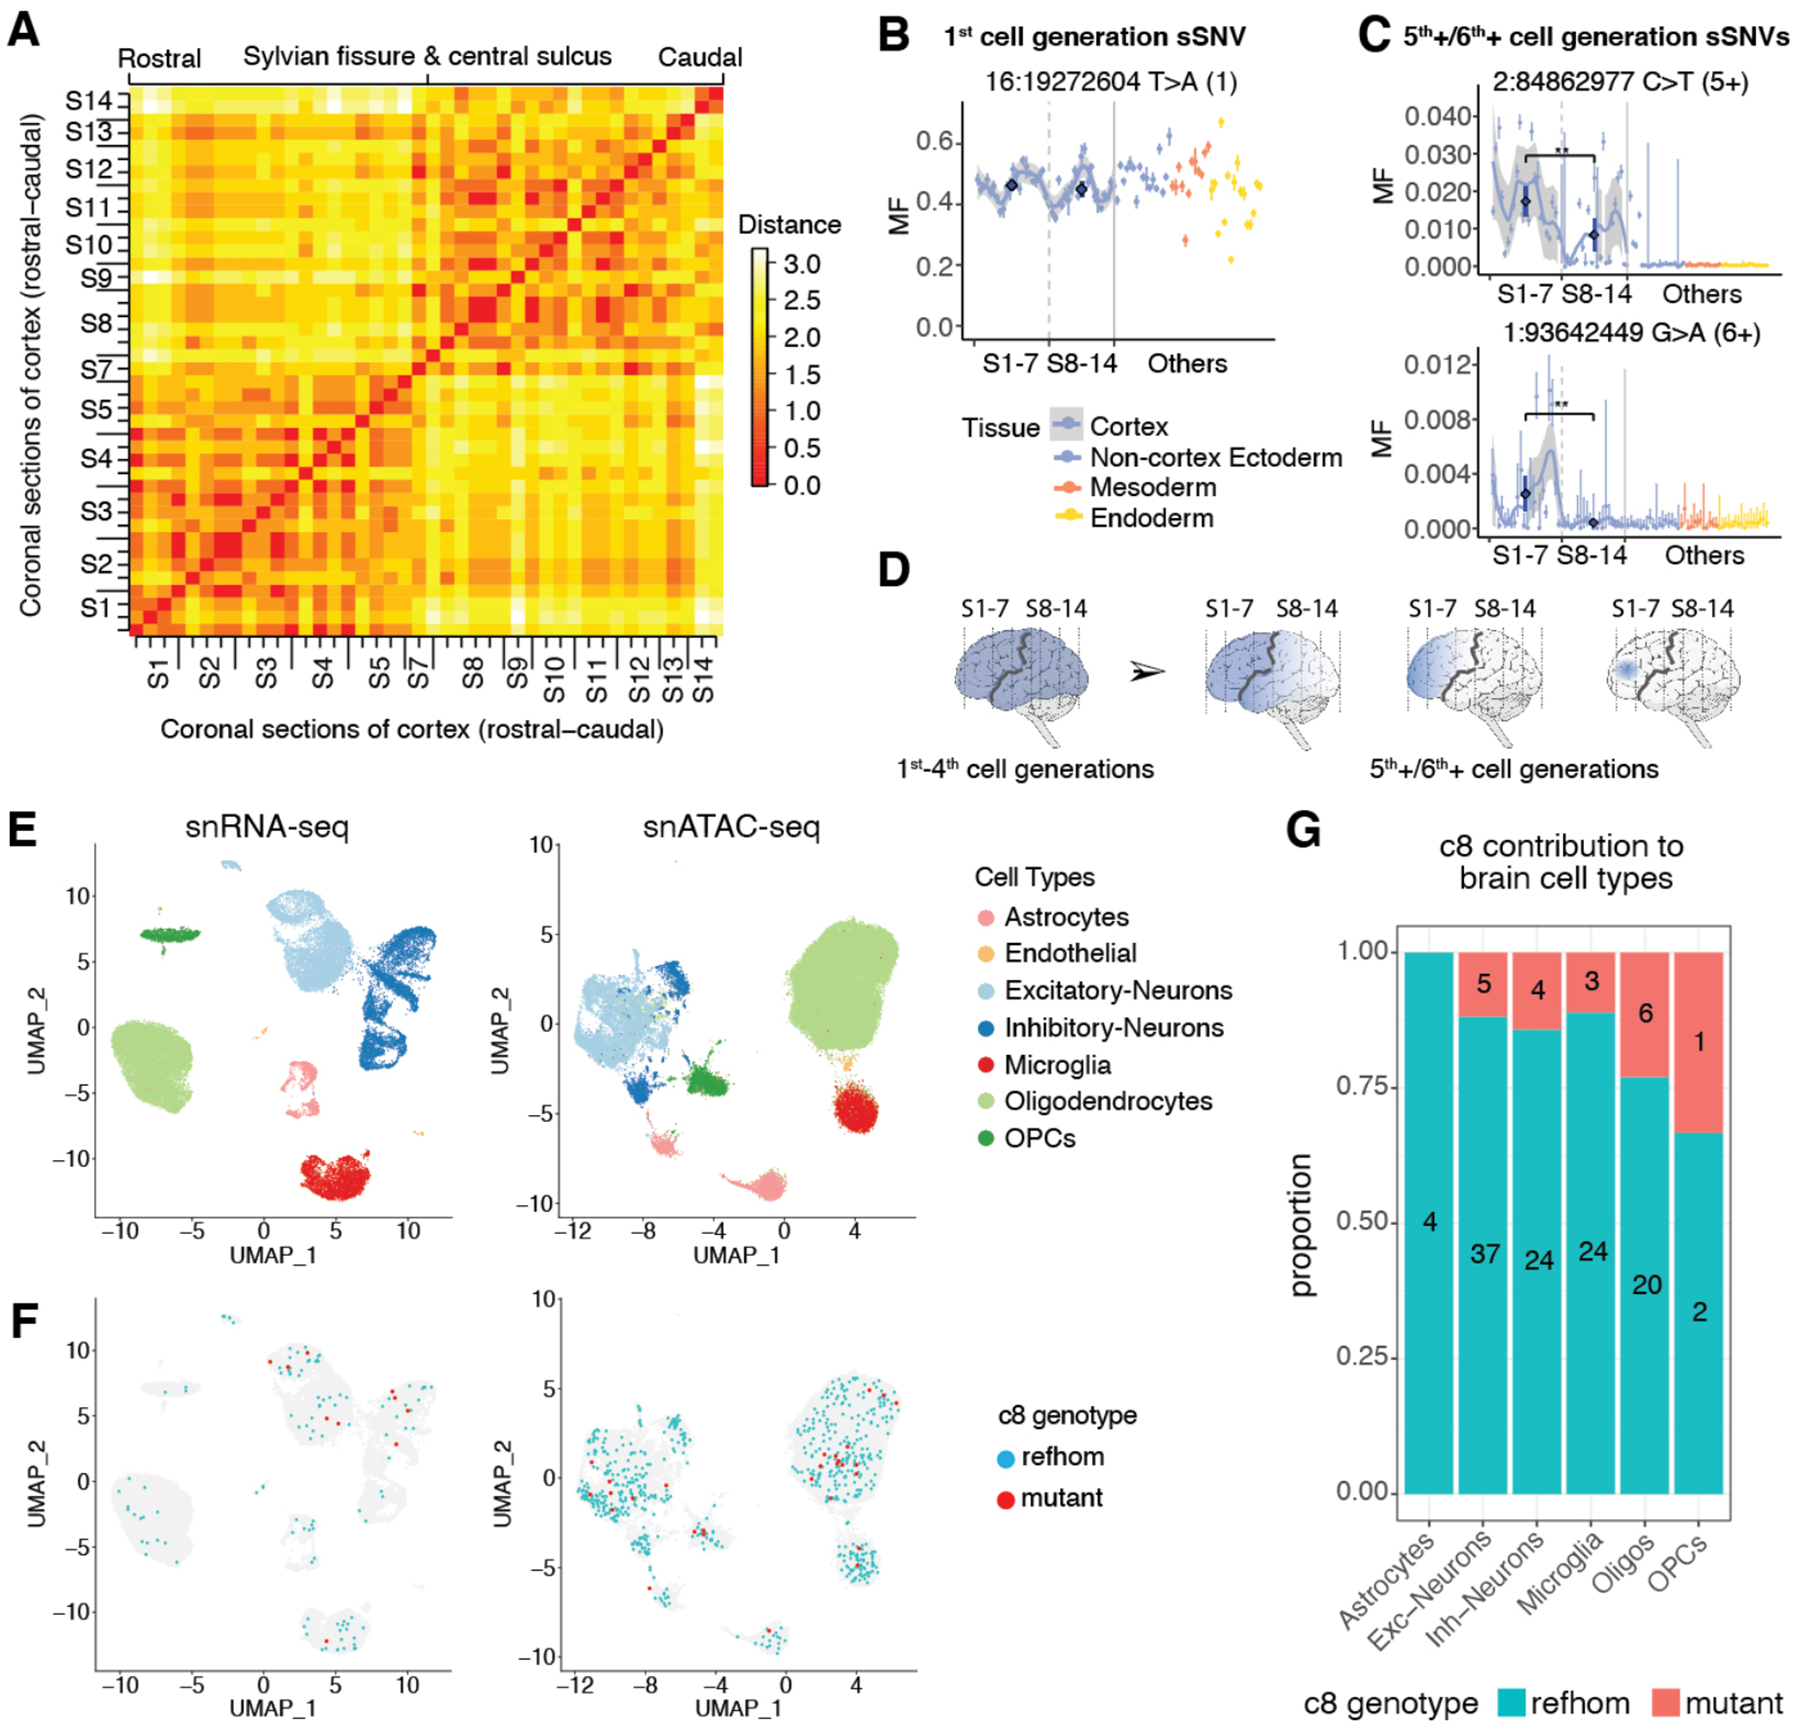
Although cell lineage information is fundamental to understanding organismal development, very little direct information is available for humans. We performed high-depth (250×) whole-genome sequencing of multiple tissues from three individuals to identify hundreds of somatic single-nucleotide variants (sSNVs). Using these variants as "endogenous barcodes" in single cells, we reconstructed early embryonic cell divisions. Targeted sequencing of clonal sSNVs in different organs (about 25,000×) and in more than 1000 cortical single cells, as well as single-nucleus RNA sequencing and single-nucleus assay for transposase-accessible chromatin sequencing of ~100,000 cortical single cells, demonstrated asymmetric contributions of early progenitors to extraembryonic tissues, distinct germ layers, and organs. Our data suggest onset of gastrulation at an effective progenitor pool of about 170 cells and about 50 to 100 founders for the forebrain. Thus, mosaic mutations provide a permanent record of human embryonic development at very high resolution.


Conflict of interest statement

Competing interests: Authors declare no competing interests.

Figures

Fig. 1.
Fig. 1.. Mosaic events of human development.
(A) Schematic of the workflow for individual 1465. (B) Number and AAF of sSNVs detected across samples from case 1465. (C) Sensitivity of MosaicForecast in detecting sSNVs from five 250X WGS data. (D) Trinucleotide context profile of the identified sSNVs. (E) Numbers of true positive (TP) and false positive (FP) sSNVs present in the WGS data validated by deep amplicon-sequencing.
Fig. 2.
Fig. 2.. Asymmetric contribution of early embryonic clones to the human body.
(A-C) Phylogenetic trees of individuals 1465, 4638, and 4643. The cell-generation numbers for later sSNVs (5th/6th) are likely to be underestimates due to the limited number of cells used for lineage reconstruction and the reduced power of detecting very low MF sSNVs. (D) 3rd cell generation clones (c1-c8) of 1465 show unequal contributions to specific organs (p-value <10−15, chi-square test), with the fraction of cells in each tissue contributed by clones c1-c8 normalized by summing to 100% (see Fig. S2D for non-normalized values). (E) Observed whole-body MFs for sSNVs from clades c1-c8 across 2–4 cell generations strongly deviate from expected values based on a symmetrical model of development. 95% CIs calculated with binomial sampling are reported in Table S2. (F) First cell generation clonal contributions are asymmetric and variable across 55 individuals (p<10−13, K-S test for the null hypothesis of symmetry). Individuals 1465, 4638 and 4643 are marked with a diamond. (G) High intra-organ fluctuation of MFs for early-embryonic mosaic variants, illustrated for chr11:40316580 C>T. (H) sSNVs restricted to one or two germ layers mark the beginning of gastrulation. 196 validated sSNVs are ordered “chronologically” by their whole-body MFs (8). MFs in different germ layers are compared in four examples (two-tailed Wilcoxon rank sum test; ns = non-significant; *: p ≤ 0.05; **: p ≤ 0.01; ***: p ≤ 0.001; ****: p ≤ 0.0001).
Fig. 3.
Fig. 3.. Brain-specific sSNVs estimate the number of forebrain founder cells.
(A) MFs of 14 CNS-restricted sSNVs show significant enrichment of some variants in forebrain-derived samples (two-tailed Wilcoxon rank sum test, significance levels on the top). c8, c1 (Fig. 2A) and non-claded variants are indicated. chr17:53347250 A>G and chr7:17623547 C>T are the earliest brain-specific sSNVs in c8, based on average forebrain MFs (diamond symbols). The forebrain MFs between sSNVs are compared to estimate the likelihood that they arose at the same generation (two-tailed Wilcoxon rank sum test). (B) 791 single cells (out of 1228) are successfully assigned to lineage clades upon targeted sequencing of 37 sSNVs (8). NEUN+ and NEUN- cells are differentially distributed across clades (two-tailed Fisher’s exact test). (C) chr17:53347250 A>G and chr7:17623547 C>T are confirmed as the earliest lineage markers within c8 by single cell genotyping (shown are the number of mutant cells over the number of cells with >10X coverage at the position). (D) Same as (C) for c1. (E) Estimates of forebrain-founder cells based on average MFs (25,000X sequencing).
Fig. 4.
Fig. 4.. Topographic patterns and function of embryonic clones in the rostro-caudal cerebral cortex.
(A) Frontal regions (sections 1–7) and posterior regions (sections 8–14) form two broadly definable lineage clusters. Euclidian distances are computed based on the presence (score=1) or absence (score=0) of sSNVs. (8). (B) Earlier clones from the 1st to the 4th cell generations contribute to all rostro-caudal sections, as illustrated by an sSNV from 1st cell generation (Fig. S6A). The AAFs across sequential sections of cortex are shown with a confidence band. The average MFs (dark blue) in the two regions are compared using Wilcoxon rank sum test. (C) 5th+/6th+ cell-generation clones from the lineage tree show restriction in frontal cortex regions (Fig. S6B). (D) Successive subclones from 1st to 6th+ cell generations show progressive restriction to frontal cortical areas separated by Sylvian fissure and central sulcus (black line). (E) Clusters of major brain cell types identified by PFC snRNA-seq and snATAC-seq. (F) Distribution of reference homozygous (refhom) and mutant cells for clade c8 markers with >0 coverage across cell types. (G) Proportions of refhom cells and mutant cells for 4th cell generation clade c8 markers across brain cell types (p=0.58, Fisher’s exact test, see also Table S10).

Comment in

  • Human cell-lineage imbalances.
    Burgess DJ. Burgess DJ. Nat Rev Genet. 2021 May;22(5):266-267. doi: 10.1038/s41576-021-00358-4. Nat Rev Genet. 2021. PMID: 33785896 No abstract available.

References

    1. Kalhor R et al., Developmental barcoding of whole mouse via homing CRISPR. Science 361, (2018). - PMC - PubMed
    1. Han X et al., Construction of a human cell landscape at single-cell level. Nature 581, 303–309 (2020). - PubMed
    1. Rodin RE et al., The landscape of somatic mutation in cerebral cortex of autistic and neurotypical individuals revealed by ultra-deep whole-genome sequencing. Nature Neuroscience, (2021). - PMC - PubMed
    1. Dou Y et al., Accurate detection of mosaic variants in sequencing data without matched controls. Nat Biotechnol 38, 314–319 (2020). - PMC - PubMed
    1. Ju YS et al., Somatic mutations reveal asymmetric cellular dynamics in the early human embryo. Nature 543, 714–718 (2017). - PMC - PubMed

Publication types

MeSH terms