. 2021 Mar 18;11(1):6235.
doi: 10.1038/s41598-021-83818-5.

Ecosystem response persists after a prolonged marine heatwave

Affiliations

Ecosystem response persists after a prolonged marine heatwave

Robert M Suryan et al. Sci Rep. .

Abstract

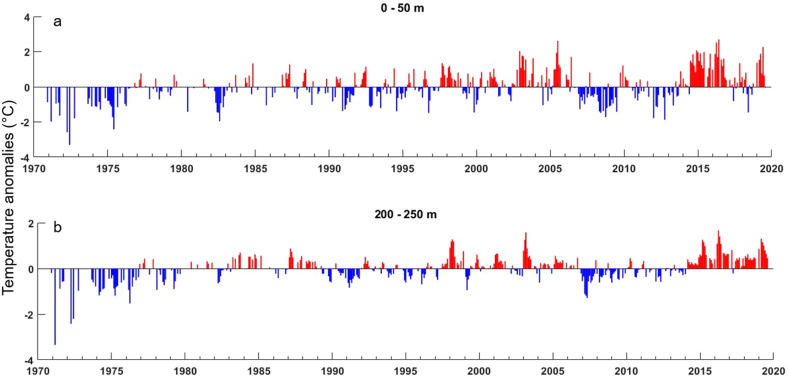
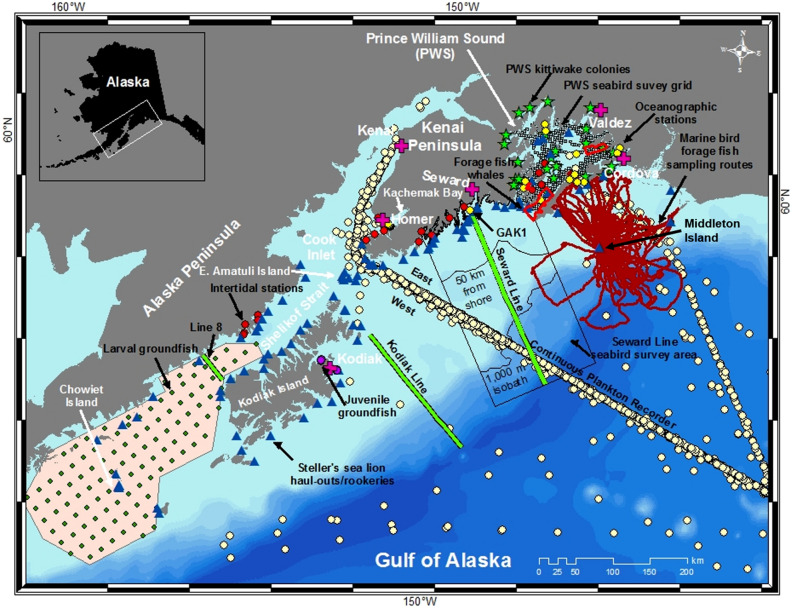
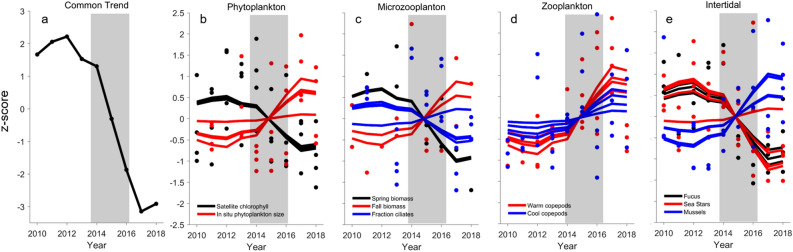
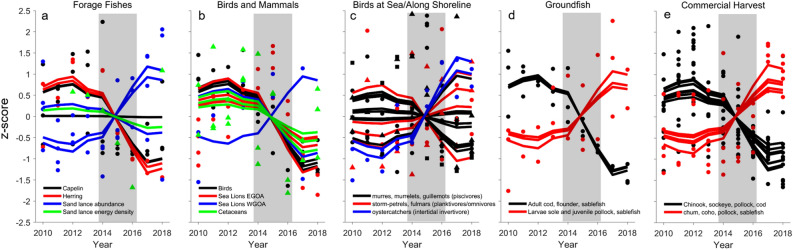
Some of the longest and most comprehensive marine ecosystem monitoring programs were established in the Gulf of Alaska following the environmental disaster of the Exxon Valdez oil spill over 30 years ago. These monitoring programs have been successful in assessing recovery from oil spill impacts, and their continuation decades later has now provided an unparalleled assessment of ecosystem responses to another newly emerging global threat, marine heatwaves. The 2014-2016 northeast Pacific marine heatwave (PMH) in the Gulf of Alaska was the longest lasting heatwave globally over the past decade, with some cooling, but also continued warm conditions through 2019. Our analysis of 187 time series from primary production to commercial fisheries and nearshore intertidal to offshore oceanic domains demonstrate abrupt changes across trophic levels, with many responses persisting up to at least 5 years after the onset of the heatwave. Furthermore, our suite of metrics showed novel community-level groupings relative to at least a decade prior to the heatwave. Given anticipated increases in marine heatwaves under current climate projections, it remains uncertain when or if the Gulf of Alaska ecosystem will return to a pre-PMH state.


Conflict of interest statement

The authors declare no competing interests.

Figures

Figure 1
Figure 1
The multi-year heatwave that began in 2014 was the most persistent in the 48-year time series and it extended throughout the water column of the continental shelf. Temperature anomalies (°C) of the (a) upper (0–50 m) and (b) lower (200–250 m) water column at the GAK1 oceanographic station in the Gulf of Alaska, 1973–2019 (for location, see Fig. 2).
Figure 2
Figure 2
Sampling locations in the northern Gulf of Alaska. The division for references to eastern and western study area is the continuous plankton recorder transect into Cook Inlet. The black contours within the Seward Line marine bird survey area differentiate inner continental shelf (shore to 50 km from shore), middle shelf (50 km from shore to shelf-slope break, defined using 1000 m isobath) and oceanic (seaward of the 1000 m isobath) domains. The 1000 m isobath is also used to distinguish shelf versus oceanic zooplankton samples from the continuous plankton recorder. Marine bird foraging routes provided by Dr. Shannon Whelan, McGill University. This map was created using ArcGIS software (ArcMap 10.7.1; www.esri.com).
Figure 3
Figure 3
Response of lower trophic level species during the Pacific marine heatwave. (a) The common trend from the best model fit (lowest AICc; Table S2) identified from dynamic factor (DFA) analysis of 187 biological time series. (b) Phytoplankton indexed by satellite-derived chlorophyll biomass along the Seward and Kodiak oceanographic sampling lines and in situ measures of phytoplankton size composition from Seward Line sampling. (c) Microzooplankton seasonal biomass and fraction of ciliates from Seward Line sampling. (d) Zooplankton abundance for warm and cool water associated copepod species from continuous plankton recorder over oceanic and shelf waters and inside waters of Kachemak Bay and Prince William Sound. (e) Intertidal algal, sea star, and mussel abundance from four regions across the northern GOA. Points are annual values and solid line is DFA model fit to each time series. Grey shading represents the 2014–2016 northeast Pacific marine heatwave. Values are z-score standardizations so the y-axes are unitless.
Figure 4
Figure 4
Response of mid and upper trophic level species during the Pacific marine heatwave. (a) Abundance of juvenile capelin and sand lance from marine bird diets and of herring spawn, herring age-3 growth, and sand lance body condition in Prince William Sound (PWS). (b) Abundance of nesting murres on East Amatuli Island, kittiwake nests in Prince William Sound (“birds”), Steller sea lion pups and non-pups on rookeries and haul-out sites in eastern and western Gulf of Alaska (GOA), humpback and killer whale encounter rates, and killer whale numbers (“cetaceans”). (c) Marine bird abundance of primarily piscivores including common murres (black dots) from PWS and the Seward Line, murrelets (black triangles) from PWS, Kenai and Alaska Peninsulas, and pigeon guillemots (black squares) from Kenai and Alaska Peninsulas; primarily planktivores/omnivores including storm-petrels (red dots) and northern fulmars (red triangles) along the Seward Line; and intertidal invertebrate consumers—black oystercatchers—from Kenai and Alaska Peninsulas. (d) Adult female spawning biomass of Pacific cod, arrowtooth flounder, and sablefish, and larval southern rock sole, juvenile pollock, and growth of juvenile sablefish. (e) Commercial harvest in pounds landed and ex-vessel revenue for salmon and groundfish species from regions throughout our eastern and western study areas. Points are annual values and lines are models fit to data. Grey shading represents the 2014–2016 northeast Pacific marine heatwave. Values are z-score standardizations so the y-axes are unitless.
Figure 5
Figure 5
Community analyses of 187 biological time series in the Gulf of Alaska. (a) Cluster analysis showing significantly different groupings (solid lines). (b) Non-metric multi-dimensional scaling (nMDS) analysis of annual changes in Gulf of Alaska community prior to and during a multi-year marine heatwave (strongest from 2014–2016) in the Gulf of Alaska (2D stress 0.08). (c) Temporal patterns in nMDS axes, with dynamic factor analysis common trend overlay (red line) on axis 1.
Figure 6
Figure 6
Long-term trends (1993–2019; a, d through 2018) in (a) the abundance of warm water associated copepod species in the Gulf of Alaska, (b) herring and herring-dependent predators in Prince William Sound, (c) capelin and sand lance availability to marine birds and reproductive success of kittiwakes foraging from Middleton Island, and (d) ex-vessel revenue for sockeye salmon and combined for the three most valuable groundfish species. Grey shading represents the 2014–2016 northeast Pacific marine heatwave. Values are z-score standardizations so the y-axes are unitless.

References

    1. Overland J, Rodionov S, Minobe S, Bond N. North Pacific regime shifts: definitions, issues and recent transitions. Prog. Oceanogr. 2008;77:92–102. doi: 10.1016/j.pocean.2008.03.016. - DOI
    1. Chavez FP, Ryan J, Lluch-Cota SE, Niquen M. From anchovies to sardines and back: multidecadal change in the Pacific Ocean. Science. 2003;299:217–221. doi: 10.1126/science.1075880. - DOI - PubMed
    1. Beaugrand G, et al. Synchronous marine pelagic regime shifts in the Northern Hemisphere. Philos. Trans. R. Soc. B Biol. Sci. 2015;370:20130272. doi: 10.1098/rstb.2013.0272. - DOI
    1. Anderson PJ, Piatt JF. Community reorganization in the Gulf of Alaska following ocean climate regime shift. Mar. Ecol. Prog. Ser. 1999;189:117–123. doi: 10.3354/meps189117. - DOI
    1. Hare SR, Mantua NJ. Empirical evidence for North Pacific regime shifts in 1977 and 1989. Prog. Oceanogr. 2000;47:103–145. doi: 10.1016/S0079-6611(00)00033-1. - DOI

Publication types

LinkOut - more resources