. 2021 Mar 18;11(1):6402.
doi: 10.1038/s41598-021-85302-6.

Model-based projections for COVID-19 outbreak size and student-days lost to closure in Ontario childcare centres and primary schools

Affiliations

Model-based projections for COVID-19 outbreak size and student-days lost to closure in Ontario childcare centres and primary schools

Brendon Phillips et al. Sci Rep. .

Abstract

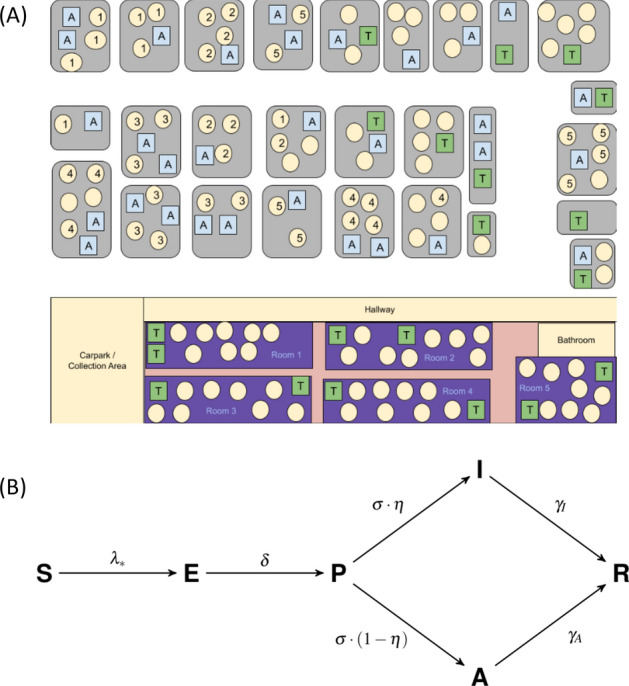
There is a pressing need for evidence-based scrutiny of plans to re-open childcare centres during the COVID-19 pandemic. Here we developed an agent-based model of SARS-CoV-2 transmission within a childcare centre and households. Scenarios varied the student-to-educator ratio (15:2, 8:2, 7:3), family clustering (siblings together versus random assignment) and time spent in class. We also evaluated a primary school setting (with student-educator ratios 30:1, 15:1 and 8:1), including cohorts that alternate weekly. In the childcare centre setting, grouping siblings significantly reduced outbreak size and student-days lost. We identify an intensification cascade specific to classroom outbreaks of respiratory viruses with presymptomatic infection. In both childcare and primary school settings, each doubling of class size from 8 to 15 to 30 more than doubled the outbreak size and student-days lost (increases by factors of 2-5, depending on the scenario. Proposals for childcare and primary school reopening could be enhanced for safety by switching to smaller class sizes and grouping siblings.


Conflict of interest statement

The authors declare no competing interests.

Figures

Figure 1
Figure 1
(A) Schematic representation of model population. ‘A’ represents adult, ‘T’ represents educator, and circles represent children. Grey rectangles represent houses and the school is represented at the bottom of the figure. Numbers exemplify possible assignments of children in households to classrooms. (B) Diagram showing the SEPAIR infection progression for each agent in the simulation (see Methods for definitions of parameters).
Figure 2
Figure 2
Diagrams showing the characteristics of COVID-19 spread in the childcare context. (a) Bar chart showing the effective reproductive number Re of the entire population (with error bars denoting one standard deviation), with a line plot showing the mean population size. For this childcare centre model, both low and high transmission scenarios are shown. (b) Diagram showing the proportion of trials without secondary spread (curve) in the childcare centre and the time taken to produce the first secondary infection (bar charts), both sorted by scenario.
Figure 3
Figure 3
Diagrams showing the outbreak length in the population and the number of exposures in the childcare centre setting. (a) Box plots depicting the distribution of simulation durations for each scenario. Taken together with the stopping criteria of the simulations and measures of aggregate, these describe the duration of the outbreak in a district hosting a childcare centre. Red dots denote the mean outbreak length (that is, mean simulation length). (b) The mean number of infections occurring among all childcare centre attendees in each location over time for each scenario. The height of each bar gives the ensemble mean and its standard deviation is represented by error bars.
Figure 4
Figure 4
Plots detailing the trends in outbreak progression through the simulation, and the number of student-says missed in the childcare centre setting, both per-student and total. (a) Time series detailing the trends in the mean proportions of current childcare centre attendees in each stage of disease progression. Larger class sizes result in more infections in total, and more infections occur in classrooms than any other locations. Shaded ribbons around each curve show one standard deviation of the averaged time series. Only trials showing secondary spread were included in the ensemble means shown. (b) Box plots demonstrating the mean number of face-to-face days missed per student over the course of the simulation due to class closure upon the detection of an outbreak in the childcare centre setting. Text boxes give the means, standard deviations and medians of the total number of days missed by all students in each simulations.
Figure 5
Figure 5
The effective reproduction number, location-specific numbers of exposure and numbers of missed student-days in various scenarios in the primary school setting. (a) Bar charts showing the mean number of infections occurring in households and each location of the primary primary school over the course of the simulation. (b) Bar charts showing the effective reproductive number Re in a population hosting a primary school, with error bars denoting one standard deviation. Both low and high transmission scenarios are shown. (c) Diagram showing the proportion of trials without secondary spread (line) and the mean time taken to produce the first secondary infection (bar chart), both sorted by scenario in primary school setting. (d) Box plots showing the number of missed student-days due to classroom closures in the primary school sparked by outbreak. Red text boxes: the first line gives the mean and standard deviation of the total number of student-days missed’ the second line gives the median number.

References

    1. Spelta A, Flori A, Pierri F, Bonaccorsi G, Pammolli F. After the lockdown: simulating mobility, public health and economic recovery scenarios. Sci. Rep. 2020;10:1–13. doi: 10.1038/s41598-020-73949-6. - DOI - PMC - PubMed
    1. Bonaccorsi G, et al. Economic and social consequences of human mobility restrictions under covid-19. Proc. Natl. Acad. Sci. 2020;117:15530–15535. doi: 10.1073/pnas.2007658117. - DOI - PMC - PubMed
    1. Cluver, L. et al. Parenting in a time of covid-19. The Lancet (2020). - PMC - PubMed
    1. Prime, H., Wade, M. & Browne, D. T. Risk and resilience in family well-being during the covid-19 pandemic. Am. Psychol.75(5), 631–643 (2020). - PubMed
    1. Stein-Zamir C, et al. A large covid-19 outbreak in a high school 10 days after schools’ reopening, Israel, May 2020. Eurosurveillance. 2020;25:2001352. doi: 10.2807/1560-7917.ES.2020.25.29.2001352. - DOI - PMC - PubMed