

Integrated multi-omics analysis of ovarian cancer using variational autoencoders
- PMID: 33737557
- PMCID: PMC7973750
- DOI: 10.1038/s41598-021-85285-4
Integrated multi-omics analysis of ovarian cancer using variational autoencoders
Erratum in
-
Author Correction: Integrated multi‑omics analysis of ovarian cancer using variational autoencoders.Sci Rep. 2021 Aug 11;11(1):16671. doi: 10.1038/s41598-021-95882-y. Sci Rep. 2021. PMID: 34381128 Free PMC article. No abstract available.
Abstract
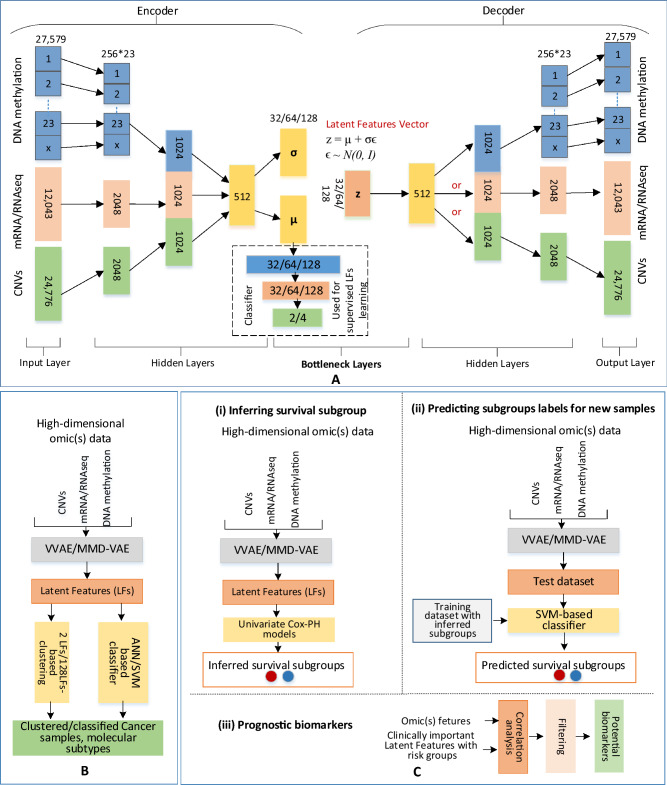
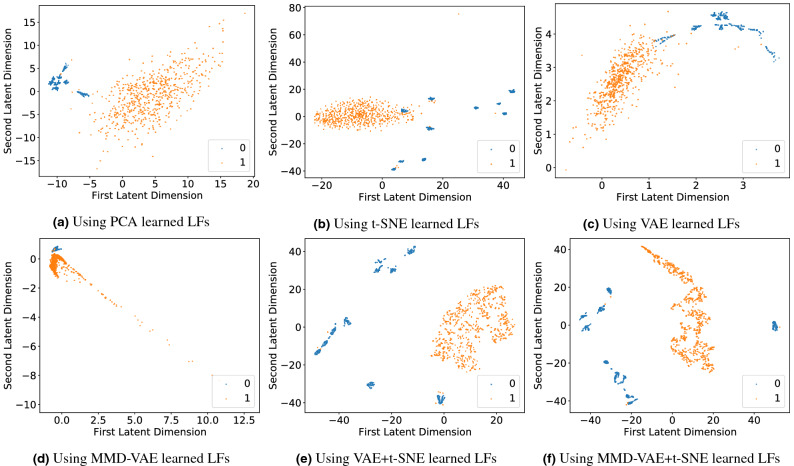
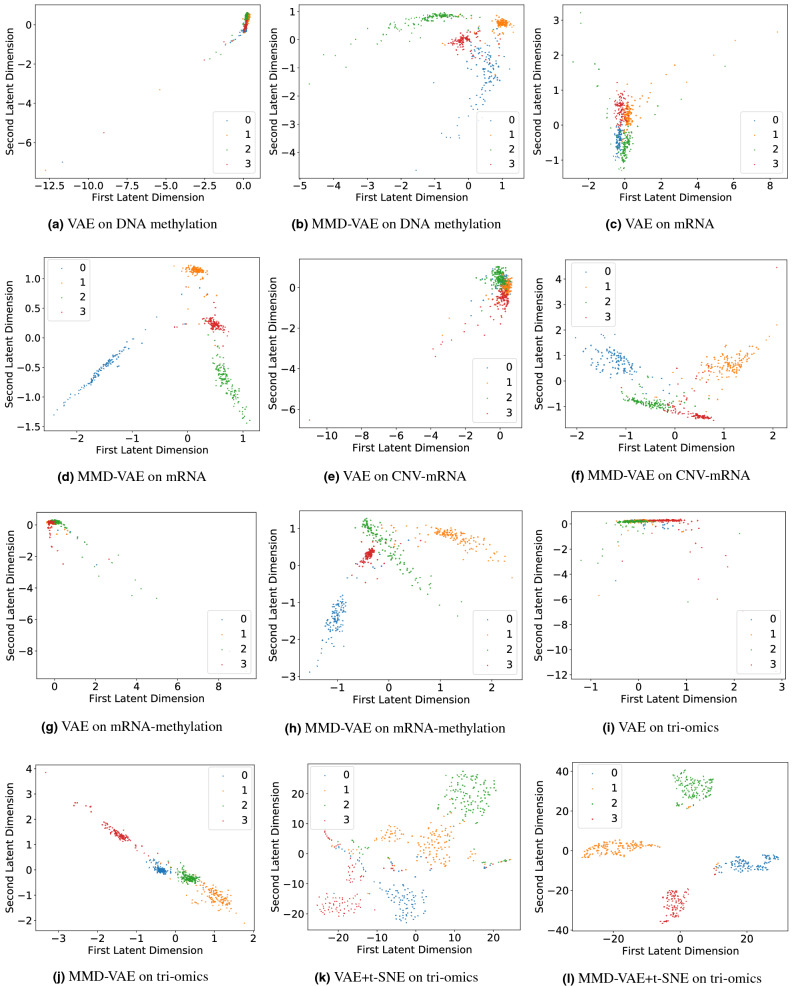
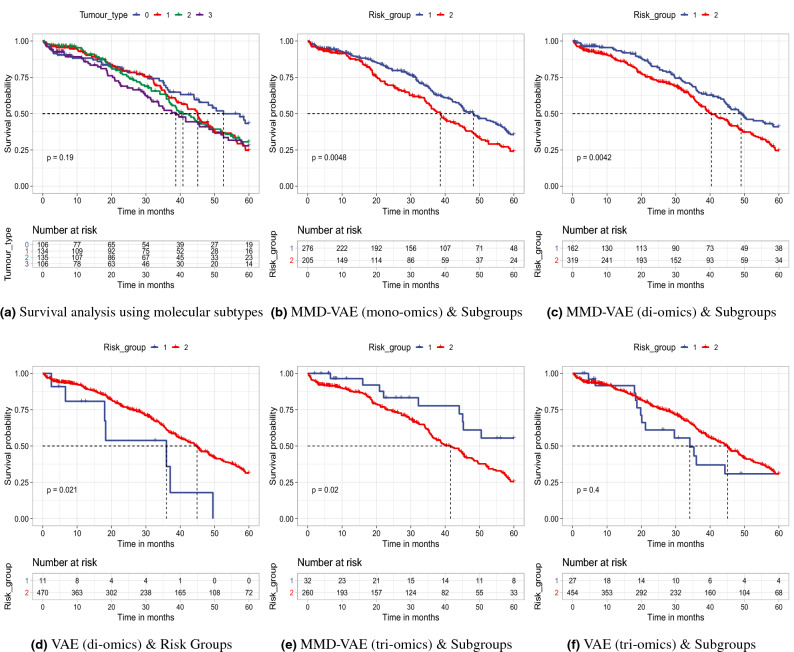
Cancer is a complex disease that deregulates cellular functions at various molecular levels (e.g., DNA, RNA, and proteins). Integrated multi-omics analysis of data from these levels is necessary to understand the aberrant cellular functions accountable for cancer and its development. In recent years, Deep Learning (DL) approaches have become a useful tool in integrated multi-omics analysis of cancer data. However, high dimensional multi-omics data are generally imbalanced with too many molecular features and relatively few patient samples. This imbalance makes a DL based integrated multi-omics analysis difficult. DL-based dimensionality reduction technique, including variational autoencoder (VAE), is a potential solution to balance high dimensional multi-omics data. However, there are few VAE-based integrated multi-omics analyses, and they are limited to pancancer. In this work, we did an integrated multi-omics analysis of ovarian cancer using the compressed features learned through VAE and an improved version of VAE, namely Maximum Mean Discrepancy VAE (MMD-VAE). First, we designed and developed a DL architecture for VAE and MMD-VAE. Then we used the architecture for mono-omics, integrated di-omics and tri-omics data analysis of ovarian cancer through cancer samples identification, molecular subtypes clustering and classification, and survival analysis. The results show that MMD-VAE and VAE-based compressed features can respectively classify the transcriptional subtypes of the TCGA datasets with an accuracy in the range of 93.2-95.5% and 87.1-95.7%. Also, survival analysis results show that VAE and MMD-VAE based compressed representation of omics data can be used in cancer prognosis. Based on the results, we can conclude that (i) VAE and MMD-VAE outperform existing dimensionality reduction techniques, (ii) integrated multi-omics analyses perform better or similar compared to their mono-omics counterparts, and (iii) MMD-VAE performs better than VAE in most omics dataset.
Conflict of interest statement
The authors declare no competing interests.
Figures
References
-
- UK. Cancer Research, Ovarian cancer statistics. https://www.cancerresearchuk.org/health-professional/cancer-statistics/s....
-
- Doubeni CA, Doubeni AR, Myers AE. Diagnosis and management of ovarian cancer. Am. Fam. Physician. 2016;93:937–944. - PubMed
Publication types
MeSH terms
LinkOut - more resources
Full Text Sources
Other Literature Sources
Medical
