

Anti-mucin 1 chimeric antigen receptor T cells for adoptive T cell therapy of cholangiocarcinoma
- PMID: 33737613
- PMCID: PMC7973425
- DOI: 10.1038/s41598-021-85747-9
Anti-mucin 1 chimeric antigen receptor T cells for adoptive T cell therapy of cholangiocarcinoma
Abstract
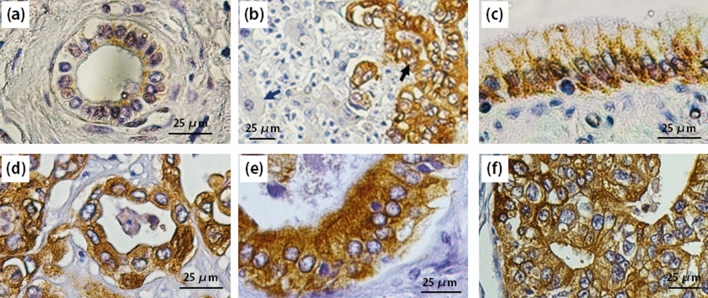
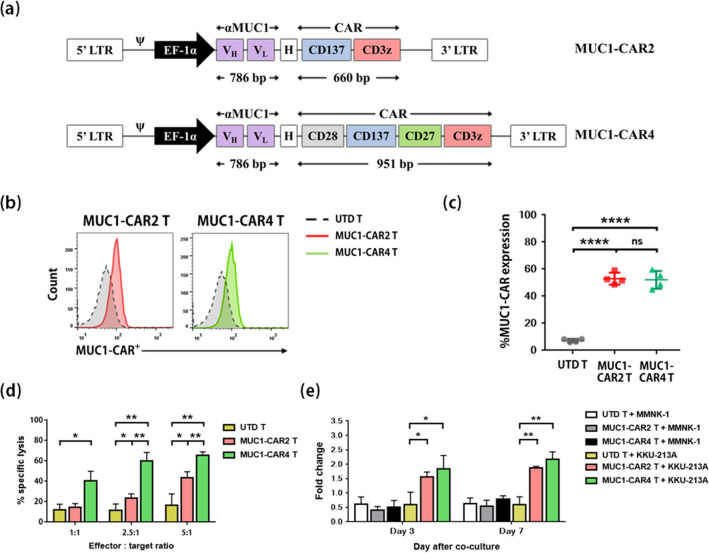
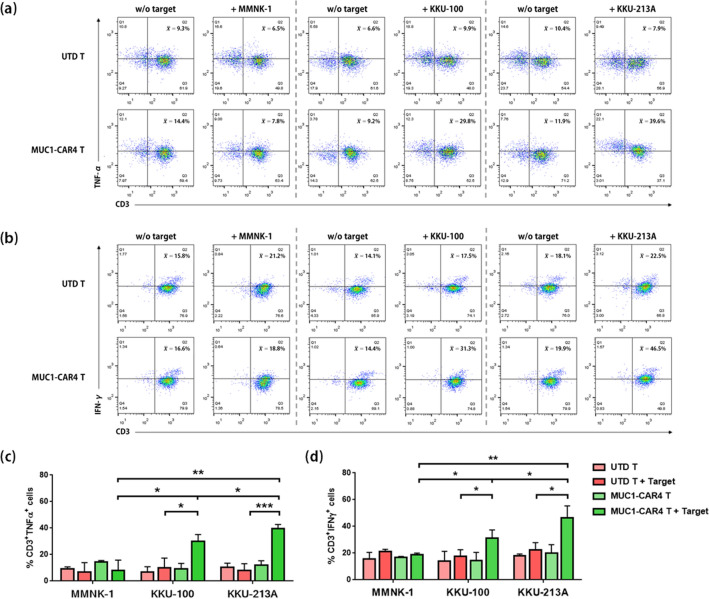
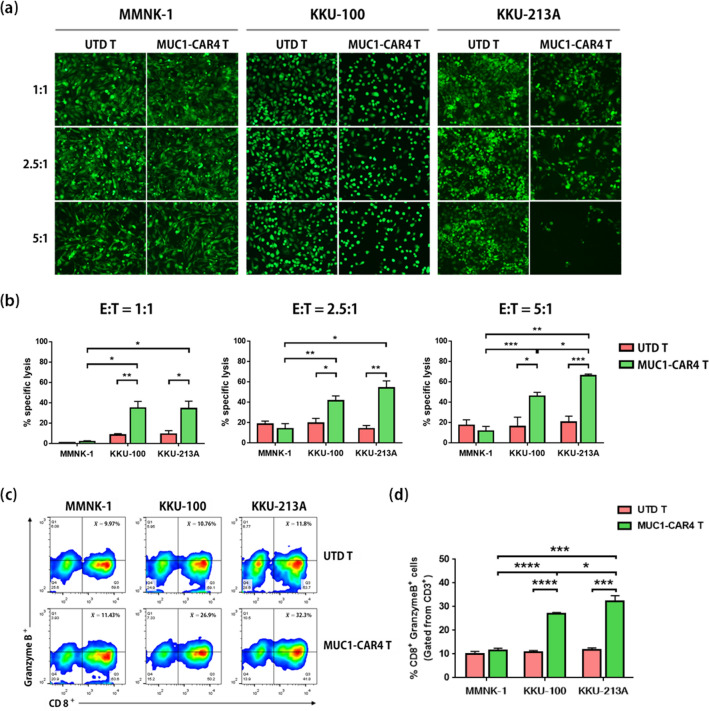
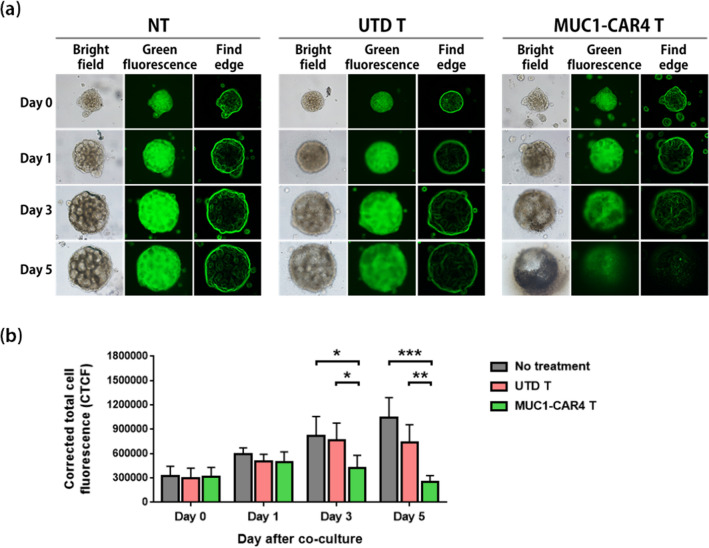
Current treatments for cholangiocarcinoma (CCA) are largely unsuccessful due to late diagnosis at advanced stage, leading to high mortality rate. Consequently, improved therapeutic approaches are urgently needed. Chimeric antigen receptor (CAR) T cell therapy is a newly potential therapy that can recognize specific surface antigen without major histocompatibility complex (MHC) restriction. Mucin 1 (MUC1) is an attractive candidate antigen as it is highly expressed and associated with poor prognosis and survival in CCA. We, therefore, set forth to create the fourth-generation CAR (CAR4) construct containing anti-MUC1-single-chain variable fragment (scFv) and three co-stimulatory domains (CD28, CD137, and CD27) linked to CD3ζ and evaluate anti-MUC1-CAR4 T cells in CCA models. Compared to untransduced T cells, anti-MUC1-CAR4 T cells produced increased levels of TNF-α, IFN-γ and granzyme B when exposed to MUC1-expressing KKU-100 and KKU-213A CCA cells (all p < 0.05). Anti-MUC1-CAR4 T cells demonstrated specific killing activity against KKU-100 (45.88 ± 7.45%, p < 0.05) and KKU-213A cells (66.03 ± 3.14%, p < 0.001) at an effector to target ratio of 5:1, but demonstrated negligible cytolytic activity against immortal cholangiocytes. Furthermore, the anti-MUC1-CAR4 T cells could effectively disrupt KKU-213A spheroids. These activities of anti-MUC1-CAR4 T cells supports the development of this approach as an adoptive T cell therapeutic strategy for CCA.
Conflict of interest statement
The authors declare no competing interests.
Figures


Similar articles
-
Anti-tumour effect of the fourth-generation chimeric antigen receptor T cells targeting CD133 against cholangiocarcinoma cells.Int Immunopharmacol. 2020 Dec;89(Pt B):107069. doi: 10.1016/j.intimp.2020.107069. Epub 2020 Nov 24. Int Immunopharmacol. 2020. PMID: 33242709
-
Cytotoxic activity of anti-mucin 1 chimeric antigen receptor T cells expressing PD-1-CD28 switch receptor against cholangiocarcinoma cells.Cytotherapy. 2023 Feb;25(2):148-161. doi: 10.1016/j.jcyt.2022.10.006. Epub 2022 Nov 14. Cytotherapy. 2023. PMID: 36396553
-
Enhanced cytotoxicity against cholangiocarcinoma by fifth-generation chimeric antigen receptor T cells targeting integrin αvβ6 and secreting anti-PD-L1 scFv.J Transl Med. 2025 Apr 16;23(1):451. doi: 10.1186/s12967-025-06453-y. J Transl Med. 2025. PMID: 40241132 Free PMC article.
-
Limitations in the Design of Chimeric Antigen Receptors for Cancer Therapy.Cells. 2019 May 17;8(5):472. doi: 10.3390/cells8050472. Cells. 2019. PMID: 31108883 Free PMC article. Review.
-
Development of CAR-T Therapies and Personalized Vaccines for the Treatment of Cholangiocarcinoma: Current Progress, Mechanisms of Action, and Challenges.Am J Pathol. 2025 Mar;195(3):453-469. doi: 10.1016/j.ajpath.2024.10.021. Epub 2024 Dec 14. Am J Pathol. 2025. PMID: 39675505 Review.
Cited by
-
Current and Emerging Therapeutic Targets for the Treatment of Cholangiocarcinoma: An Updated Review.Int J Mol Sci. 2023 Dec 30;25(1):543. doi: 10.3390/ijms25010543. Int J Mol Sci. 2023. PMID: 38203714 Free PMC article. Review.
-
Immunotherapy in Biliary Tract Cancers: Current Standard-of-Care and Emerging Strategies.Cancers (Basel). 2023 Jun 23;15(13):3312. doi: 10.3390/cancers15133312. Cancers (Basel). 2023. PMID: 37444422 Free PMC article. Review.
-
Tumor microenvironment and immunology of cholangiocarcinoma.Hepatoma Res. 2022;8:11. doi: 10.20517/2394-5079.2021.140. Epub 2022 Mar 10. Hepatoma Res. 2022. PMID: 39301518 Free PMC article.
-
Biomarkers and experimental models for cancer immunology investigation.MedComm (2020). 2023 Dec 2;4(6):e437. doi: 10.1002/mco2.437. eCollection 2023 Dec. MedComm (2020). 2023. PMID: 38045830 Free PMC article. Review.
-
Therapeutic significance of tumor microenvironment in cholangiocarcinoma: focus on tumor-infiltrating T lymphocytes.Explor Target Antitumor Ther. 2023;4(6):1310-1327. doi: 10.37349/etat.2023.00199. Epub 2023 Dec 28. Explor Target Antitumor Ther. 2023. PMID: 38213535 Free PMC article. Review.
References
-
- Morisaki T, Umebayashi M, Kiyota A, Koya N, Tanaka H, Onishi H, et al. Combining cetuximab with killer lymphocytes synergistically inhibits human cholangiocarcinoma cells in vitro. Anticancer Res. 2012;32:2249–2256. - PubMed
Publication types
MeSH terms
Substances
LinkOut - more resources
Full Text Sources
Other Literature Sources
Medical
Research Materials
Miscellaneous
