. 2021 Mar 18;11(1):6389.
doi: 10.1038/s41598-021-85818-x.

Folate transporter dynamics and therapy with classic and tumor-targeted antifolates

Affiliations

Folate transporter dynamics and therapy with classic and tumor-targeted antifolates

Carrie O'Connor et al. Sci Rep. .

Abstract

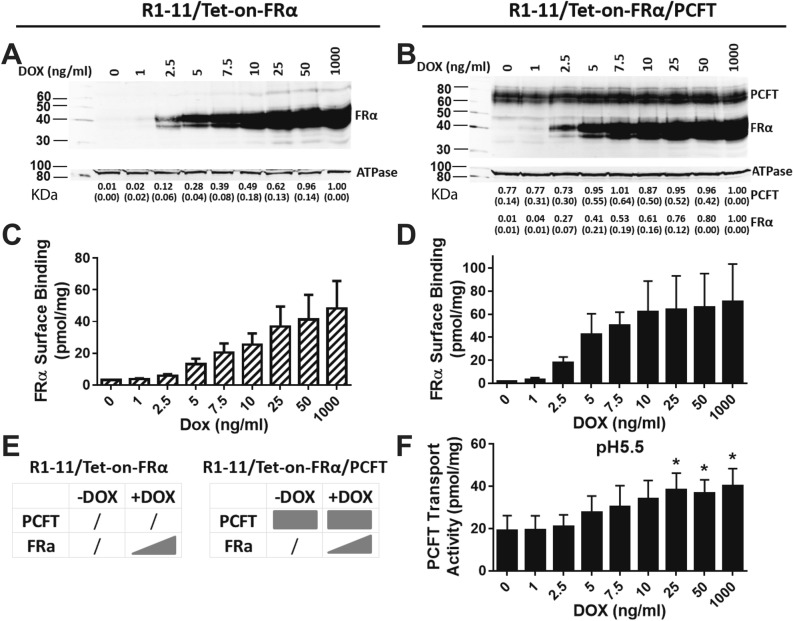
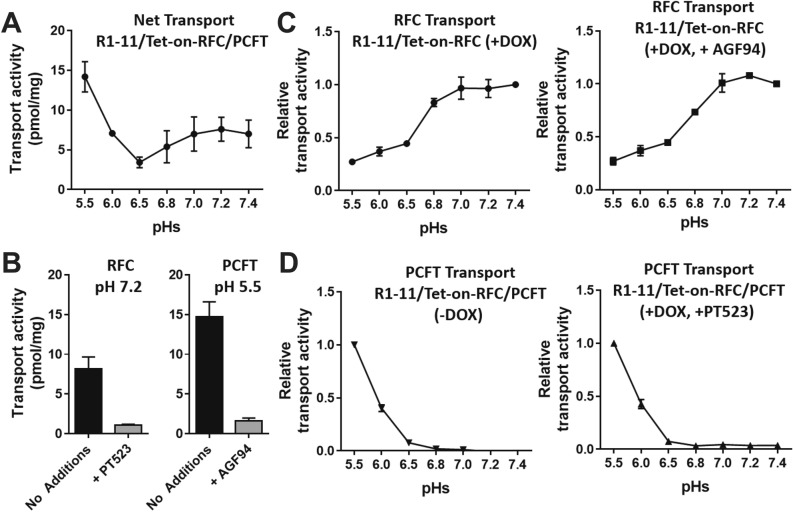
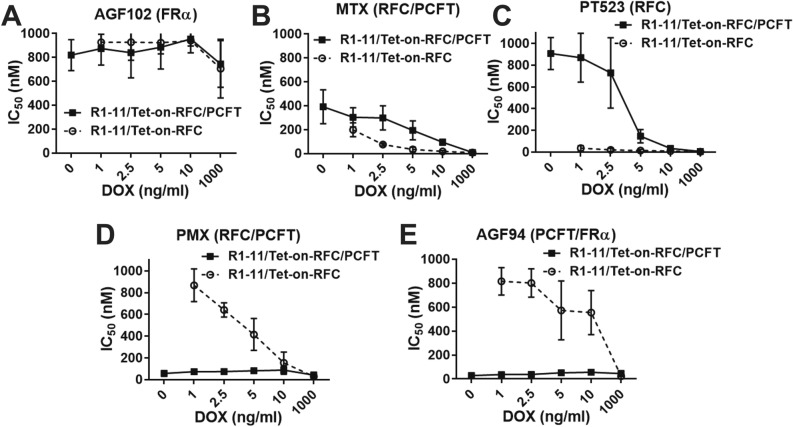
There are three major folate uptake systems in human tissues and tumors, including the reduced folate carrier (RFC), folate receptors (FRs) and proton-coupled folate transporter (PCFT). We studied the functional interrelationships among these systems for the novel tumor-targeted antifolates AGF94 (transported by PCFT and FRs but not RFC) and AGF102 (selective for FRs) versus the classic antifolates pemetrexed, methotrexate and PT523 (variously transported by FRs, PCFT and RFC). We engineered HeLa cell models to express FRα or RFC under control of a tetracycline-inducible promoter with or without constitutive PCFT. We showed that cellular accumulations of extracellular folates were determined by the type and levels of the major folate transporters, with PCFT and RFC prevailing over FRα, depending on expression levels and pH. Based on patterns of cell proliferation in the presence of the inhibitors, we established transport redundancy for RFC and PCFT in pemetrexed uptake, and for PCFT and FRα in AGF94 uptake; uptake by PCFT predominated for pemetrexed and FRα for AGF94. For methotrexate and PT523, uptake by RFC predominated even in the presence of PCFT or FRα. For both classic (methotrexate, PT523) and FRα-targeted (AGF102) antifolates, anti-proliferative activities were antagonized by PCFT, likely due to its robust activity in mediating folate accumulation. Collectively, our findings describe a previously unrecognized interplay among the major folate transport systems that depends on transporter levels and extracellular pH, and that determines their contributions to the uptake and anti-tumor efficacies of targeted and untargeted antifolates.


Conflict of interest statement

The authors declare no competing interests.

Figures

Figure 1
Figure 1
(A) Structures of MTX, PMX, PT523, AGF94, and AGF102. (B) A cartoon depicting three folate transport systems, with their transport substrates noted.
Figure 2
Figure 2
Characterization of R1-11/Tet-on-FRα single and R1-11/Tet-on-FRα/PCFT double transfectant models. R1-11/Tet-on-FRα or R1-11/Tet-on-FRα/PCFT cells were plated in 60-mm dishes in complete folate-free (FF) RPMI 1640 medium containing 10% fetal bovine serum (FBS) for transport/binding and protein expression assays. Twenty-four hours later, a range of DOX (0, 1, 2.5, 5, 7.5, 10, 25, 50, and 1000 ng/ml) was added. After 48 h, FRα and/or PCFT protein levels for the R1-11/Tet-on-FRα single (A) or R1-11/Tet-on-FRα/PCFT double (B) models were measured in crude plasma membranes by SDS-PAGE and Western blotting with a HA monoclonal antibody (upper panels) followed by stripping and re-probing with Na+/K+ ATPase monoclonal antibody (lower panels) as a loading control. Blots were cropped as needed. The full blots are included in the Supplement (Figs. S2–S5). The molecular mass markers for SDS-PAGE are noted. Densitometry was performed using Odyssey software, and FRα or PCFT protein levels were normalized to those for Na+/K+ ATPase and expressed relative to the level at the maximum concentration of DOX. Densitometry results are summarized below the individual lanes and are presented as mean values plus/minus standard deviations (SDs; in parenthesis) from at least 3 experiments. FRα levels (C,D) were also determined with [3H]FA at 0 °C for 15 min; PCFT uptake (F) was measured with [3H]MTX at pH 5.5 at 37 °C for 2 min. Results are presented as mean values plus/minus SDs from at least 3 experiments. The statistical significance of PCFT transport activities between samples with and without DOX was analyzed by an unpaired t test. An asterisk indicates a statistically significant difference between the mean transport values (p < 0.05). A schematic is shown depicting the patterns of expression of FRα in R1-11/Tet-on-FRα cells, and of FRα and/or PCFT in R1-11/Tet-on-FRα/PCFT cells, in the presence or absence of DOX (E).
Figure 3
Figure 3
Characterization of R1-11/Tet-on-RFC single and R1-11/Tet-on-RFC/PCFT double transfectant models. R1-11/Tet-on-RFC or R1-11/Tet-on-RFC/PCFT cells were plated in 60-mm dishes in complete FF RPMI 1640 medium containing 10% FBS for transport and protein expression assays. Twenty-four hours later, a range of DOX (0, 1, 2.5, 5, 7.5, 10, 25, 50, and 1000 ng/ml) was added. After 48 h, RFC and PCFT protein levels for the R1-11/Tet-on-RFC (A) and R1-11/Tet-on-RFC/PCFT models (after deglycosylation; “dgRFC” and “dgPCFT” designate the deglycosylated forms of these proteins) (B) were measured in crude plasma membranes by SDS-PAGE and Western blotting with HA monoclonal antibody (upper panels), followed by stripping and re-probing with Na+/K+ ATPase monoclonal antibody (lower panels) as a loading control. Blots were cropped as needed. The full blots are included in the Supplement (Figs. S6 to S9). The molecular mass markers for SDS-PAGE are noted. Densitometry was performed using the Odyssey software, and RFC or PCFT protein levels were normalized to Na+/K+ ATPase and expressed relative to the level at the maximum concentration of DOX. Densitometry results are noted below the individual lanes and are presented as mean values plus/minus SDs from at least 3 experiments. RFC (C,D) and PCFT (F) transport activities were measured with [3H]MTX at 37 °C for 2 min, at pH 7.2 and pH 5.5, respectively. Results are presented as mean values plus/minus SDs from at least 3 experiments. Statistical significance of PCFT transport activities between samples with and without DOX was analyzed by the unpaired t test. An asterisk indicates a statistically significant difference between the mean values of PCFT transport (p < 0.05). A schematic is shown depicting the expression of RFC in R1-11/Tet-on-RFC cells, and RFC and/or PCFT in R1-11/Tet-on-RFC/PCFT cells, in the presence or absence of DOX (E).
Figure 4
Figure 4
Transport pH profiling of R1-11/Tet-on-RFC single and R1-11/Tet-on-RFC/PCFT double models. R1-11/Tet-on-RFC or R1-11/Tet-on-RFC/PCFT cells were plated in 60-mm dishes in complete FF RPMI 1640 medium containing 10% FBS. Twenty-four hours later, DOX was added at 10 ng/ml. After 48 h, transport was measured over 2 min at 37 °C with [3H]MTX (0.5 µM) in MBS (20 mM MES, 140 mM NaCl, 5 mM KCl, 2 mM MgCl2, and 5 mM glucose, for pH 5.5, 6.0 and 6.5) and HBS (20 mM Hepes, 140 mM NaCl, 5 mM KCl, 2 mM MgCl2, and 5 mM glucose, for pH 6.8, 7.0, 7.2 and 7.4). The dishes were washed (3×) with ice-cold PBS. The cells were solubilized in 0.5 N NaOH, and the radioactive contents and protein concentrations of the alkaline cell homogenates were determined. Intracellular radioactivity is calculated in units of pmol [3H]MTX per mg of cell protein and results are presented as mean values plus/minus SDs (Panel A, B) or relative values (relative to the maximum activity for each transporter) as mean plus/minus SDs (Panel C, D) from at least 3 experiments. (A) Net transport activities of R1-11/Tet-on-RFC/PCFT cells (in the presence of DOX) are shown over a range of pHs. (B) The results depict transport activities of R1-11/Tet-on-RFC/PCFT cells at pH 7.2 (optimum for RFC transport) in the absence or presence of 10 μM PT523 (left panel), and at pH 5.5 (optimum for PCFT transport) in the absence or presence of 10 μM AGF94 (right panel). (C) RFC transport activities of R1-11/Tet-on-RFC cells (with DOX; left panel) and of R1-11/Tet-on-RFC/PCFT cells (with DOX and in the presence of PCFT specific inhibitor AGF94 of 10 μM; right panel) are shown over a range of pHs. (D) PCFT transport activities of R1-11/Tet-on-RFC/PCFT cells (without DOX; left panel) and of R1-11/Tet-on-RFC/PCFT cells (with DOX and in the presence of RFC specific inhibitor PT523 at 10 μM; right panel) are shown over a range of pHs.
Figure 5
Figure 5
3H-LCV accumulation by R1-11/Tet-on-FRα, R1-11/Tet-on-FRα/PCFT, R1-11/Tet-on-RFC and R1-11/Tet-on-RFC/PCFT cell line models. R1-11/Tet-on-FRα, R1-11/Tet-on-FRα/PCFT, R1-11/Tet-on-RFC or R1-11/Tet-on-RFC/PCFT cells were plated in 60-mm dishes in complete FF RPMI 1640 medium containing 10% FBS for 24–48 h. The media was then replaced with complete FF RPMI 1640 medium (pH 6.5, 6.8 or 7.2) containing 10% dialyzed FBS, 25 nM [3H]LCV and a range of DOX (0, 1, 2.5, 5, 10, and 1000 ng/ml). Forty-eight hours later, the dishes were washed (2×) with acid buffer (10 mM sodium acetate, 150 mM NaCl, pH 3.5; for R1-11/Tet-on-FRα or R1-11/Tet-on-FRα/PCFT cells) and 3× with ice-cold PBS. The R1-11/Tet-on-RFC and R1-11/Tet-on-RFC/PCFT cells were washed 3× with ice-cold PBS only. The washed cells were solubilized in 0.5 N NaOH and radioactive contents and protein concentrations of the alkaline cell homogenates were determined. Intracellular radioactivity was calculated in units of pmol [3H]LCV per mg of cell protein. The [3H]LCV uptake results are presented as mean values plus/minus SDs from at least 3 experiments for incubations at pH 6.5 (A,D), pH 6.8 (B,E) and pH 7.2 (C,F). Statistical significance of [3H]LCV uptake values between the single and double transfectants at each DOX dosage was analyzed by an unpaired t test. An asterisk indicates a statistically significant difference between the mean values of [3H]LCV accumulation by single and double transfected cells at each DOX concentration (*p < 0.05; **p < 0.005; ***p < 0.0005).
Figure 6
Figure 6
Impact of RFC/PCFT redundancy on drug sensitivity. R1-11/Tet-on-RFC or R1-11/Tet-on-RFC/PCFT cells were plated in 96-well culture plates (4000 cells/well; 200 μl/well) with complete FF RPMI 1640 including 10% dialyzed FBS supplemented with 25 nM LCV. Drugs with different transport specificities were added, with concentrations from 1 to 1000 nM for AGF102 (A), MTX (B), PT523 (C), PMX (D), and AGF94 (E). Cells were treated over a range of DOX concentrations (0, 1, 2.5, 5, 10 and 1000 ng/ml) and incubated from 96 to120 h (depending on the growth of the cell models) at 37 °C in a CO2 incubator. Cell viabilities were measured with a fluorescence-based viability assay (CellTiter-Blue; Promega) and a fluorescence plate reader (emission at 590 nm, excitation at 560 nm) for calculating the drug concentrations that inhibit growth by 50% (IC50). Results are shown as mean IC50 values + /− SDs from 4 to 15 separate experiments.

Similar articles

Cited by

References

    1. Kim YI. Folate and DNA methylation: A mechanistic link between folate deficiency and colorectal cancer? Cancer Epidemiol. Biomark. Prev. 2004;13:511–519. - PubMed
    1. Davey Smith G, Ebrahim S. Folate supplementation and cardiovascular disease. Lancet. 2005;366:1679–1681. doi: 10.1016/s0140-6736(05)67676-3. - DOI - PubMed
    1. Bottiglieri T, Reynolds E. In: Folate in Health and Disease. Bailey LB, editor. CRC Press; 2010. pp. 355–380.
    1. Chen, J., Xu, Xinran, Liu, A., Ulrich, C.M. In Folate and Cancer: Epidemiologic Perspective. 205–233 (CRC Press, 2010).
    1. Walis D, Ballard JL, Shaw GM, Lmmer EJ, Finnell RH. In: Folate in Health and Disease. Bailey LB, editor. CRC Press; 2010. pp. 155–178.

Publication types

MeSH terms