Observational Study
. 2021 Mar 18;11(1):6231.
doi: 10.1038/s41598-021-85670-z.

Administration of β-lactam antibiotics and delivery method correlate with intestinal abundances of Bifidobacteria and Bacteroides in early infancy, in Japan

Affiliations
Observational Study

Administration of β-lactam antibiotics and delivery method correlate with intestinal abundances of Bifidobacteria and Bacteroides in early infancy, in Japan

Naruaki Imoto et al. Sci Rep. .

Abstract

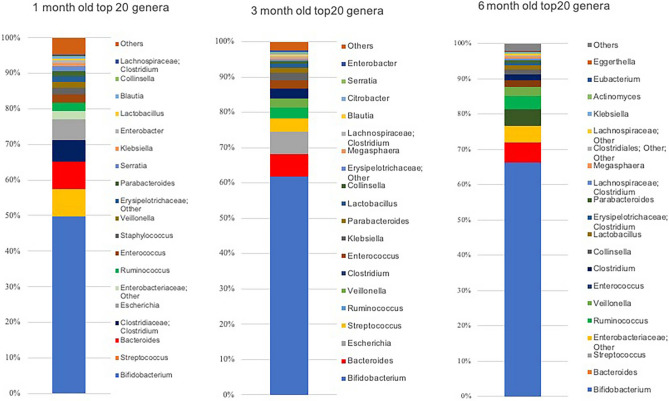
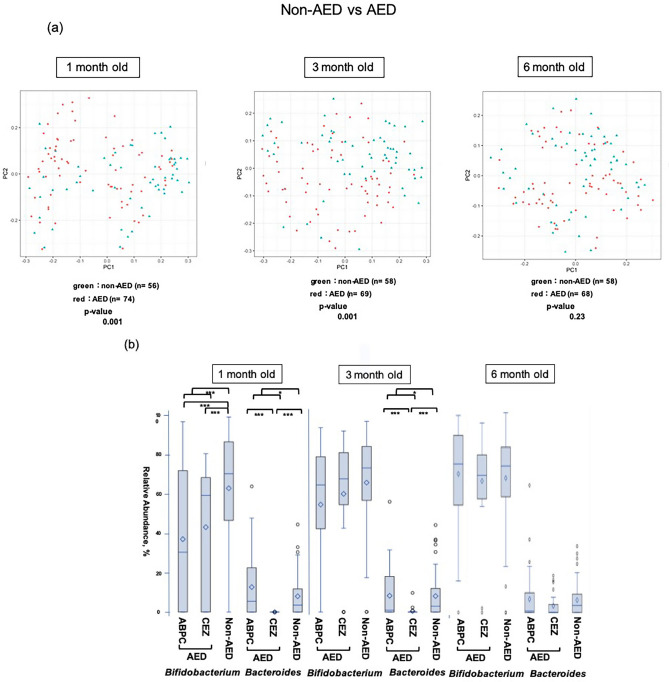
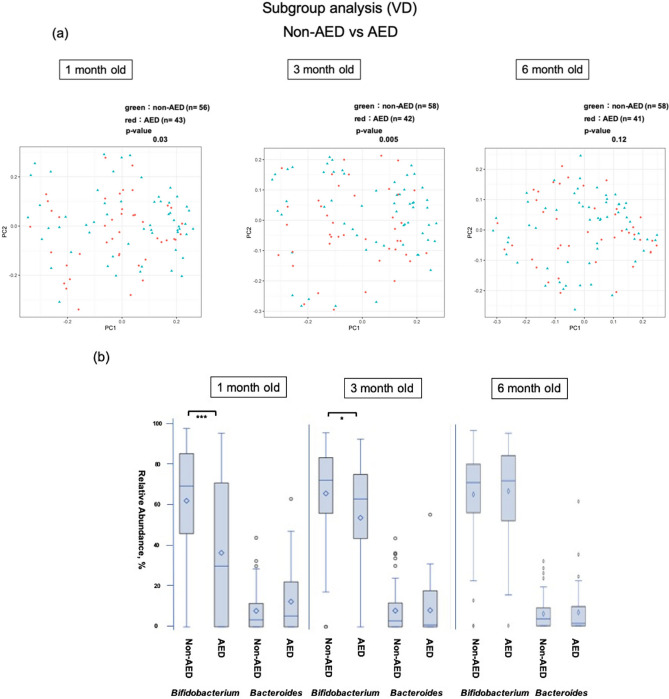
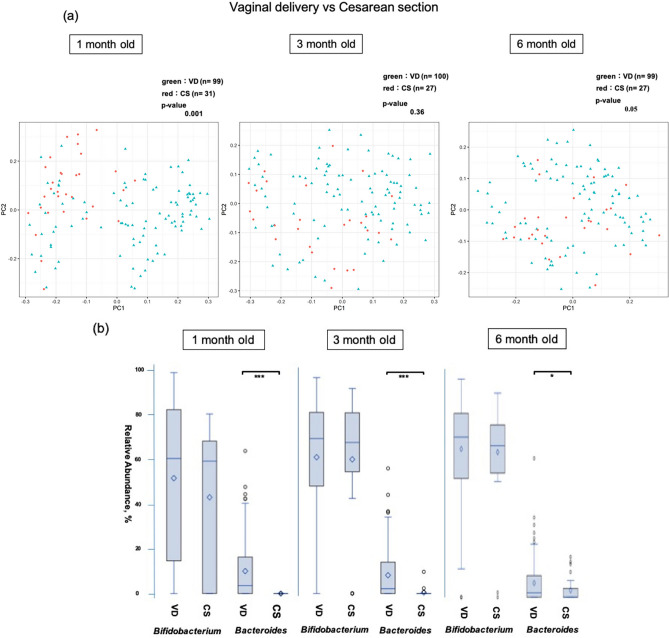
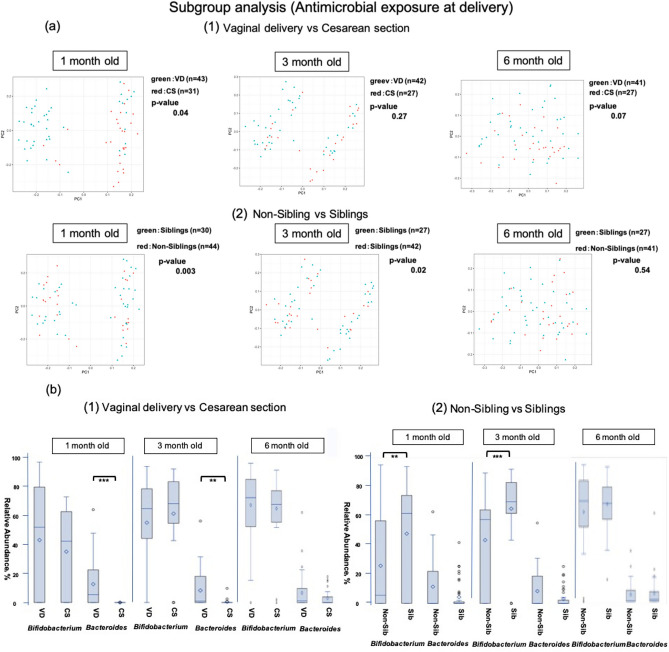
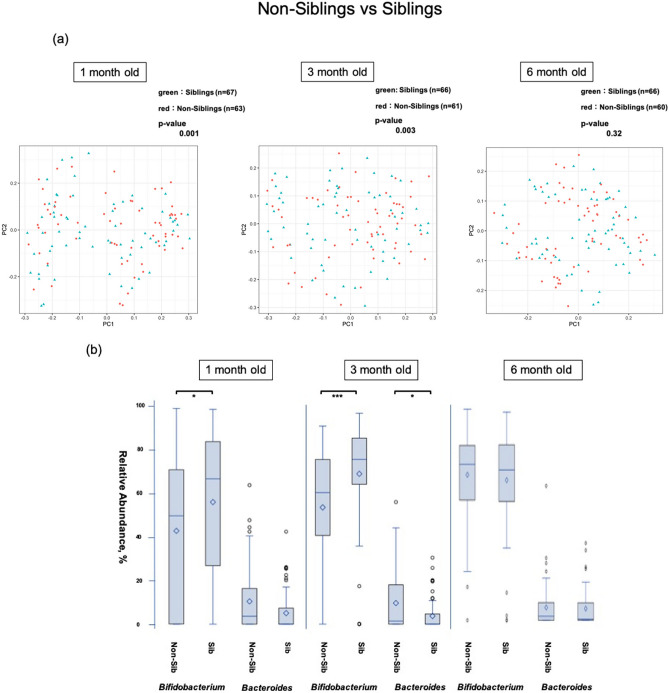
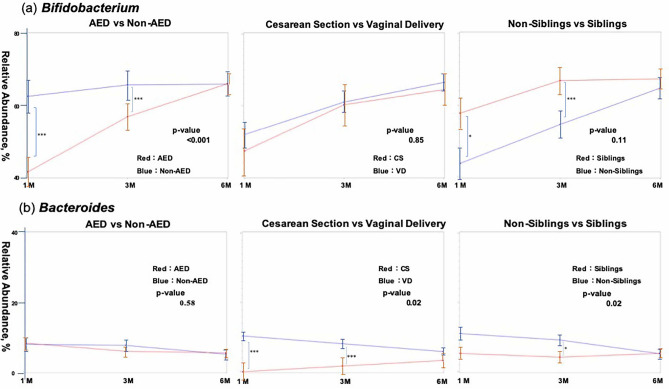
The intestinal microbiome changes dynamically in early infancy. Colonisation by Bifidobacterium and Bacteroides and development of intestinal immunity is interconnected. We performed a prospective observational cohort study to determine the influence of antibiotics taken by the mother immediately before delivery on the intestinal microbiome of 130 healthy Japanese infants. Faecal samples (383) were collected at 1, 3, and 6 months and analysed using next-generation sequencing. Cefazolin was administered before caesarean sections, whereas ampicillin was administered in cases with premature rupture of the membranes and in Group B Streptococcus-positive cases. Bifidobacterium and Bacteroides were dominant (60-70% mean combined occupancy) at all ages. A low abundance of Bifidobacterium was observed in infants exposed to antibiotics at delivery and at 1 and 3 months, with no difference between delivery methods. A lower abundance of Bacteroides was observed after caesarean section than vaginal delivery, irrespective of antibiotic exposure. Additionally, occupancy by Bifidobacterium at 1 and 3 months and by Bacteroides at 3 months differed between infants with and without siblings. All these differences disappeared at 6 months. Infants exposed to intrapartum antibiotics displayed altered Bifidobacterium abundance, whereas abundance of Bacteroides was largely associated with the delivery method. Existence of siblings also significantly influenced the microbiota composition of infants.


Conflict of interest statement

The authors declare no competing interests.

Figures

Figure 1
Figure 1
Mean occupancies of the top 20 bacterial genera constituting the intestinal microbiome at 1, 3, and 6 months after birth. At each age, the occupancies of the top 20 genera (others are indicated as ‘Others’) are shown as 100% stacked columns. The genera are shown in the order of higher occupancy from the bottom to the top. This figure was generated using Microsoft Excel for Mac 2016 (https://www.microsoft.com).
Figure 2
Figure 2
Comparison of the β diversity and occupancy of the top two bacteria species in the AED and non-AED groups. (a) Comparison of β diversity of the intestinal microbiome between infants at each age with (AED) and without (non-AED) antibiotic exposure at delivery. (b) Bifidobacteria and Bacteroides occupancies in infants in the AED and non-AED groups, shown as box-whisker plots at each age. The AED group was also divided into ampicillin-treated (ABPC) and cefazolin-treated (CEZ) groups. Comparison of occupancy among these groups and the non-AED group was performed using Bonferroni multiple comparison test. Comparison between the AED and non-AED groups was performed using Mann–Whitney U-test. The ABPC, CEZ, and non-AED groups included 43, 31, and 56 infants at 1 month (130 in total); 42, 27, and 58 infants at 3 months (127 in total); and 40, 28, and 58 infants at 6 months (126 in total). The significance level was set at 5%. *p < 0.05, ***p < 0.001 This figure was generated using SAS version 9.4 (https://www.sas.com).
Figure 3
Figure 3
Comparison of the β diversity and occupancy of the top two bacteria species in the AED and non-AED groups of the vaginal delivery group. (a) Comparison of β diversity of the intestinal microbiome between infants at each age with (AED) and without (non-AED) antibiotic exposure at vaginal delivery. (b) Comparison of Bifidobacteria and Bacteroides occupancies in infants in the AED and non-AED groups with vaginal delivery, shown as box-whisker plots at each age. The AED and non-AED groups included 43 and 56 infants at 1 month (99 in total), 42 and 58 infants at 3 months (100 in total), and 41 and 58 infants at 6 months (99 in total). The significance level was set at 5%. *p < 0.05, ***p < 0.001 using Mann–Whitney U-test. This figure was generated using SAS version 9.4 (https://www.sas.com).
Figure 4
Figure 4
Comparison of the β diversity and occupancy of the top two bacteria species in the vaginal delivery (VD) and caesarean section (CS) groups. (a) Comparison of β diversity of the intestinal microbiome at each age between vaginal delivery (VD) and caesarean section (CS) (b) Bifidobacteria and Bacteroides occupancies between delivery methods, shown as box-whisker plots at each age. The VD and CS groups included 99 and 31 infants at 1 month (130 in total), 100 and 27 infants at 3 months (127 in total), and 99 and 27 infants at 6 months (126 in total). The significance level was set at 5%. *p < 0.05, ***p < 0.001 using Mann–Whitney U-test. This figure was generated using SAS version 9.4 (https://www.sas.com).
Figure 5
Figure 5
Comparison of the β diversity and occupancy of the top two bacteria species in the vaginal delivery (VD) and caesarean section (CS) groups of the AED group. (a) Comparison of β diversity of the intestinal microbiome at each age between delivery methods (1) and with and without siblings (2) in the AED group. VD: vaginal delivery, CS: caesarean section, Non-Siblings: infants without a sibling, Siblings: infants with older siblings. (b) Bifidobacteria and Bacteroides occupancies in the AED group compared between delivery methods (1) and presence of absence of siblings (2), shown as box-whisker plots at each age. (1) The vaginal delivery (VD) and caesarean section (CS) groups included 43 and 31 infants at 1 month (74 in total); 42 and 27 infants at 3 months (69 in total), and 42 and 27 infants at 6 months (68 in total). (2) The Sib and non-Sib groups included 44 and 30 infants at 1 month (74 in total), 42 and 27 infants at 3 months (69 in total), and 41 and 27 infants at 6 months (68 in total). The significance level was set at 5%. **p < 0.01, ***p < 0.001 using Mann–Whitney U-test. This figure was generated using SAS version 9.4 (https://www.sas.com).
Figure 6
Figure 6
Comparison of the β diversity and occupancy of the top two bacteria species between the infants with siblings and those without siblings (a) Comparison of β diversity of the intestinal microbiome between infants with and without siblings. (b) Bifidobacteria and Bacteroides occupancies between infants with siblings (Sib) and without siblings (Non-Sib), shown as box-whisker plots at each age. The Sib and non-Sib groups included 67 and 63 infants at 1 month (130 in total), 61 and 66 infants at 3 months (127 in total), and 66 and 60 infants at 6 months (126 in total). The significance level was set at 5%. *p < 0.05, ***p < 0.001 using Mann–Whitney U-test. This figure was generated using SAS version 9.4 (https://www.sas.com).
Figure 7
Figure 7
Time-course changes in bifidobacterial (a) and Bacteroides (b) occupancies (from 1 to 6 months after birth) based on AED or non-AED, delivery method, and the presence or absence of siblings, using a linear mixed-effect model. The analysis set at 1 month included 130 infants. Dropouts at 3 and 6 months were handled as missing values. The standard deviation by age in months is shown in bar form in each figure. Significant differences in occupancies between the two groups at each time point are also indicated in each comparison. The significance level was set at 5%. *p < 0.05, ***p < 0.001 using the Mann–Whitney U-test. This figure was generated using SAS version 9.4 (https://www.sas.com).

Similar articles

Cited by

References

    1. Kundu P, Blacher E, Elinav E, Pettersson S. Our gut microbiome: the evolving inner self. Cell. 2017;171:1481–1493. doi: 10.1016/j.cell.2017.11.024. - DOI - PubMed
    1. Sender R, Fuchs S, Milo R. Revised estimates for the number of human and bacteria cells in the body. PLoS Biol. 2016;14:e1002533. doi: 10.1371/journal.pbio.1002533. - DOI - PMC - PubMed
    1. Turroni F, et al. Diversity of bifidobacteria within the infant gut microbiota. PLoS ONE. 2012;7:e36957. doi: 10.1371/journal.pone.0036957. - DOI - PMC - PubMed
    1. Kumbhare SV, et al. A cross-sectional comparative study of gut bacterial community of Indian and Finnish children. Sci. Rep. 2017;7:10555. doi: 10.1038/s41598-017-11215-y. - DOI - PMC - PubMed
    1. Kurokawa K, et al. Comparative metagenomics revealed commonly enriched gene sets in human gut microbiomes. DNA Res. 2007;14:169–181. doi: 10.1093/dnares/dsm018. - DOI - PMC - PubMed

Publication types

MeSH terms