

Relationships between oxygen changes in the brain and periphery following physiological activation and the actions of heroin and cocaine
- PMID: 33737657
- PMCID: PMC7973713
- DOI: 10.1038/s41598-021-85798-y
Relationships between oxygen changes in the brain and periphery following physiological activation and the actions of heroin and cocaine
Abstract
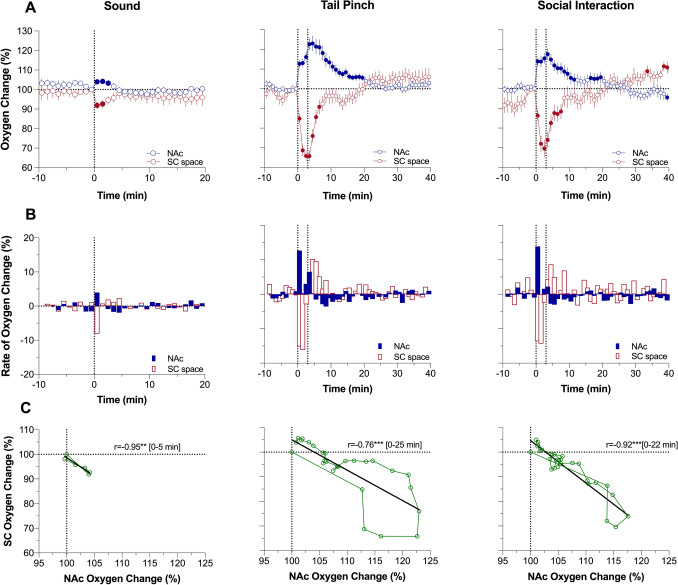
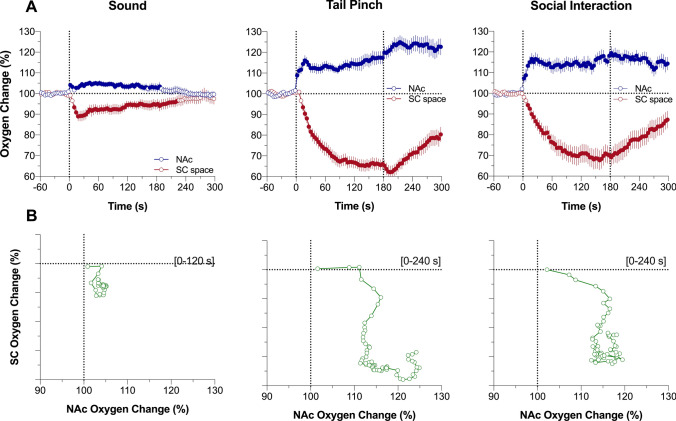
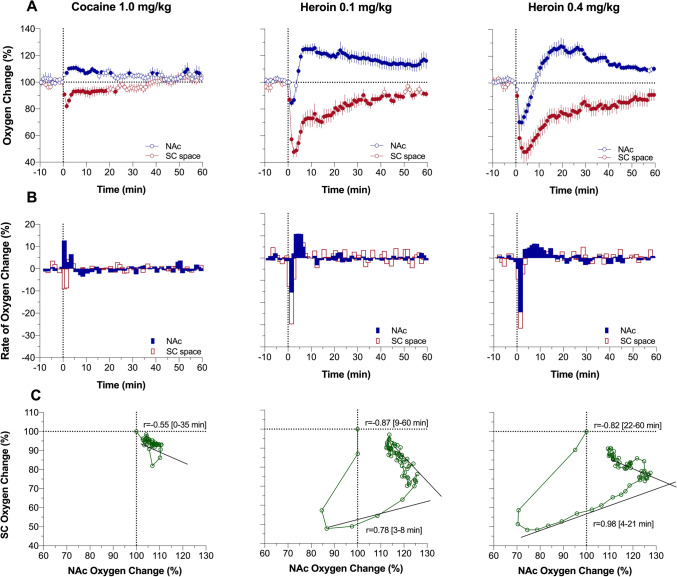
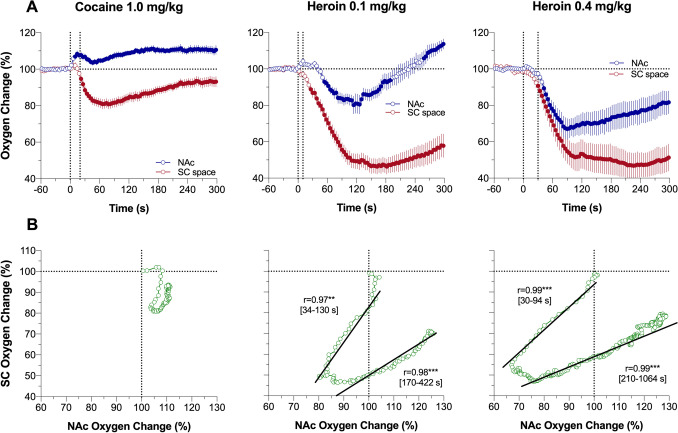
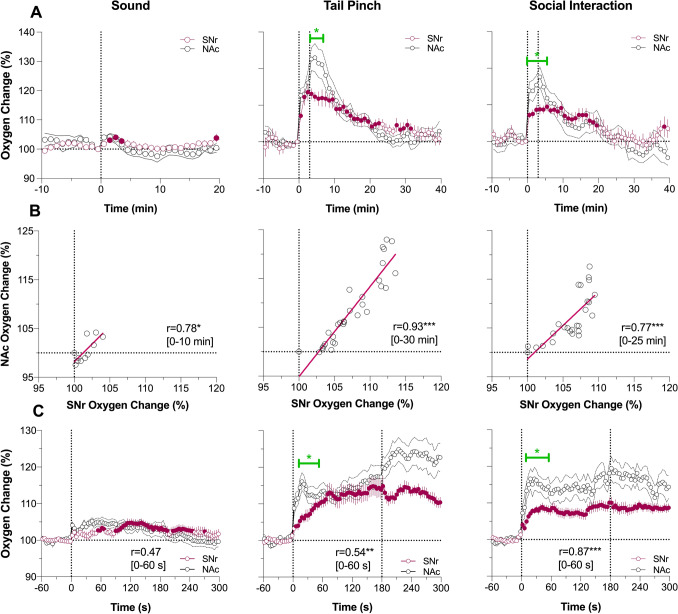
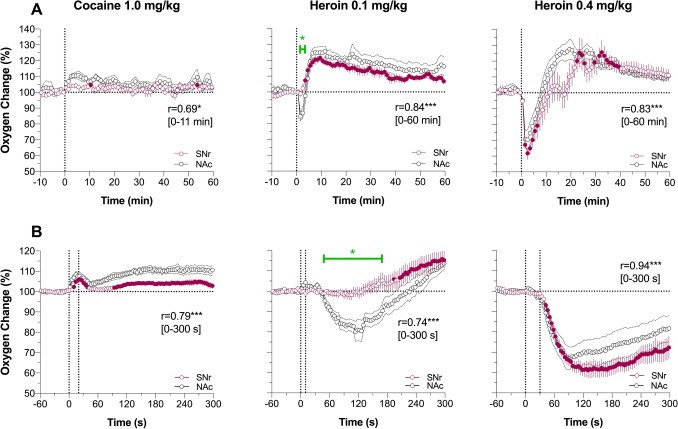
Using two-sensor electrochemical recordings in freely moving rats, we examined the relationship between physiological and drug-induced oxygen fluctuations in the brain and periphery. Animals chronically implanted with oxygen sensors in the nucleus accumbens (NAc) and subcutaneous (SC) space were subjected to several mildly arousing stimuli (sound, tail-pinch and social interaction) and intravenous injections of cocaine and heroin. Arousing stimuli induced rapid increases in NAc oxygen levels followed by and correlated with oxygen decreases in the SC space. Therefore, cerebral vasodilation that increases cerebral blood flow and oxygen entry into brain tissue results from both direct neuronal activation and peripheral vasoconstriction, which redistributes arterial blood from periphery to the brain. The latter factor could also explain a similar pattern of oxygen responses found in the substantia nigra reticulata, suggesting hyperoxia as a global phenomenon with minor structural differences during early time intervals following the stimulus onset. While arousing stimuli and cocaine induced similar oxygen responses in the brain and SC space, heroin induced a biphasic down-up brain oxygen fluctuation associated with a monophasic oxygen decrease in the SC space. Oxygen decreases occurred more rapidly and stronger in the SC space, reflecting a drop in blood oxygen levels due to respiratory depression.
Conflict of interest statement
The authors declare no competing interests.
Figures
Similar articles
-
Brain Hyperglycemia Induced by Heroin: Association with Metabolic Neural Activation.ACS Chem Neurosci. 2017 Feb 15;8(2):265-271. doi: 10.1021/acschemneuro.6b00246. Epub 2016 Oct 18. ACS Chem Neurosci. 2017. PMID: 27736094 Free PMC article.
-
Intravenous Heroin Induces Rapid Brain Hypoxia and Hyperglycemia that Precede Brain Metabolic Response.eNeuro. 2017 Jun 7;4(3):ENEURO.0151-17.2017. doi: 10.1523/ENEURO.0151-17.2017. eCollection 2017 May-Jun. eNeuro. 2017. PMID: 28593192 Free PMC article.
-
Rapid fluctuations in extracellular brain glucose levels induced by natural arousing stimuli and intravenous cocaine: fueling the brain during neural activation.J Neurophysiol. 2012 Sep;108(6):1669-84. doi: 10.1152/jn.00521.2012. Epub 2012 Jun 20. J Neurophysiol. 2012. PMID: 22723672 Free PMC article.
-
Central and Peripheral Mechanisms Underlying Physiological and Drug-Induced Fluctuations in Brain Oxygen in Freely-Moving Rats.Front Integr Neurosci. 2018 Oct 2;12:44. doi: 10.3389/fnint.2018.00044. eCollection 2018. Front Integr Neurosci. 2018. PMID: 30333733 Free PMC article. Review.
-
Hypoxic effects of heroin and fentanyl and their basic physiological mechanisms.Am J Physiol Lung Cell Mol Physiol. 2024 Dec 1;327(6):L930-L948. doi: 10.1152/ajplung.00251.2024. Epub 2024 Oct 15. Am J Physiol Lung Cell Mol Physiol. 2024. PMID: 39404797 Review.
Cited by
-
Oxygen fluctuations in the brain and periphery induced by intravenous fentanyl: effects of dose and drug experience.J Neurophysiol. 2024 Aug 1;132(2):322-334. doi: 10.1152/jn.00177.2024. Epub 2024 Jun 12. J Neurophysiol. 2024. PMID: 38863429 Free PMC article.
-
Brain oxygen responses induced by opioids: focus on heroin, fentanyl, and their adulterants.Front Psychiatry. 2024 Jan 17;15:1354722. doi: 10.3389/fpsyt.2024.1354722. eCollection 2024. Front Psychiatry. 2024. PMID: 38299188 Free PMC article. Review.
-
Xylazine effects on opioid-induced brain hypoxia.Psychopharmacology (Berl). 2023 Jul;240(7):1561-1571. doi: 10.1007/s00213-023-06390-y. Epub 2023 Jun 21. Psychopharmacology (Berl). 2023. PMID: 37340247 Free PMC article.
-
Basic physiological effects of ketamine-xylazine mixture as a general anesthetic preparation for rodent surgeries.Brain Res. 2023 Apr 1;1804:148251. doi: 10.1016/j.brainres.2023.148251. Epub 2023 Jan 20. Brain Res. 2023. PMID: 36690168 Free PMC article.
-
Neurovascular effects of cocaine: relevance to addiction.Front Pharmacol. 2024 Feb 22;15:1357422. doi: 10.3389/fphar.2024.1357422. eCollection 2024. Front Pharmacol. 2024. PMID: 38455961 Free PMC article. Review.
References
-
- Siesjo, B. Brain Energy Metabolism. (Wiley, 1978).
Publication types
MeSH terms
Substances
Grants and funding
LinkOut - more resources
Full Text Sources
Other Literature Sources
