. 2021 Mar 18;11(1):6298.
doi: 10.1038/s41598-021-85815-0.

Fine-tuning the performance of ddRAD-seq in the peach genome

Affiliations

Fine-tuning the performance of ddRAD-seq in the peach genome

Maximiliano Martín Aballay et al. Sci Rep. .

Abstract

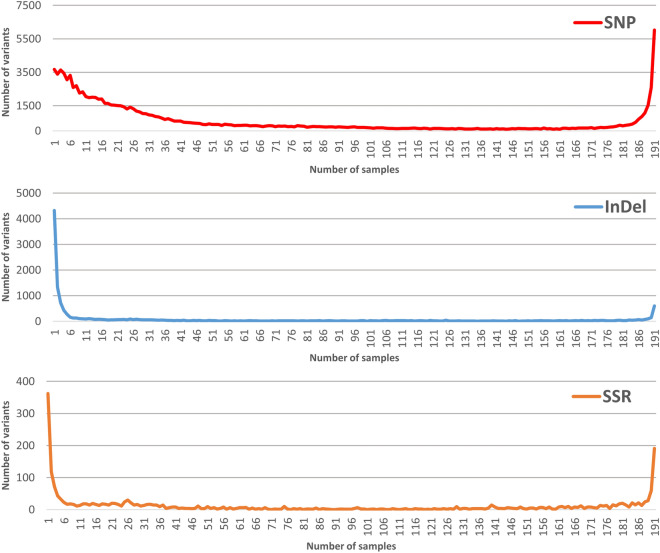
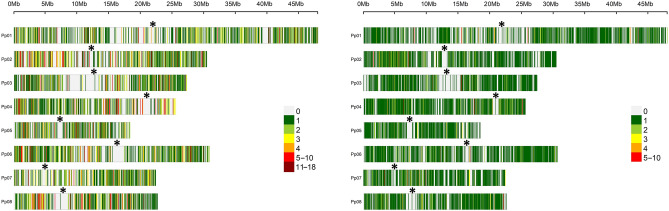
The advance of Next Generation Sequencing (NGS) technologies allows high-throughput genotyping at a reasonable cost, although, in the case of peach, this technology has been scarcely developed. To date, only a standard Genotyping by Sequencing approach (GBS), based on a single restriction with ApeKI to reduce genome complexity, has been applied in peach. In this work, we assessed the performance of the double-digest RADseq approach (ddRADseq), by testing 6 double restrictions with the restriction profile generated with ApeKI. The enzyme pair PstI/MboI retained the highest number of loci in concordance with the in silico analysis. Under this condition, the analysis of a diverse germplasm collection (191 peach genotypes) yielded 200,759,000 paired-end (2 × 250 bp) reads that allowed the identification of 113,411 SNP, 13,661 InDel and 2133 SSR. We take advantage of a wide sample set to describe technical scope of the platform. The novel platform presented here represents a useful tool for genomic-based breeding for peach.


Conflict of interest statement

The authors declare no competing interests.

Figures

Figure 1
Figure 1
Reduction of genome complexity. (a) In vitro enzymatic restrictions. Profile of peach DNA (Dixiland) quantification by fragment analyzer (Agilent). The vertical red dashed lines indicate the region to be selected (300–400 pb for double restrictions and 300–800 pb for restriction generated by ApeKI). The larger area at the region to be selected (highlighted in red) was obtained for the combination of PstI/MboI. (b) In silico simulation of enzymatic restriction. Profile of the predicted restriction fragments generated using different enzyme pair combinations in the peach reference genome (v2.0). Grey area: all the restriction fragments generated by in silico digestion using one enzyme pair. Red area: fragments predicted in the range 300–400 bp. Blue area: AB + BA fragments (i.e. fragments predicted to be generated by simultaneous digestion of both restriction enzymes) in the range 300–400 bp.
Figure 2
Figure 2
Increase of genome coverage by sequencing yield. The breadth (a) and depth (b) of coverages are shown.
Figure 3
Figure 3
Reads distribution along the peach genome. The black arrows indicate the position predicted for the centromere according to Verde et al. . For chromosome 1 (Pp01), the read number scale is restricted to 300 for comparison proposes. Only the bin Pp01-14,777,945–14,778,945 (indicated with a triangle) showed more than 300 reads. Supplementary Fig. S3 displays the full scale graph.
Figure 4
Figure 4
Uniformity of coverage. (a) Heatmap of correlations between samples. Color codification of correlation strength is indicated upper the heatmap. At the right, the total number of reads per sample and the mean (indicated with a red line) are shown. Exp. 1, experiment 1; Exp. 2, experiment 2. (b) Comparison of the common site observed between samples of the experimental pools (blue) with artificial created pools (red).
Figure 5
Figure 5
Principal Component Analysis of the number of read mapped on 1 K bins. Samples are codified with different colors according to the batch of analysis (Experiment 1 with two samples, and Experiment 2 with Pool 1–8) and shaped according to the DNA extraction method.
Figure 6
Figure 6
Distribution of the number of variant identified in group of samples. For each kind of variant identified (SNP, InDel and SSR), the number of variants genotyped in 1 to 191 peach samples are shown.
Figure 7
Figure 7
Density of SNPs along chromosomes. Number of SNPs within 1 Kb window size for the 7967 SNPs obtained with the platform developed (left) and the Ilumina 9 K SNP array (Verde et al., right) are shown. Vertical bar at the corners indicates the color assigned to the SNP number per 1 Kb window. The asterisks (*) indicate the putative location of centromeres.

References

    1. FAO. http://faostat.fao.org. Accessed 27 Feb 2020 (2020).
    1. Gogorcena Y, Sánchez G, Moreno-Vázquez S, Pérez S, Ksouri N. Genomic-based breeding for climate-smart peach varieties. In: Kole C, editor. Genomic Designing of Climate-Smart Fruit Crops. Springer International Publishing; 2020. pp. 271–331.
    1. Verde I, Abbott AG, Scalabrin S, Jung S, Shu S, Marroni F, et al. The high-quality draft genome of peach (Prunus persica) identifies unique patterns of genetic diversity, domestication and genome evolution. Nat. Genet. 2013;45(5):487–494. doi: 10.1038/ng.2586. - DOI - PubMed
    1. Verde I, Jenkins J, Dondini L, Micali S, Pagliarani G, Vendramin E, et al. The Peach v2.0 release: High-resolution linkage mapping and deep resequencing improve chromosome-scale assembly and contiguity. BMC Genomics. 2017;18(1):225. doi: 10.1186/s12864-017-3606-9. - DOI - PMC - PubMed
    1. Verde I, Bassil N, Scalabrin S, Gilmore B, Lawley CT, Gasic K, et al. Development and evaluation of a 9K SNP array for peach by internationally coordinated SNP detection and validation in breeding germplasm. PLoS ONE. 2012;7(4):e35668. doi: 10.1371/journal.pone.0035668. - DOI - PMC - PubMed

Publication types

MeSH terms

Substances

LinkOut - more resources