. 2021 May;6(5):553-562.
doi: 10.1038/s41564-021-00878-z. Epub 2021 Mar 18.

Single-molecule imaging reveals that Z-ring condensation is essential for cell division in Bacillus subtilis

Affiliations

Single-molecule imaging reveals that Z-ring condensation is essential for cell division in Bacillus subtilis

Georgia R Squyres et al. Nat Microbiol. 2021 May.

Abstract

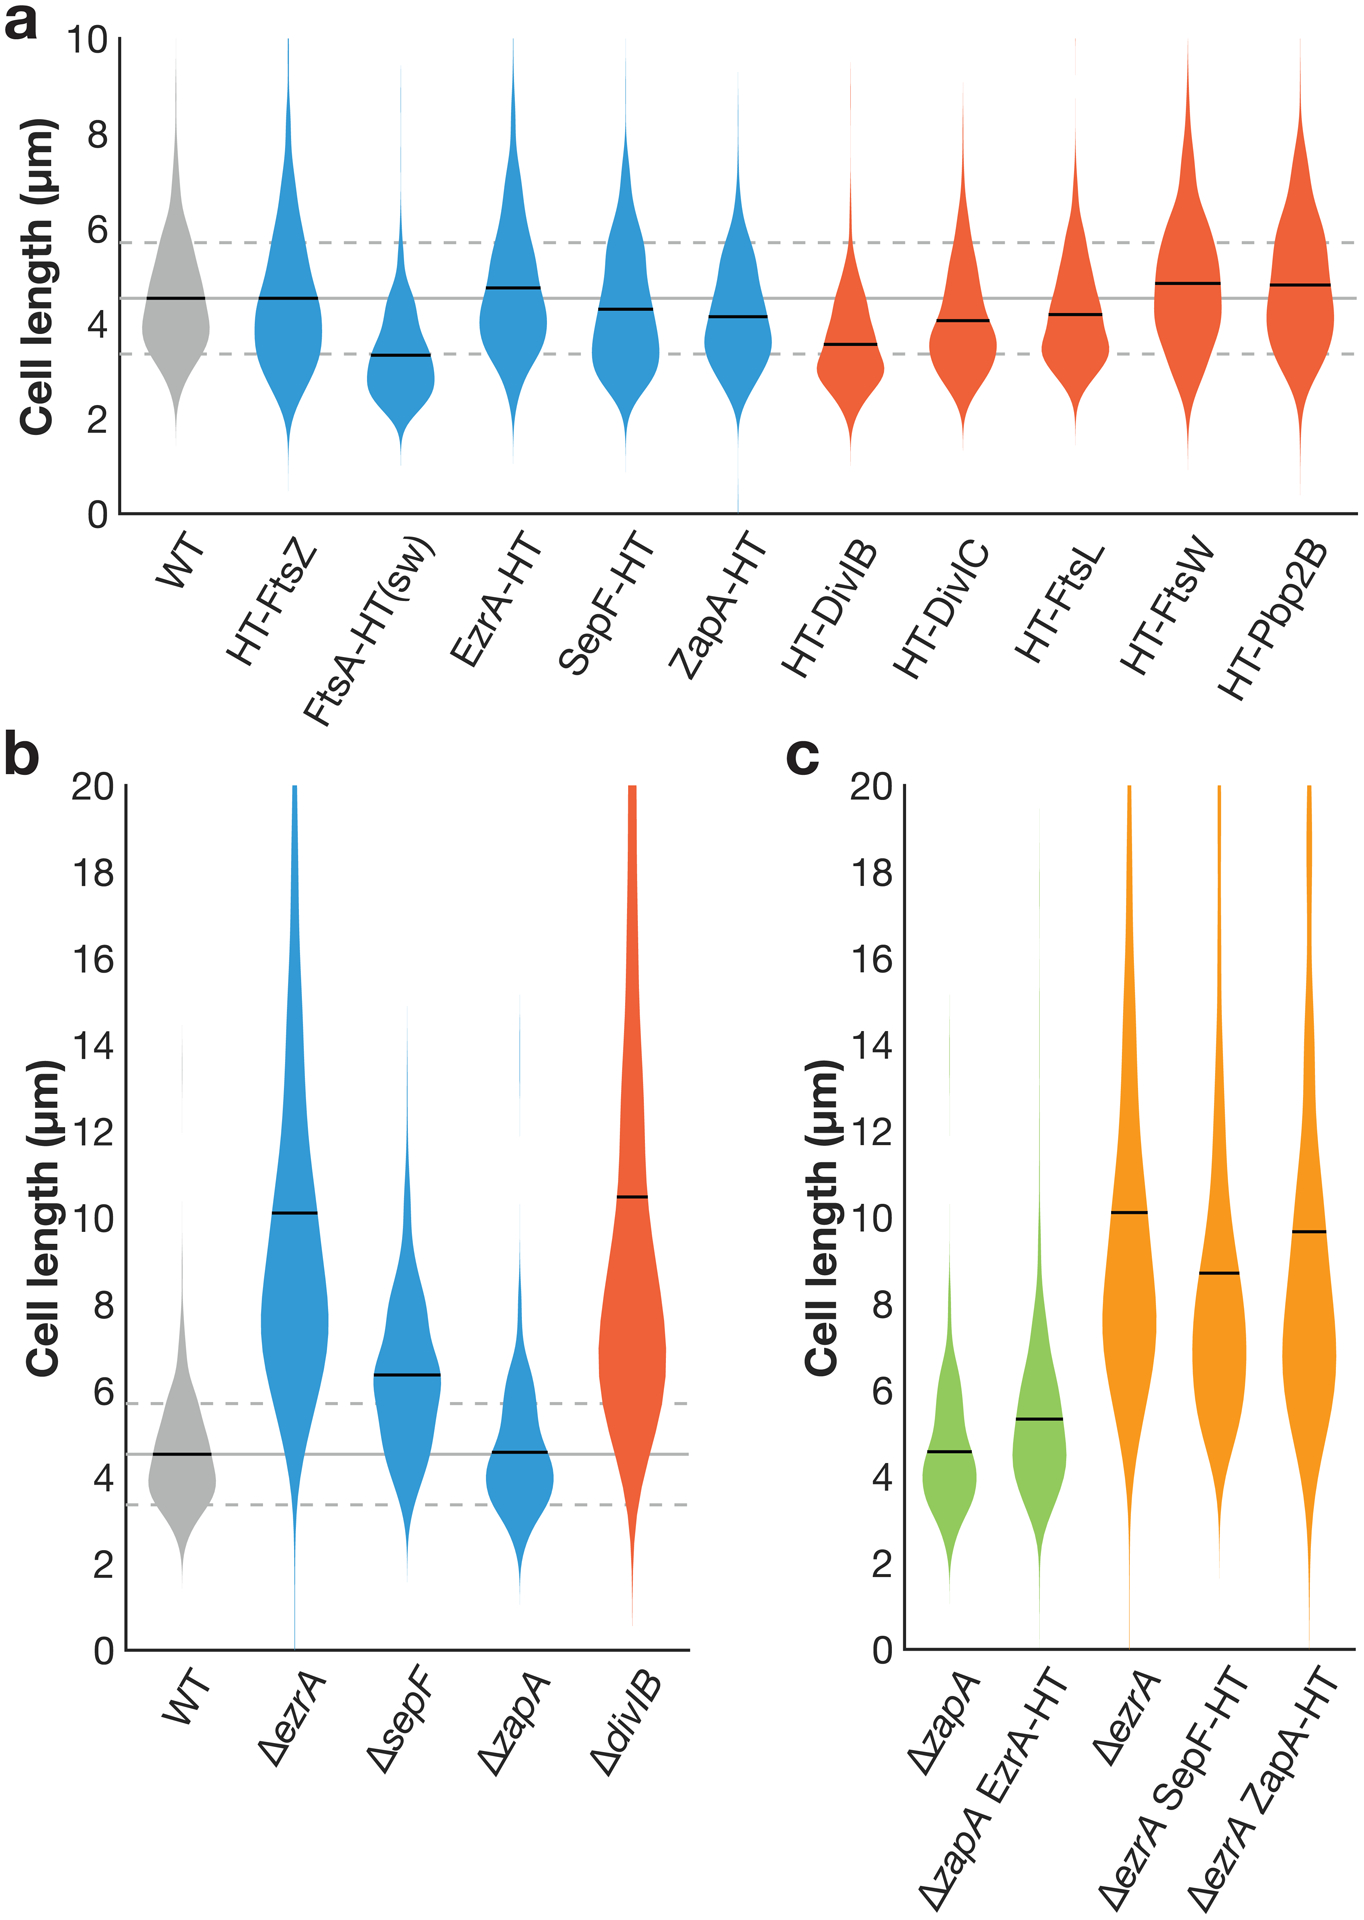
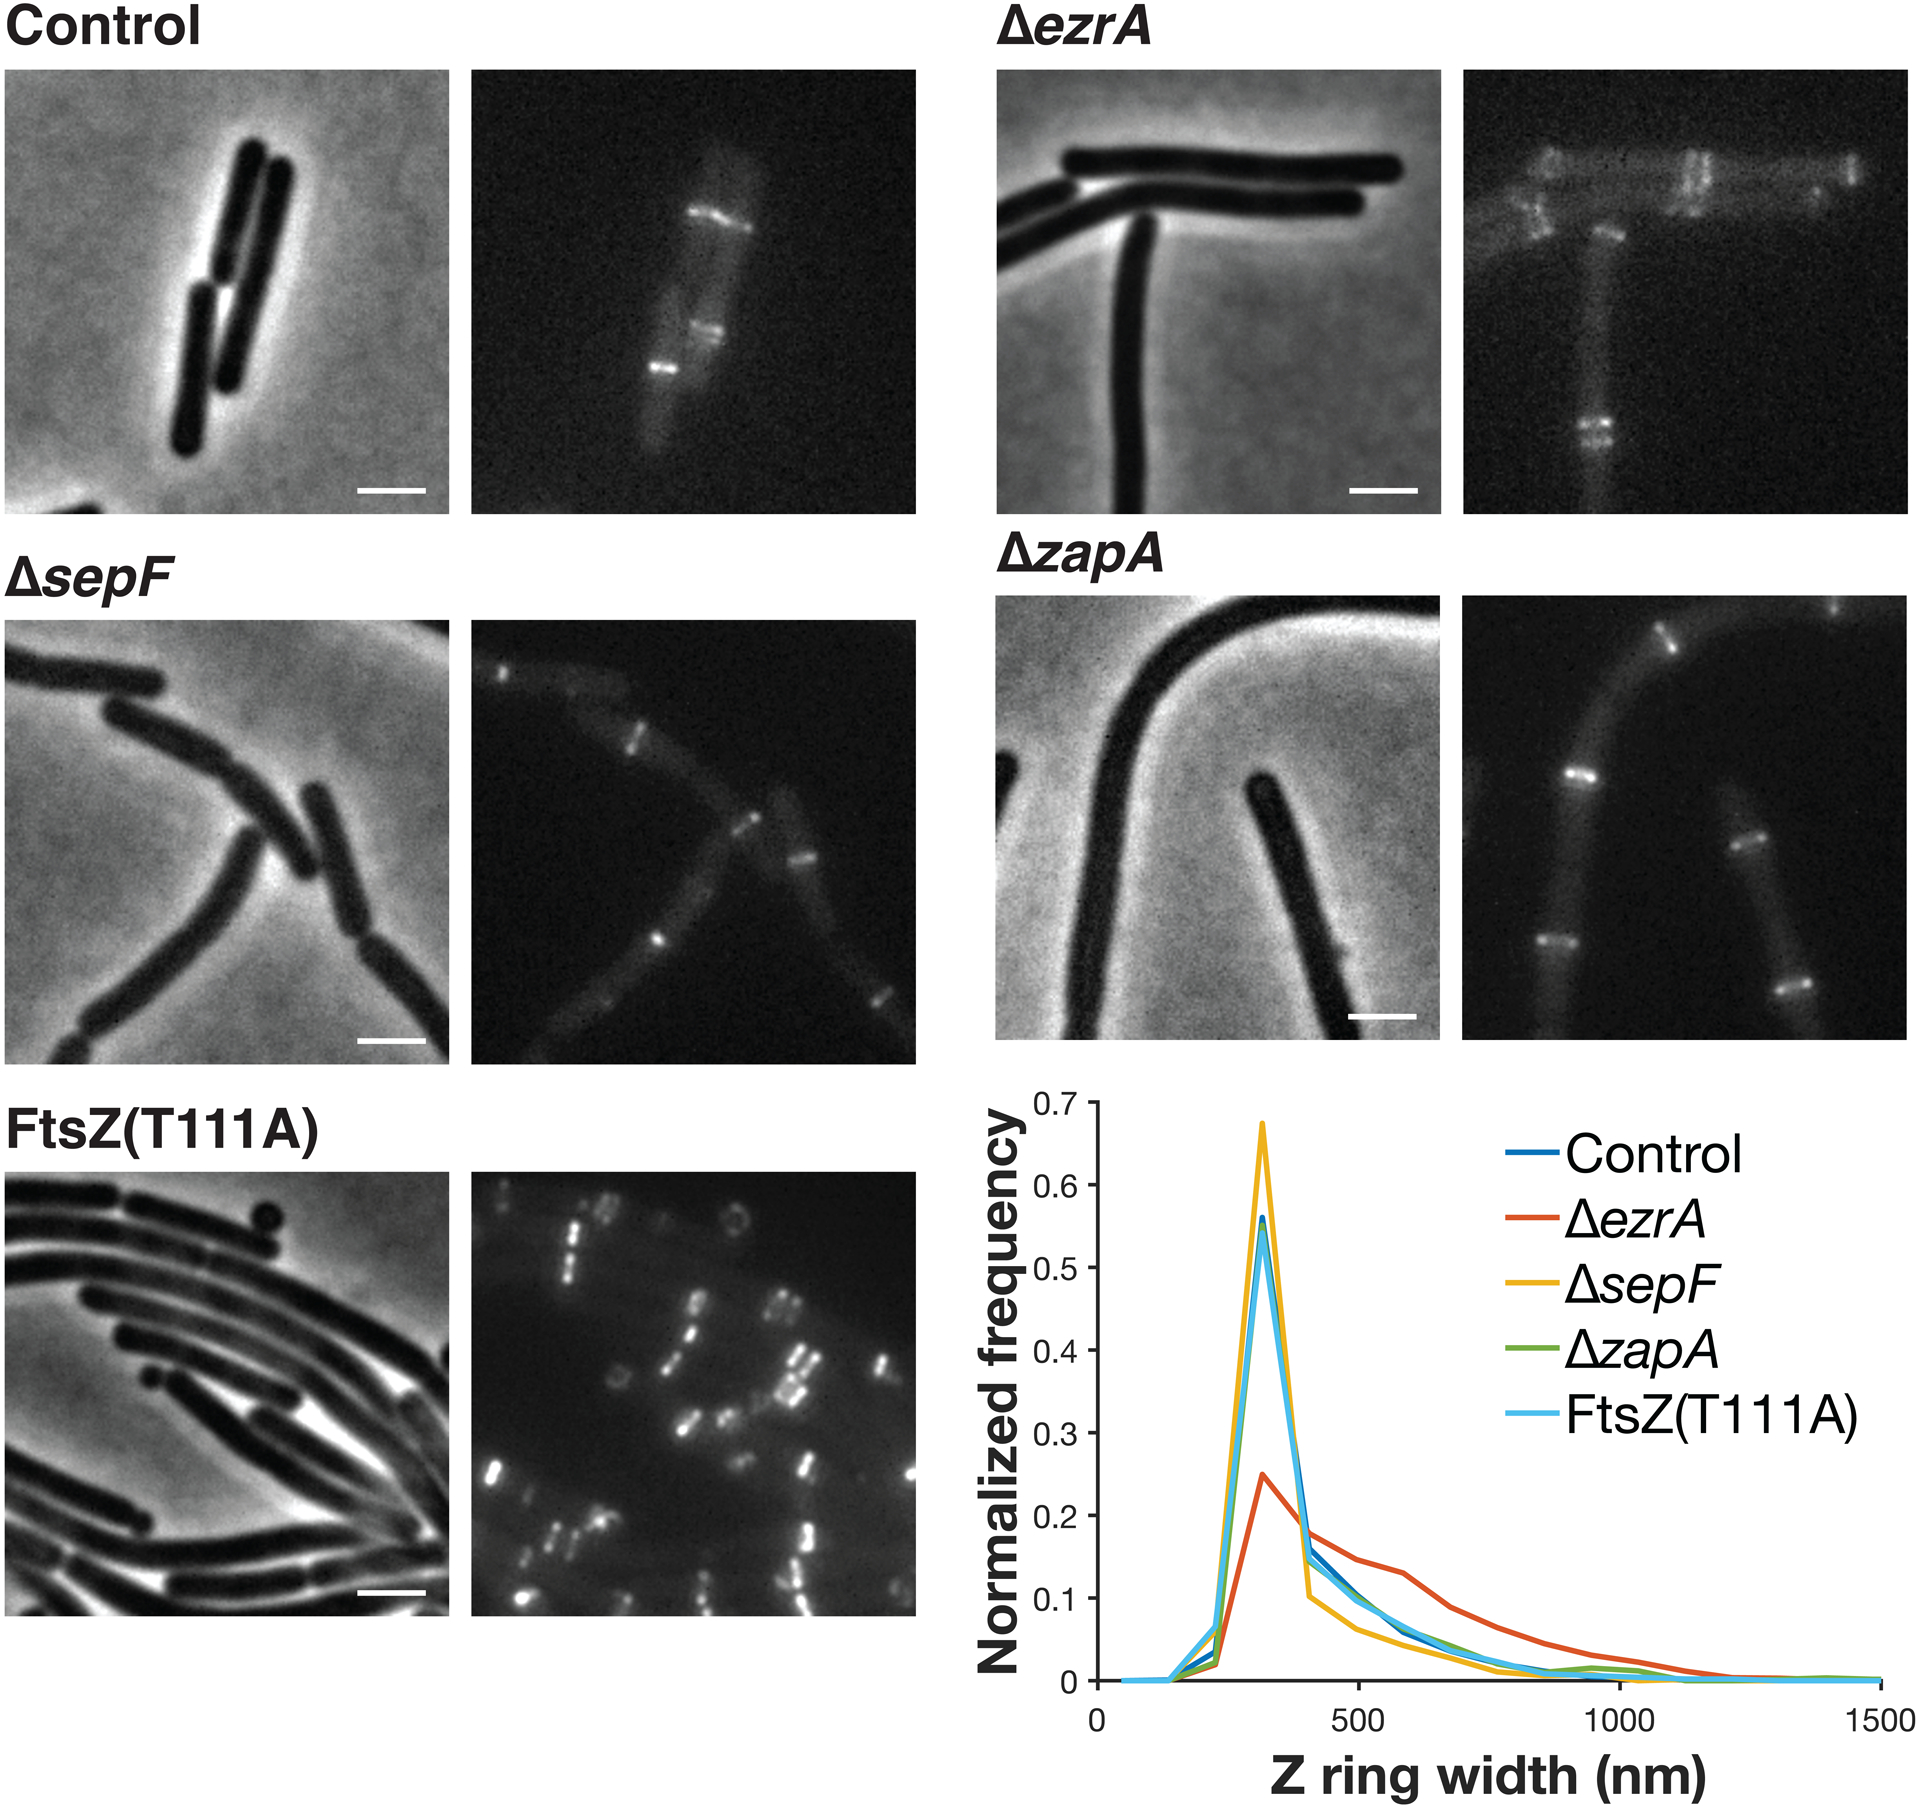
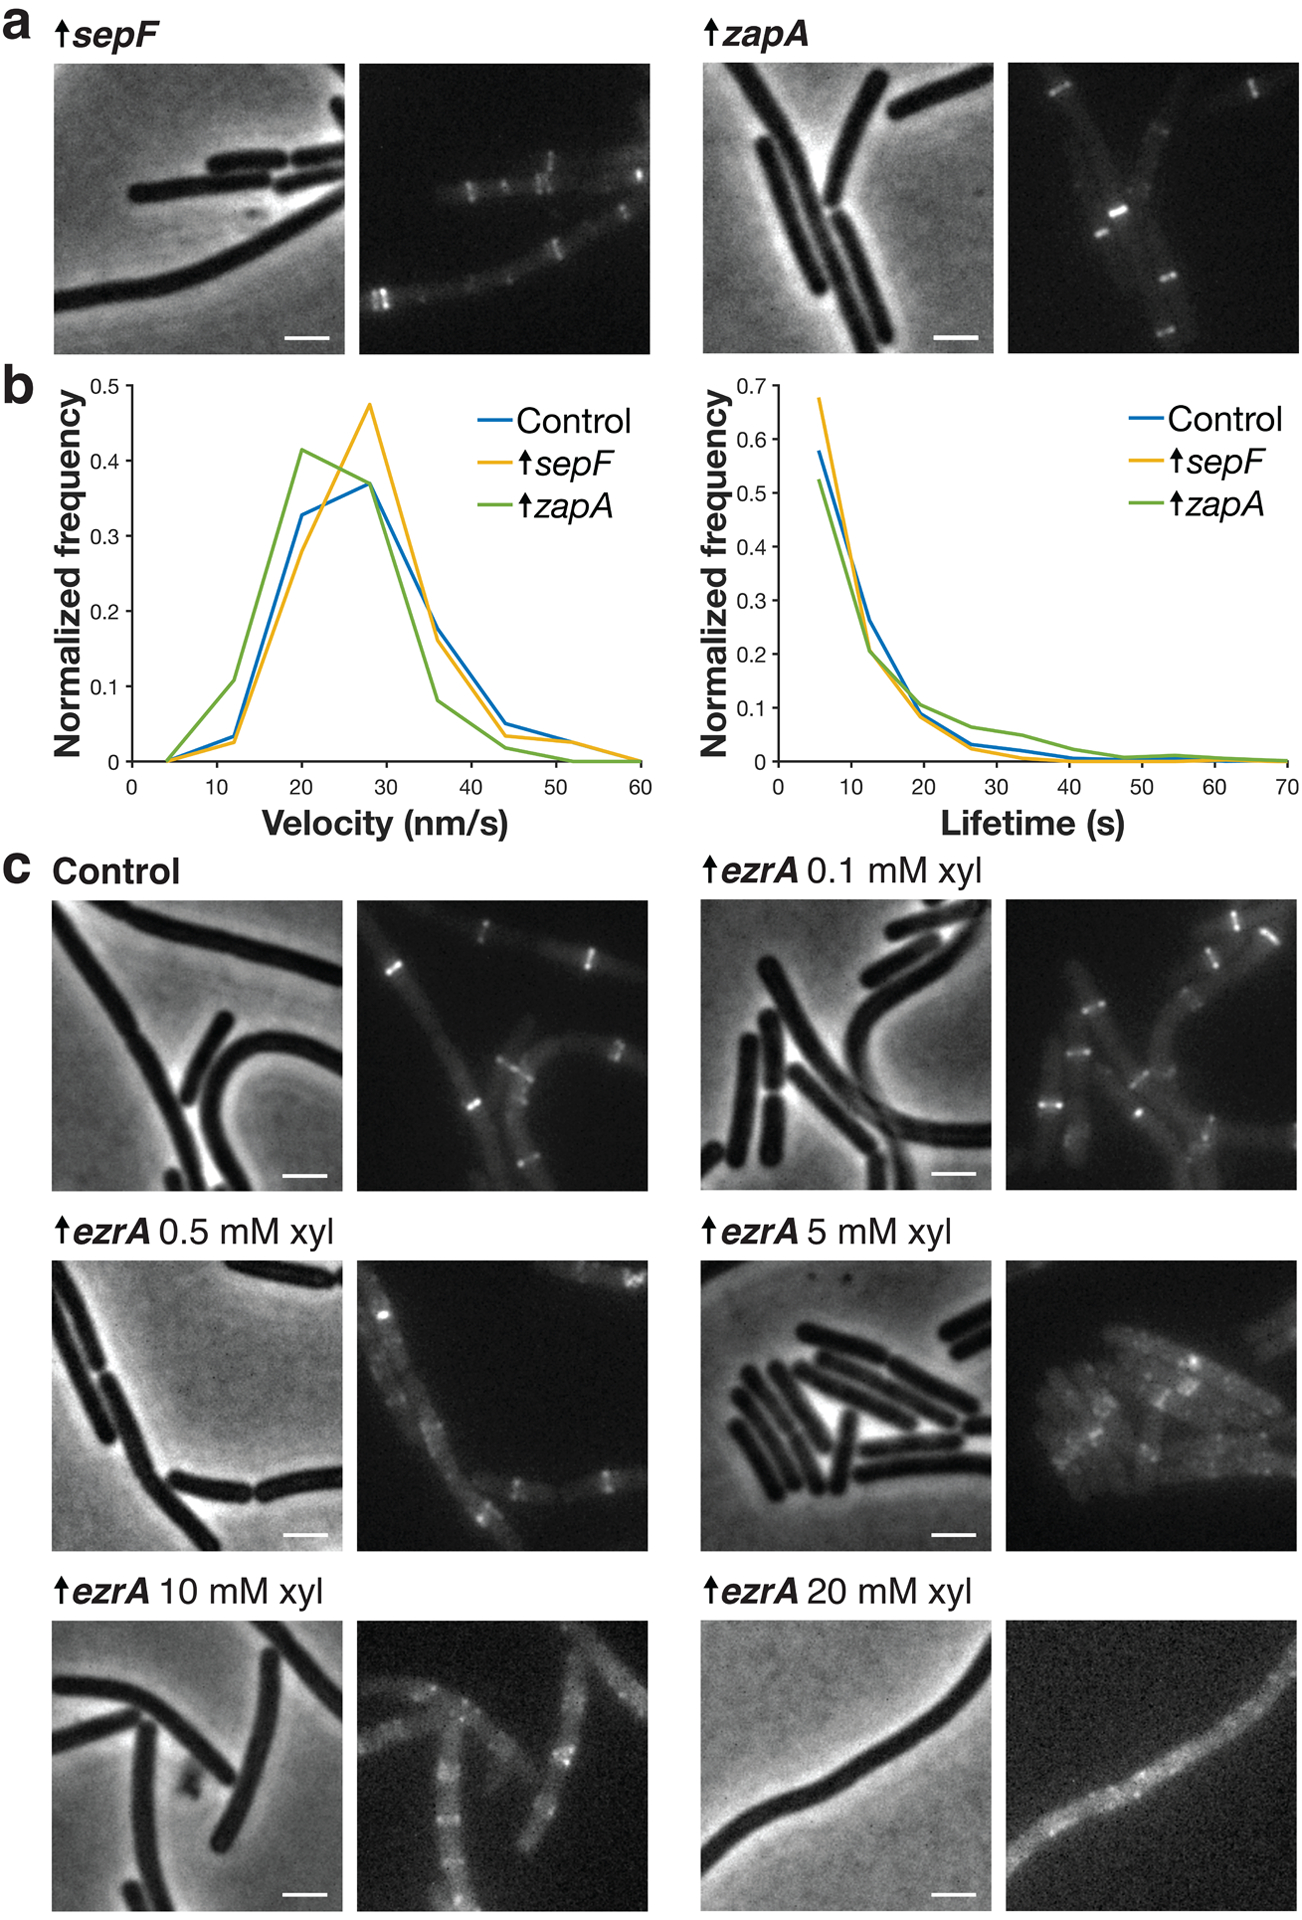
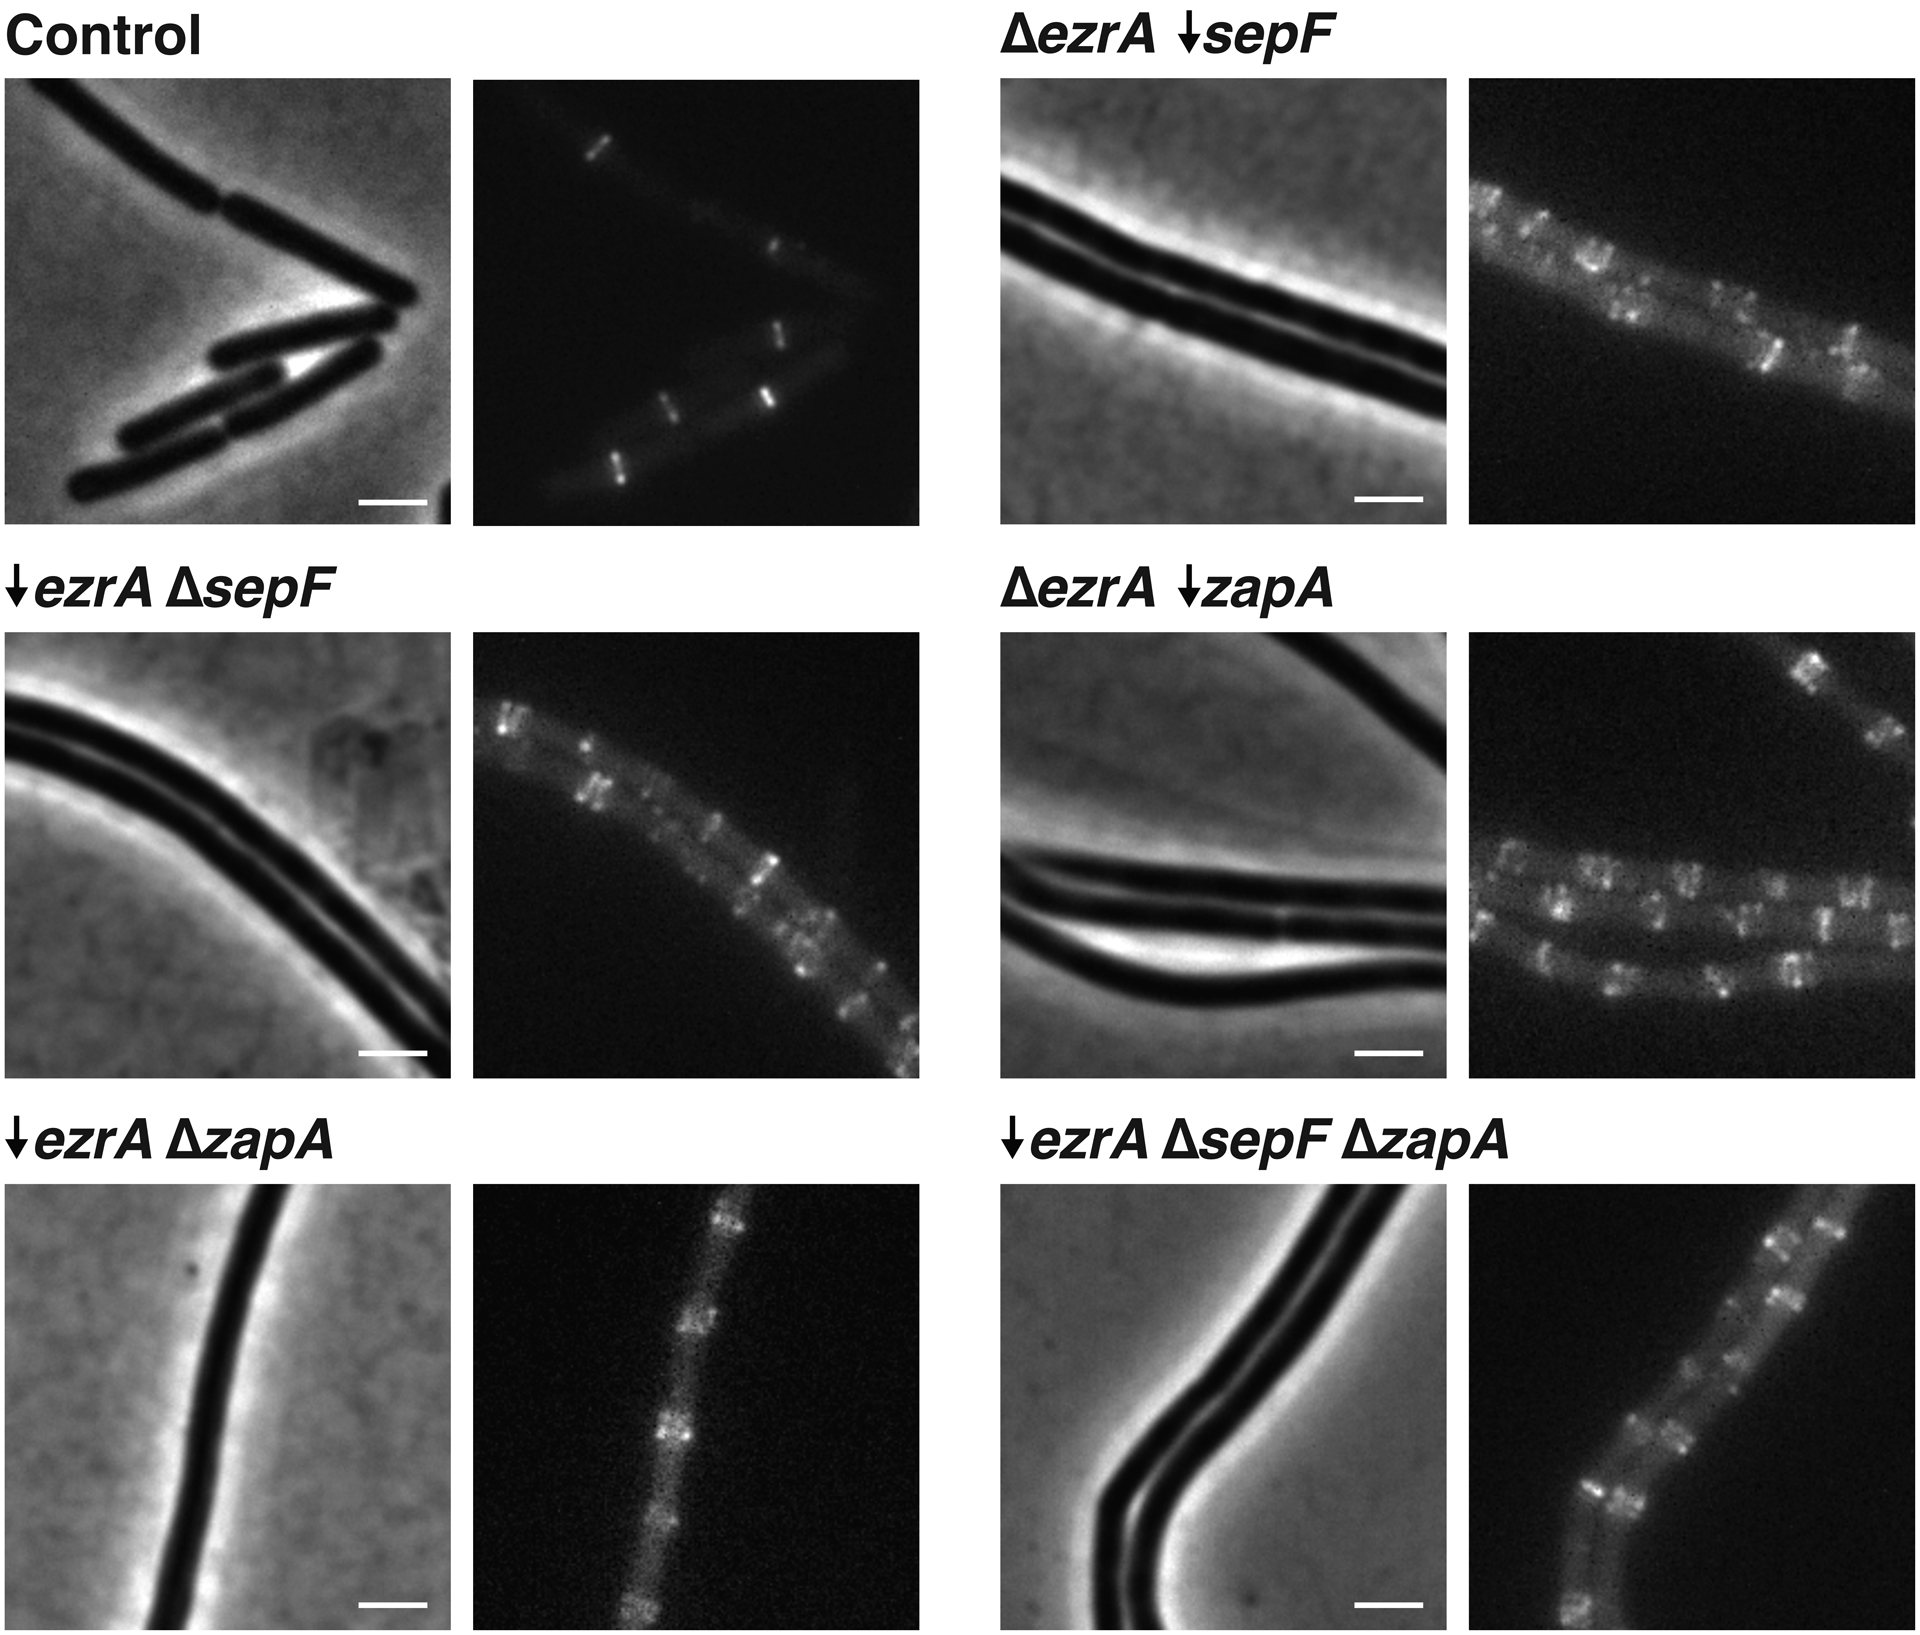
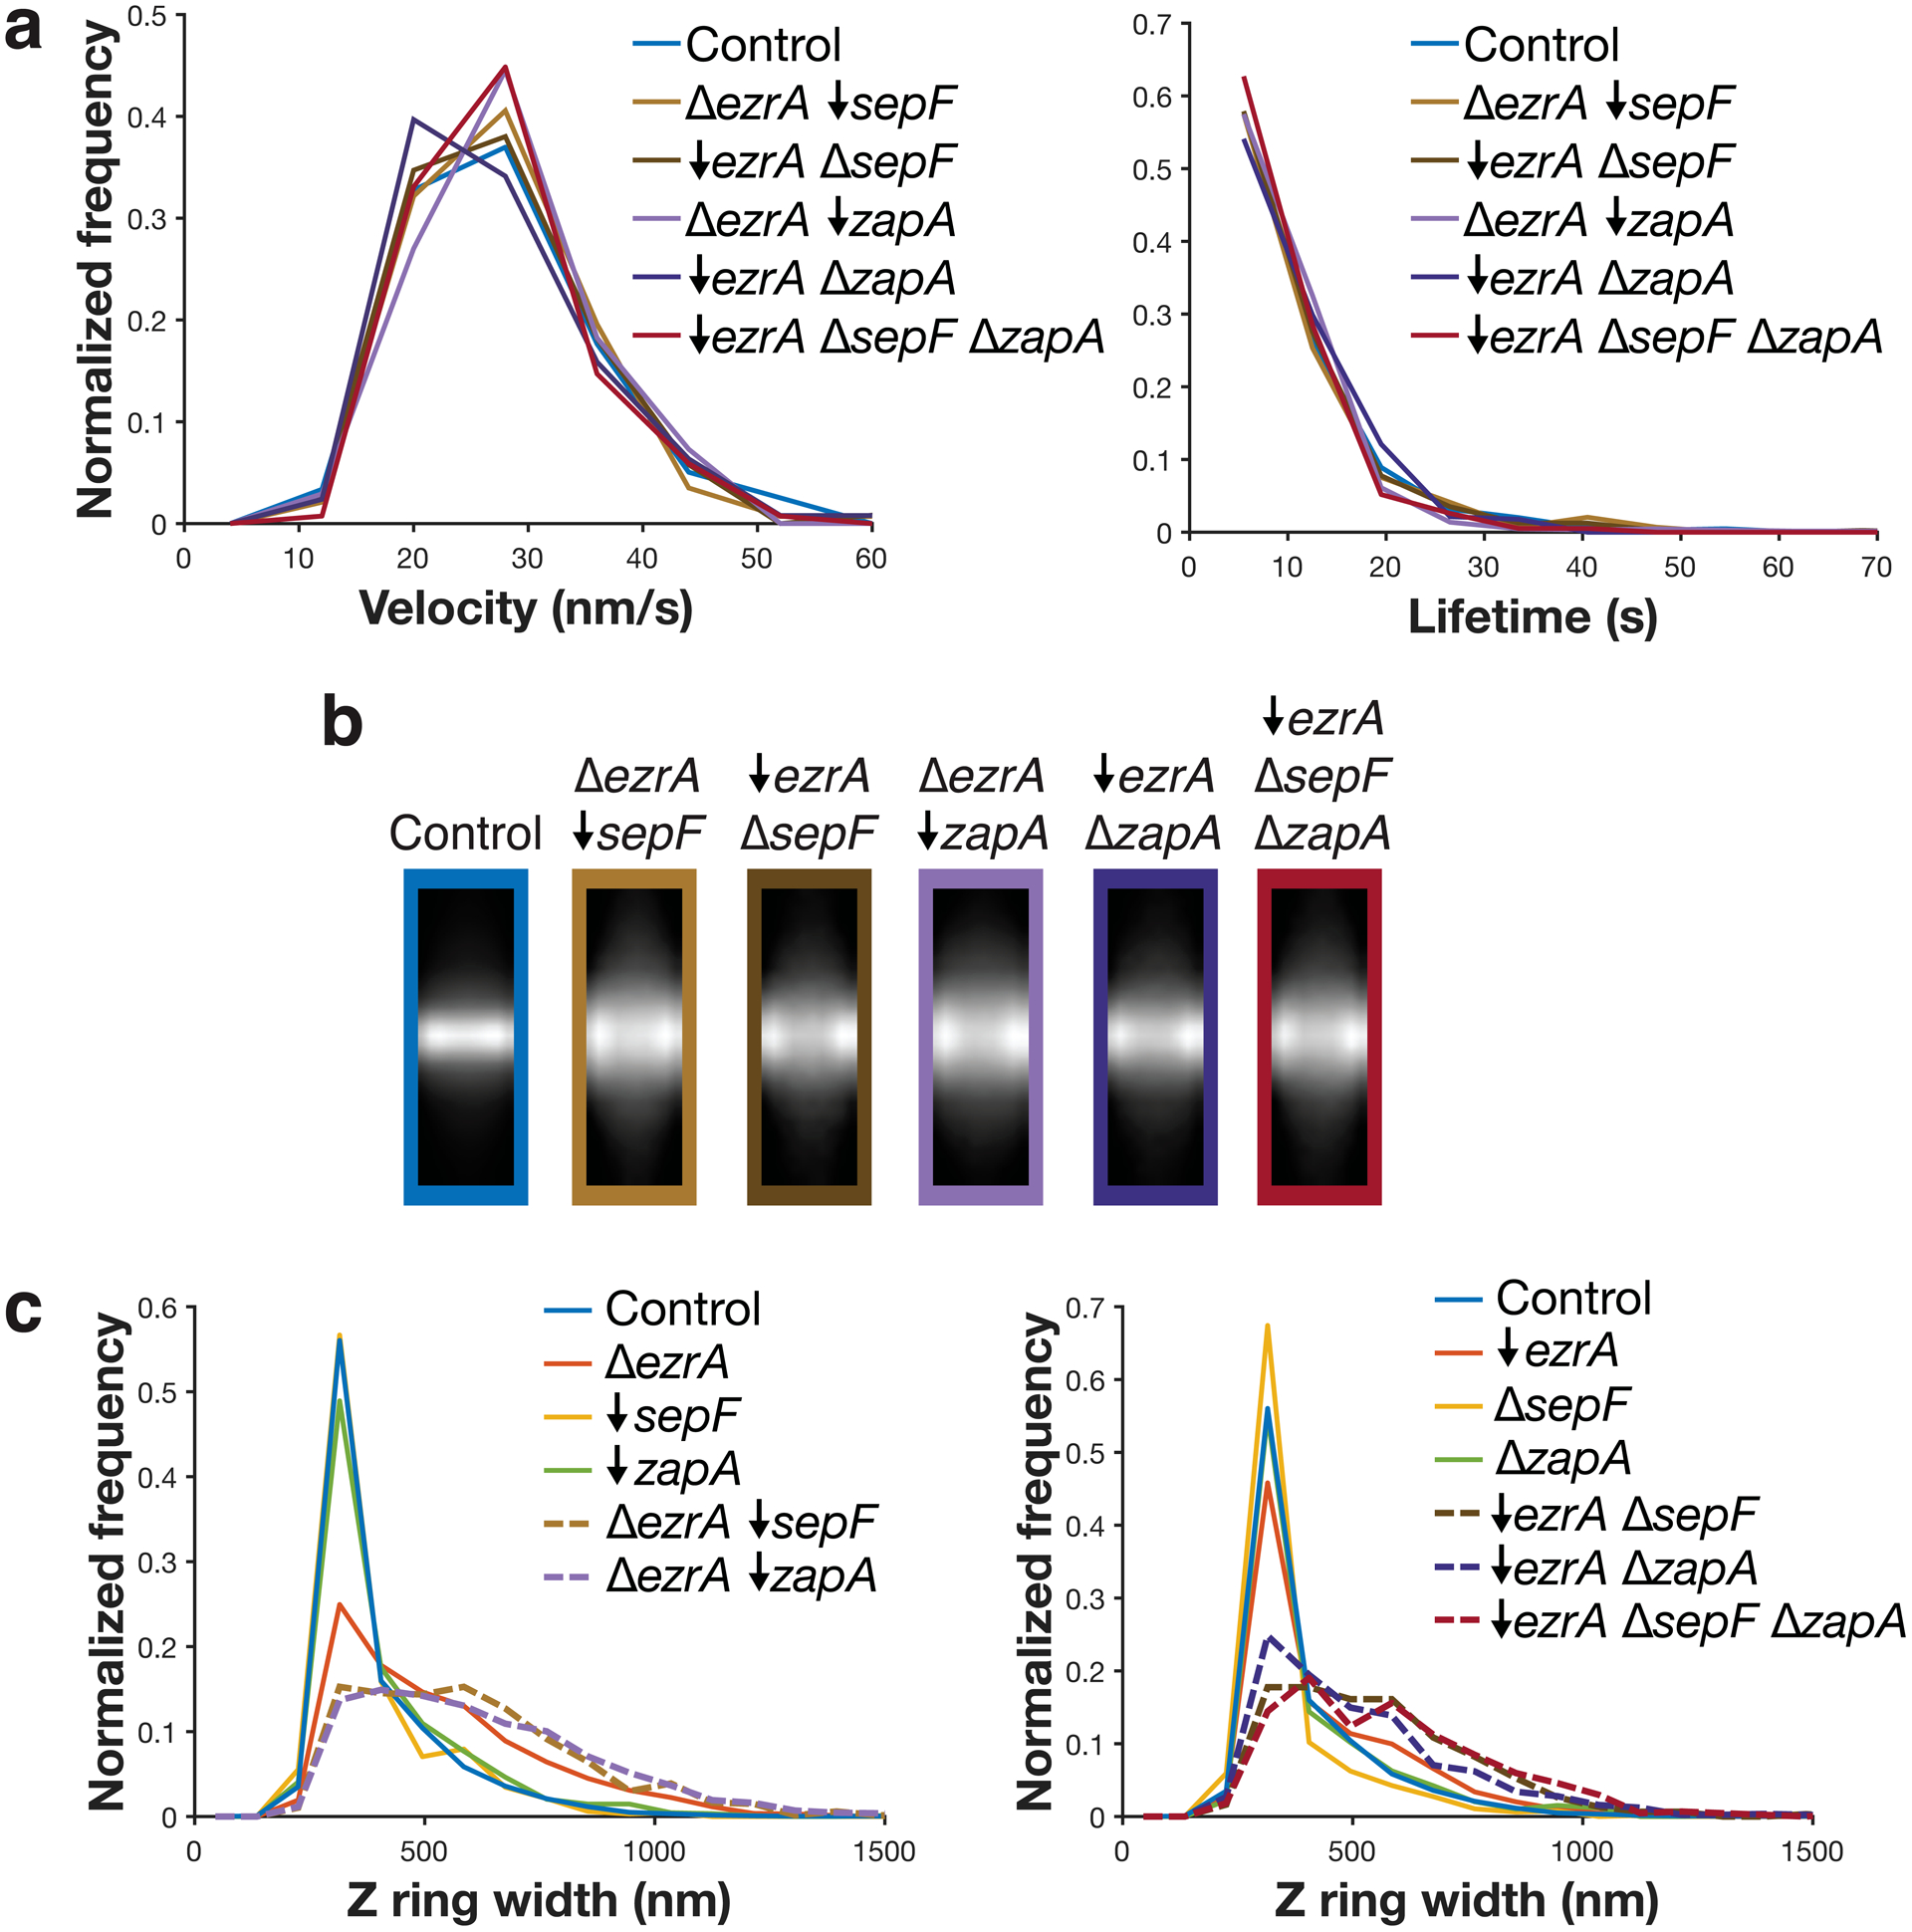
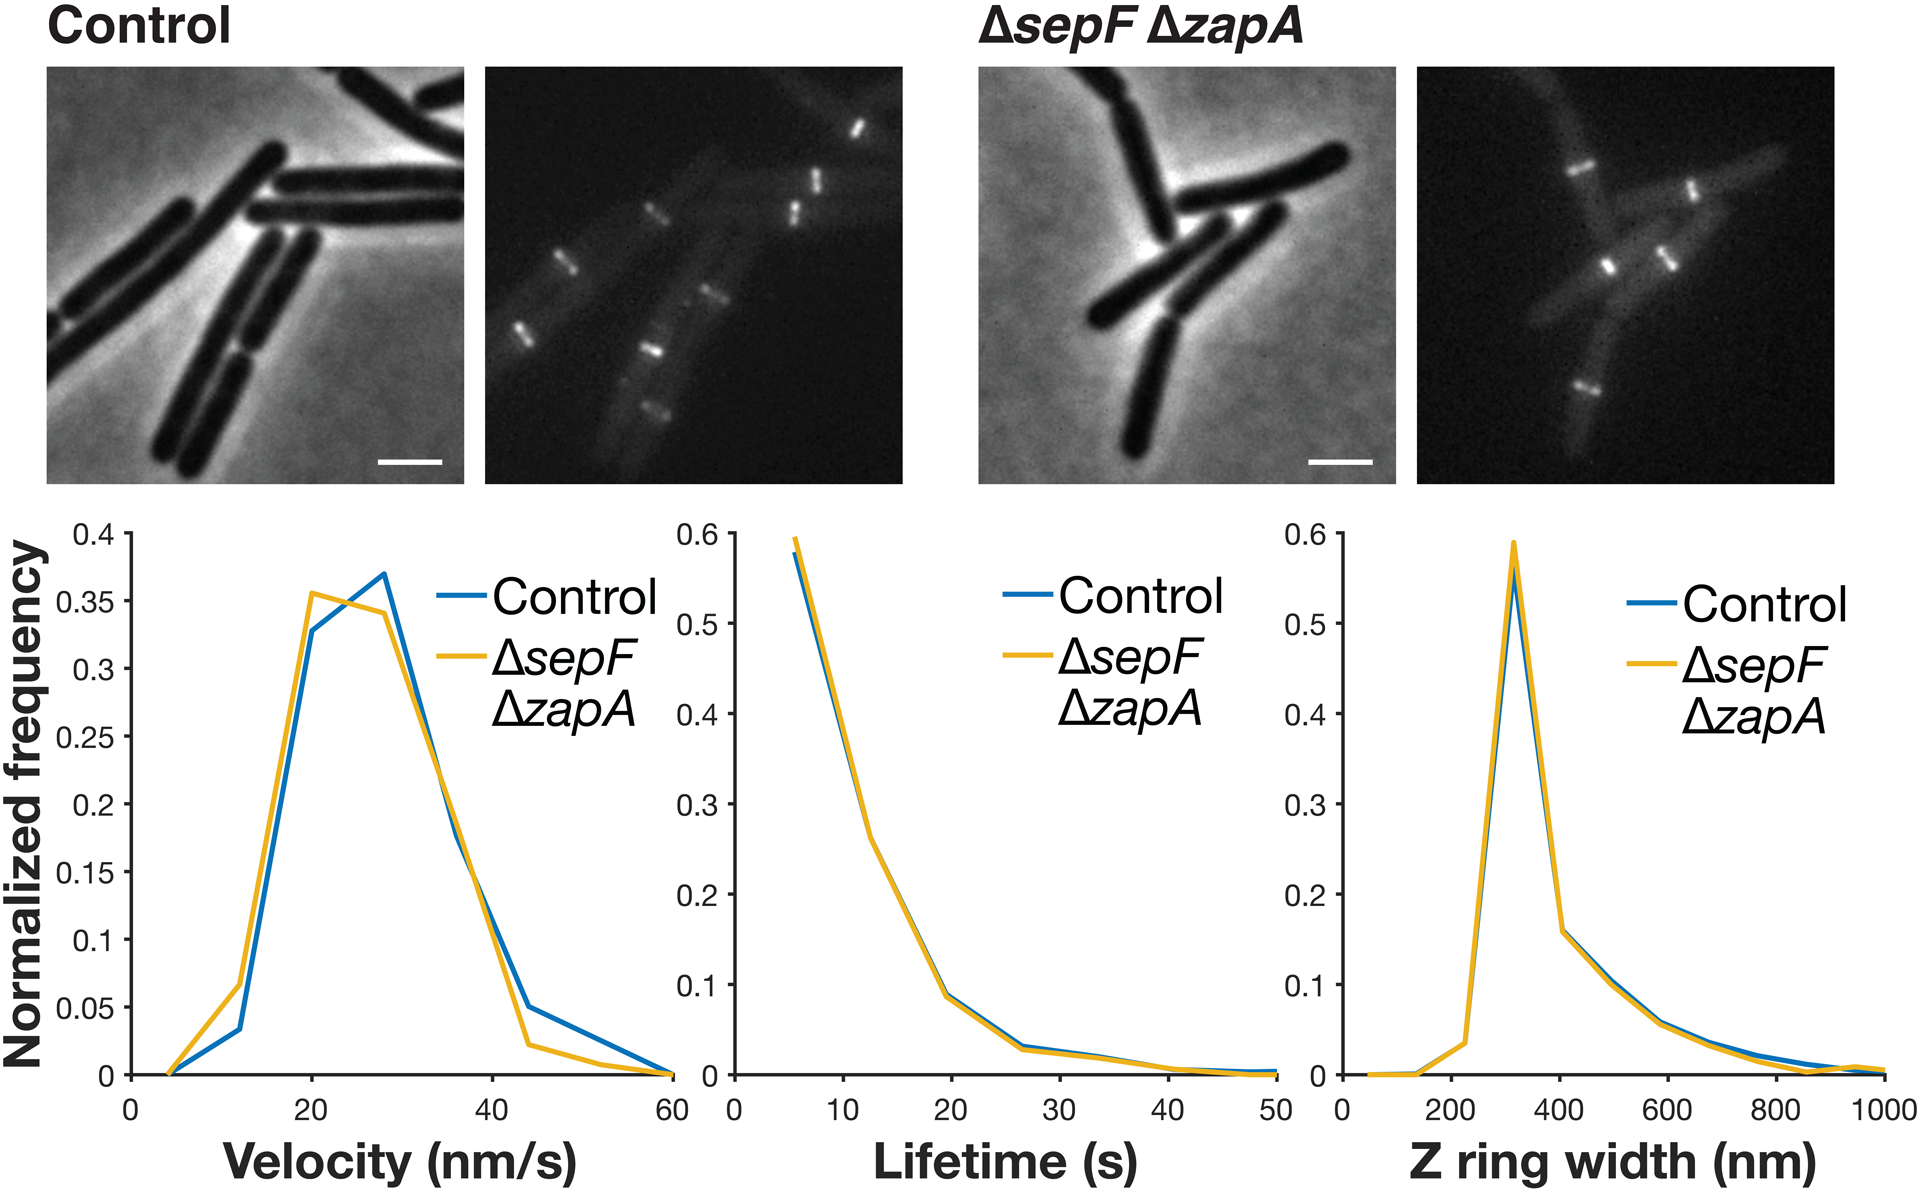
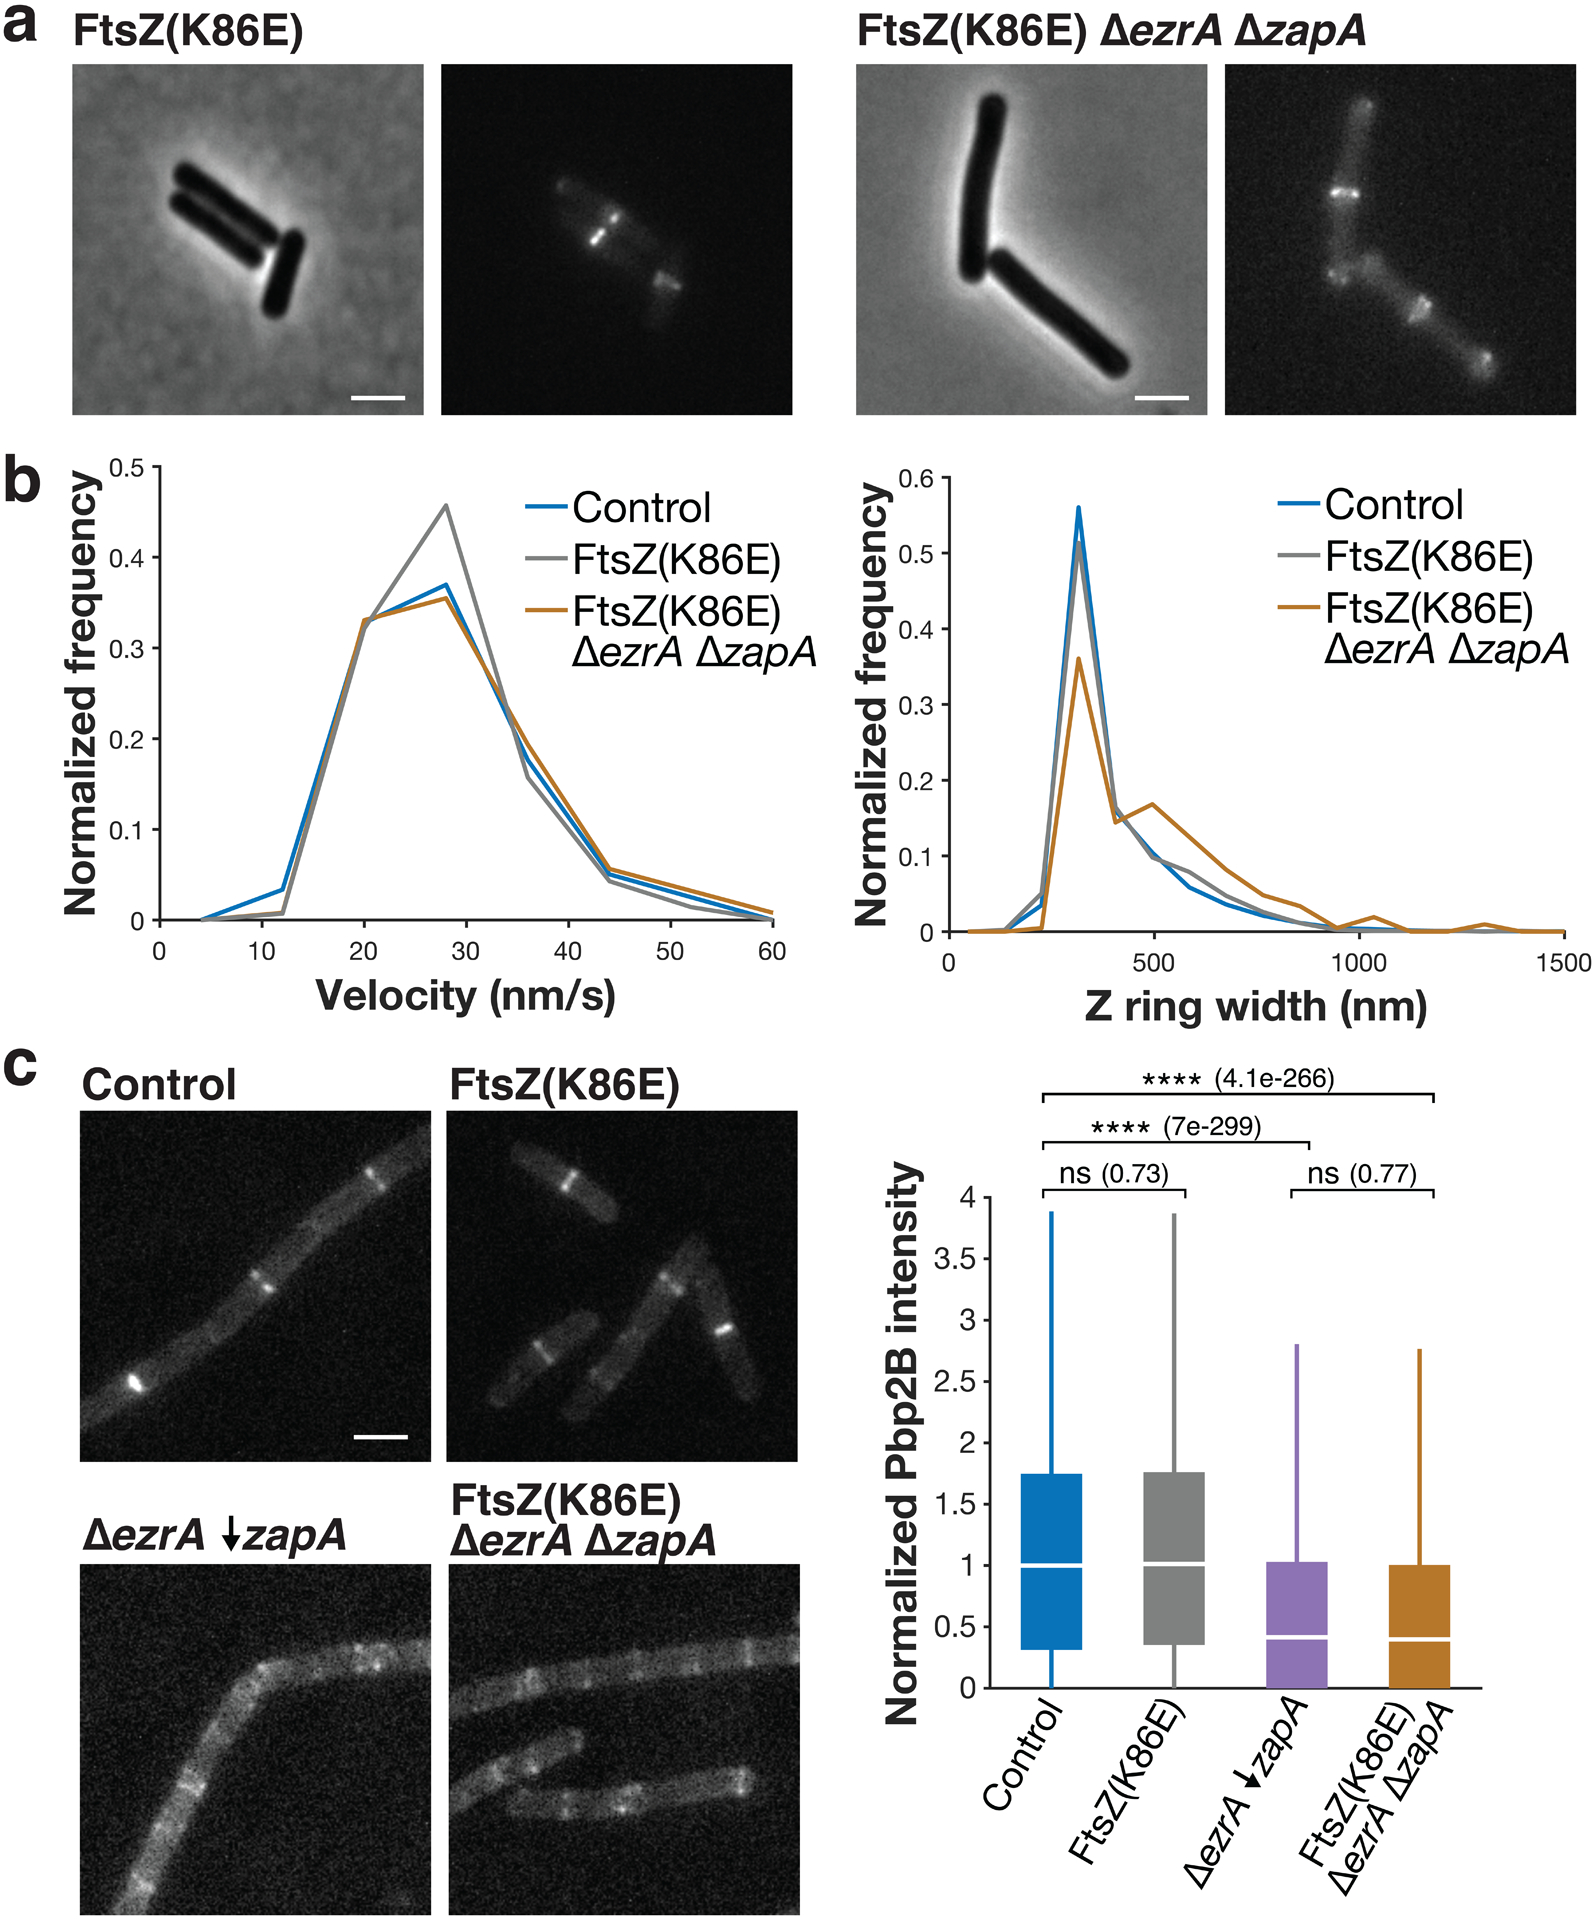
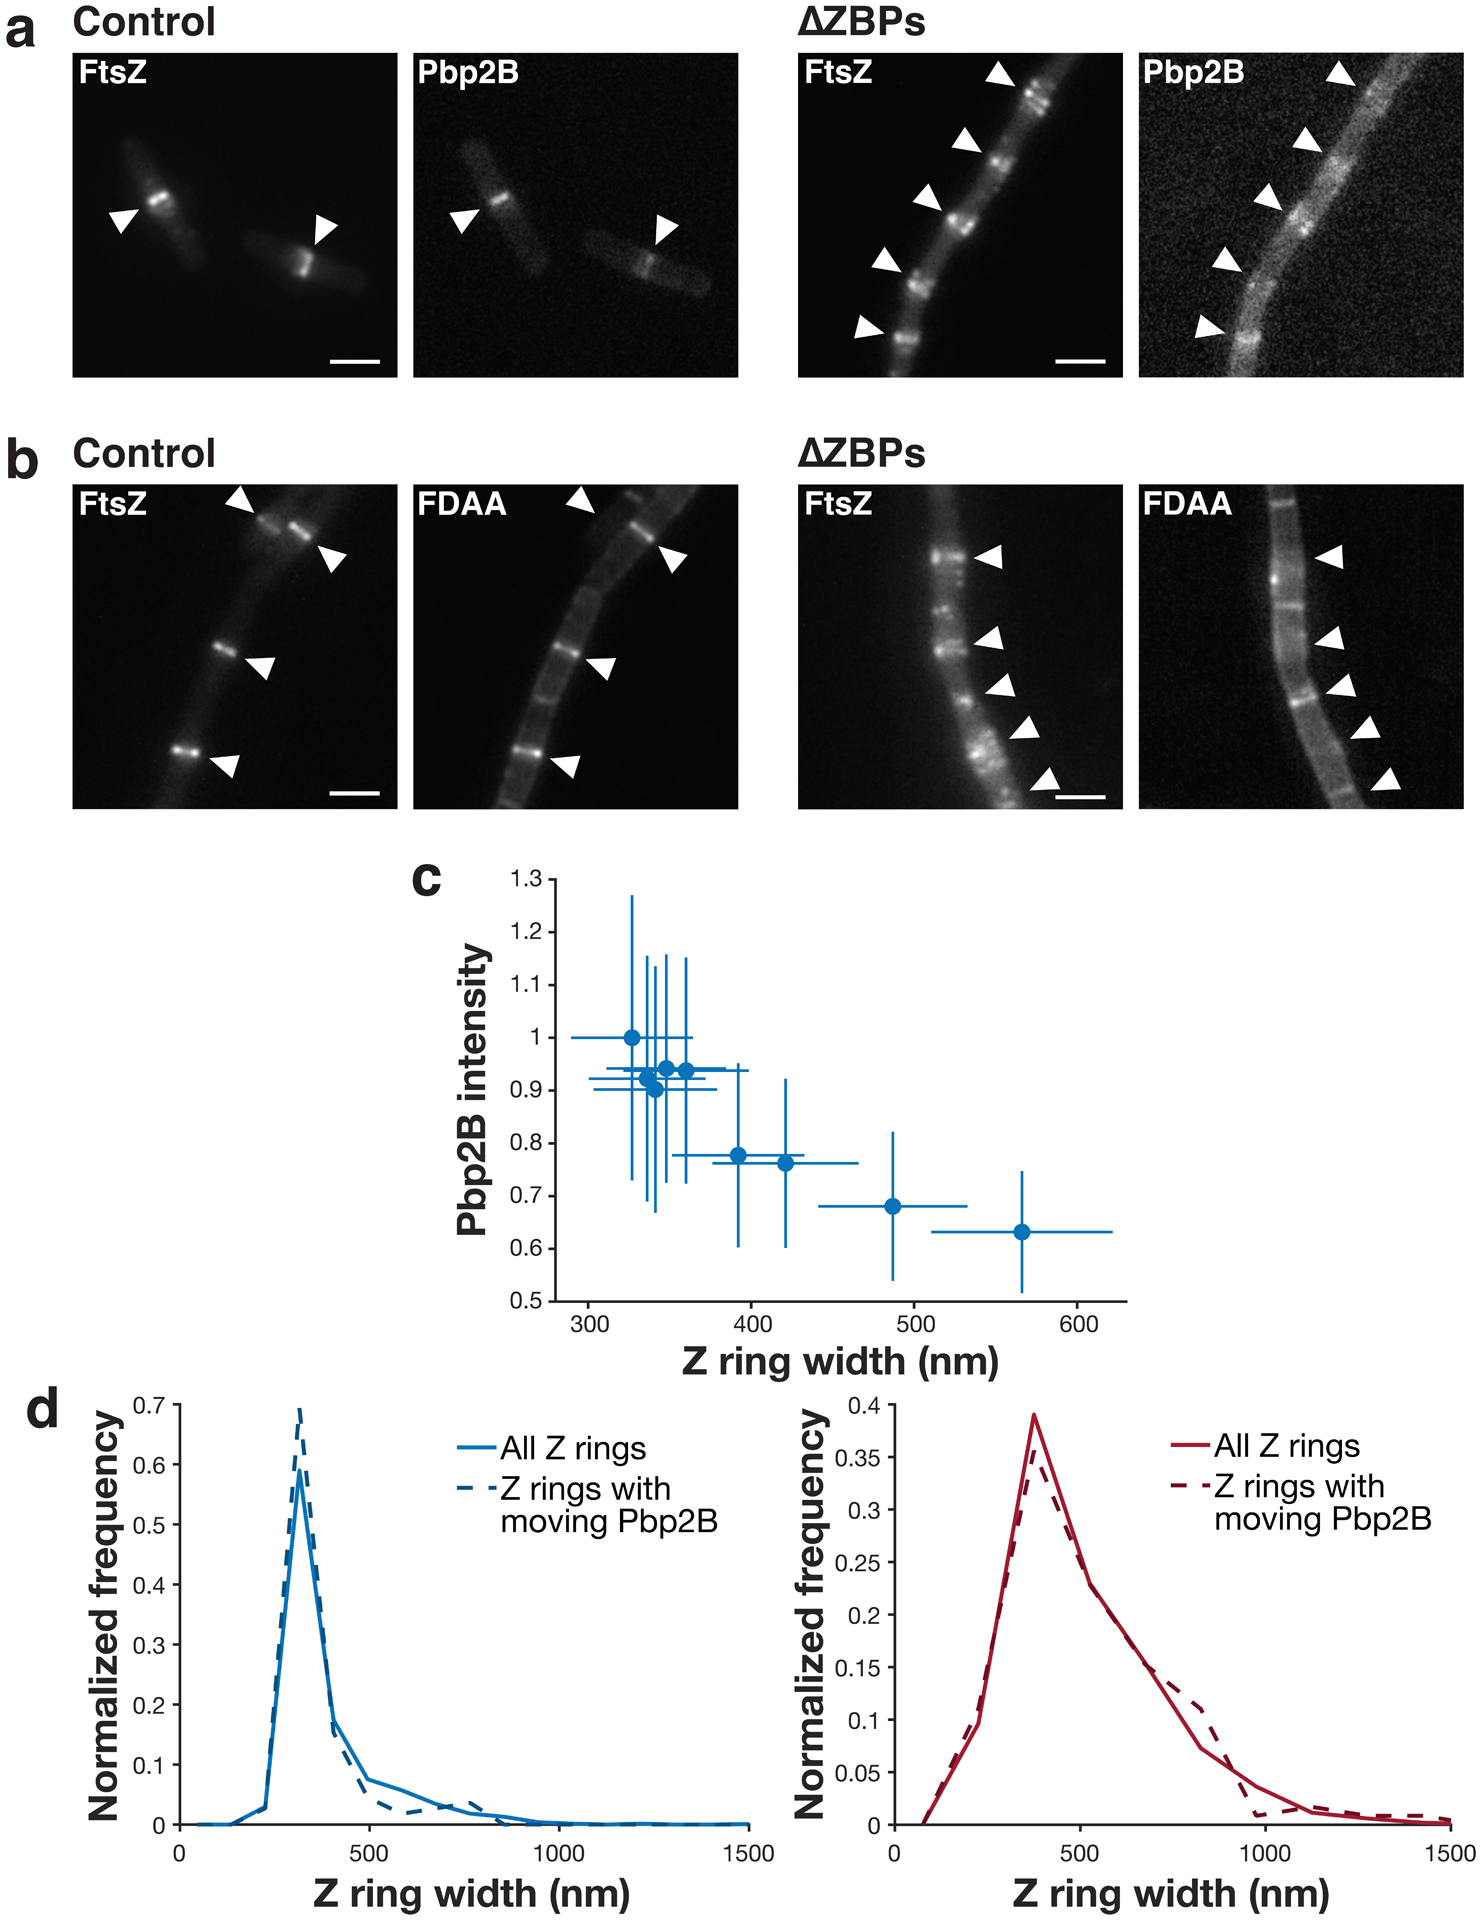
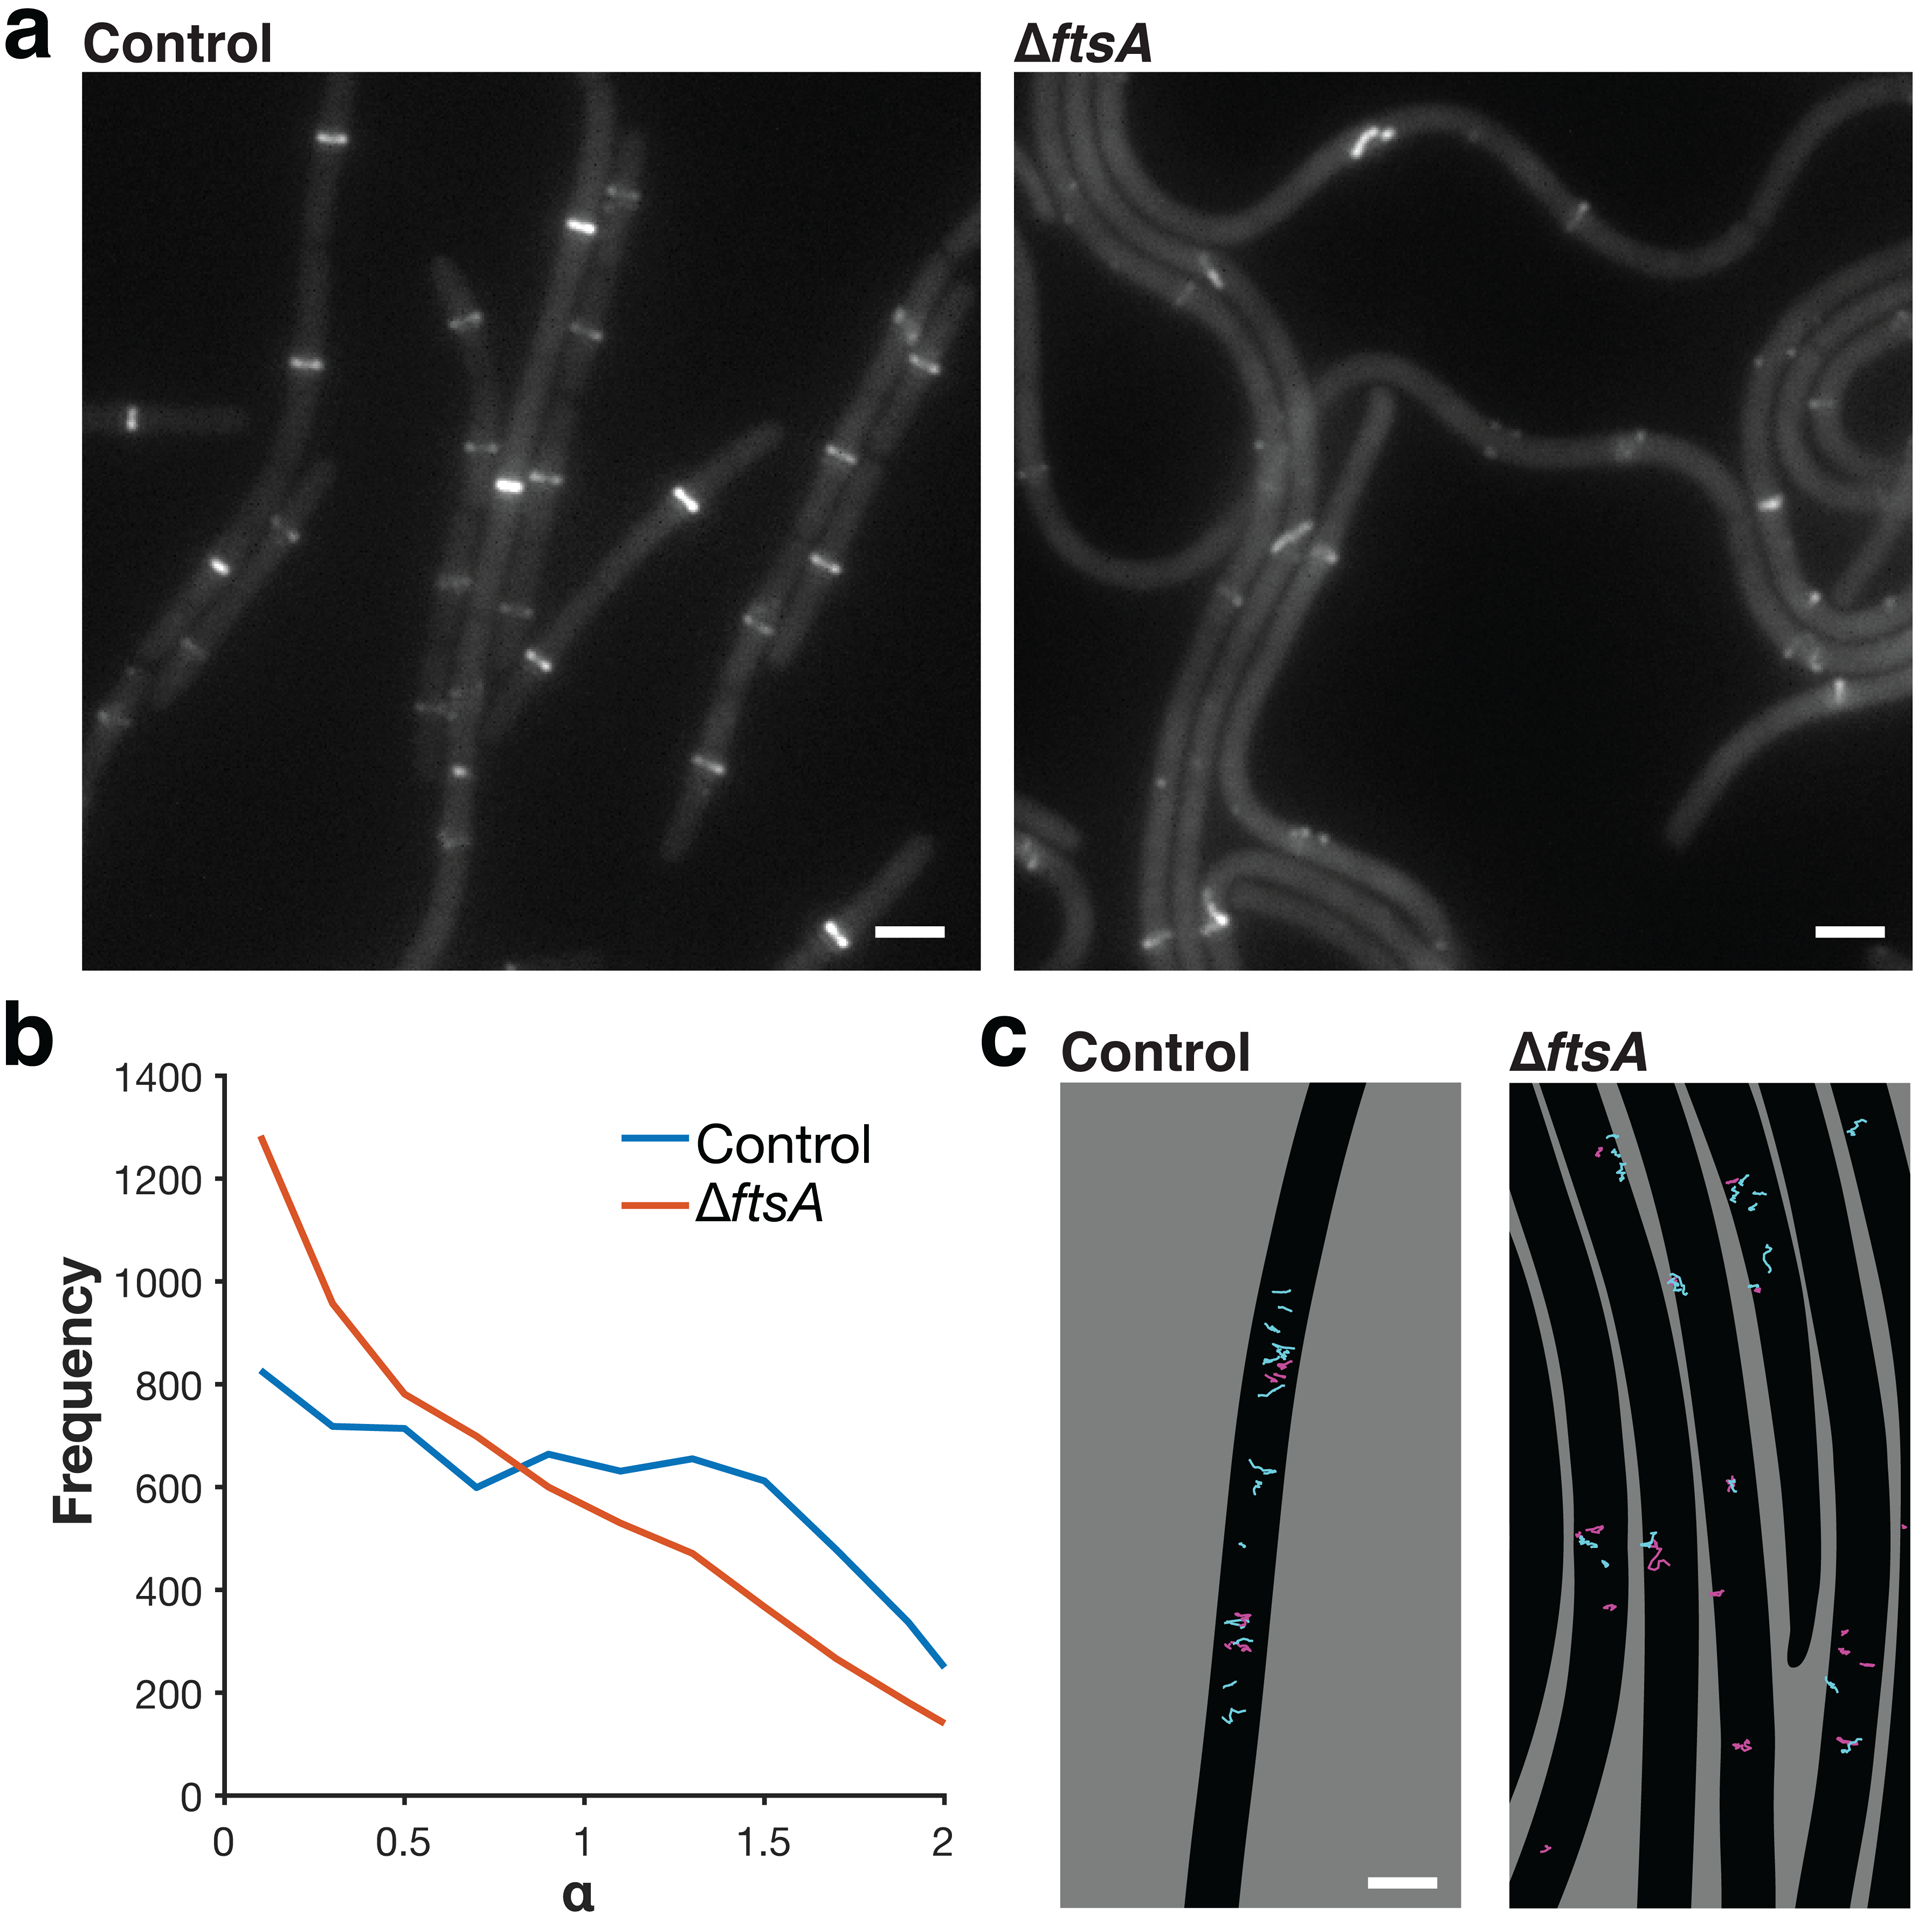
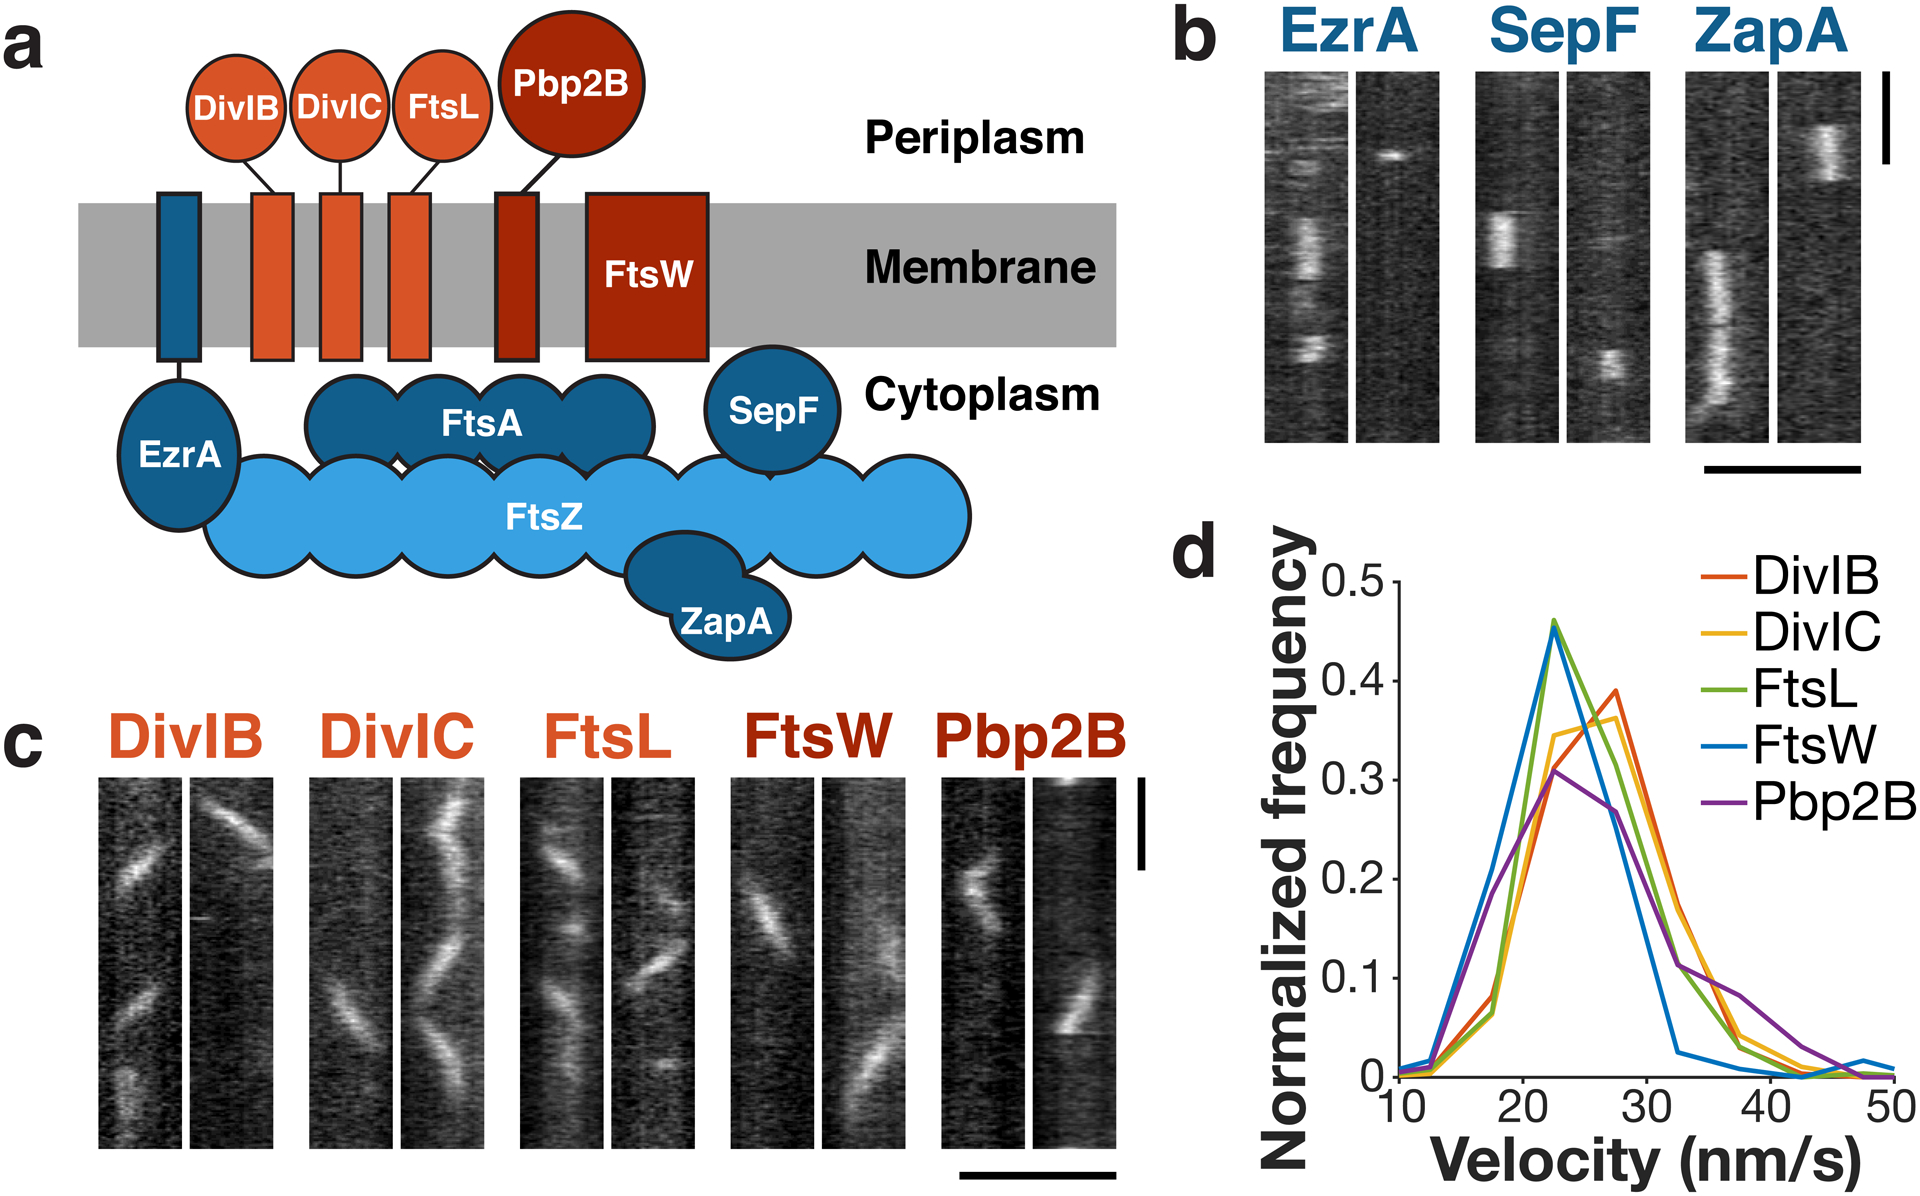
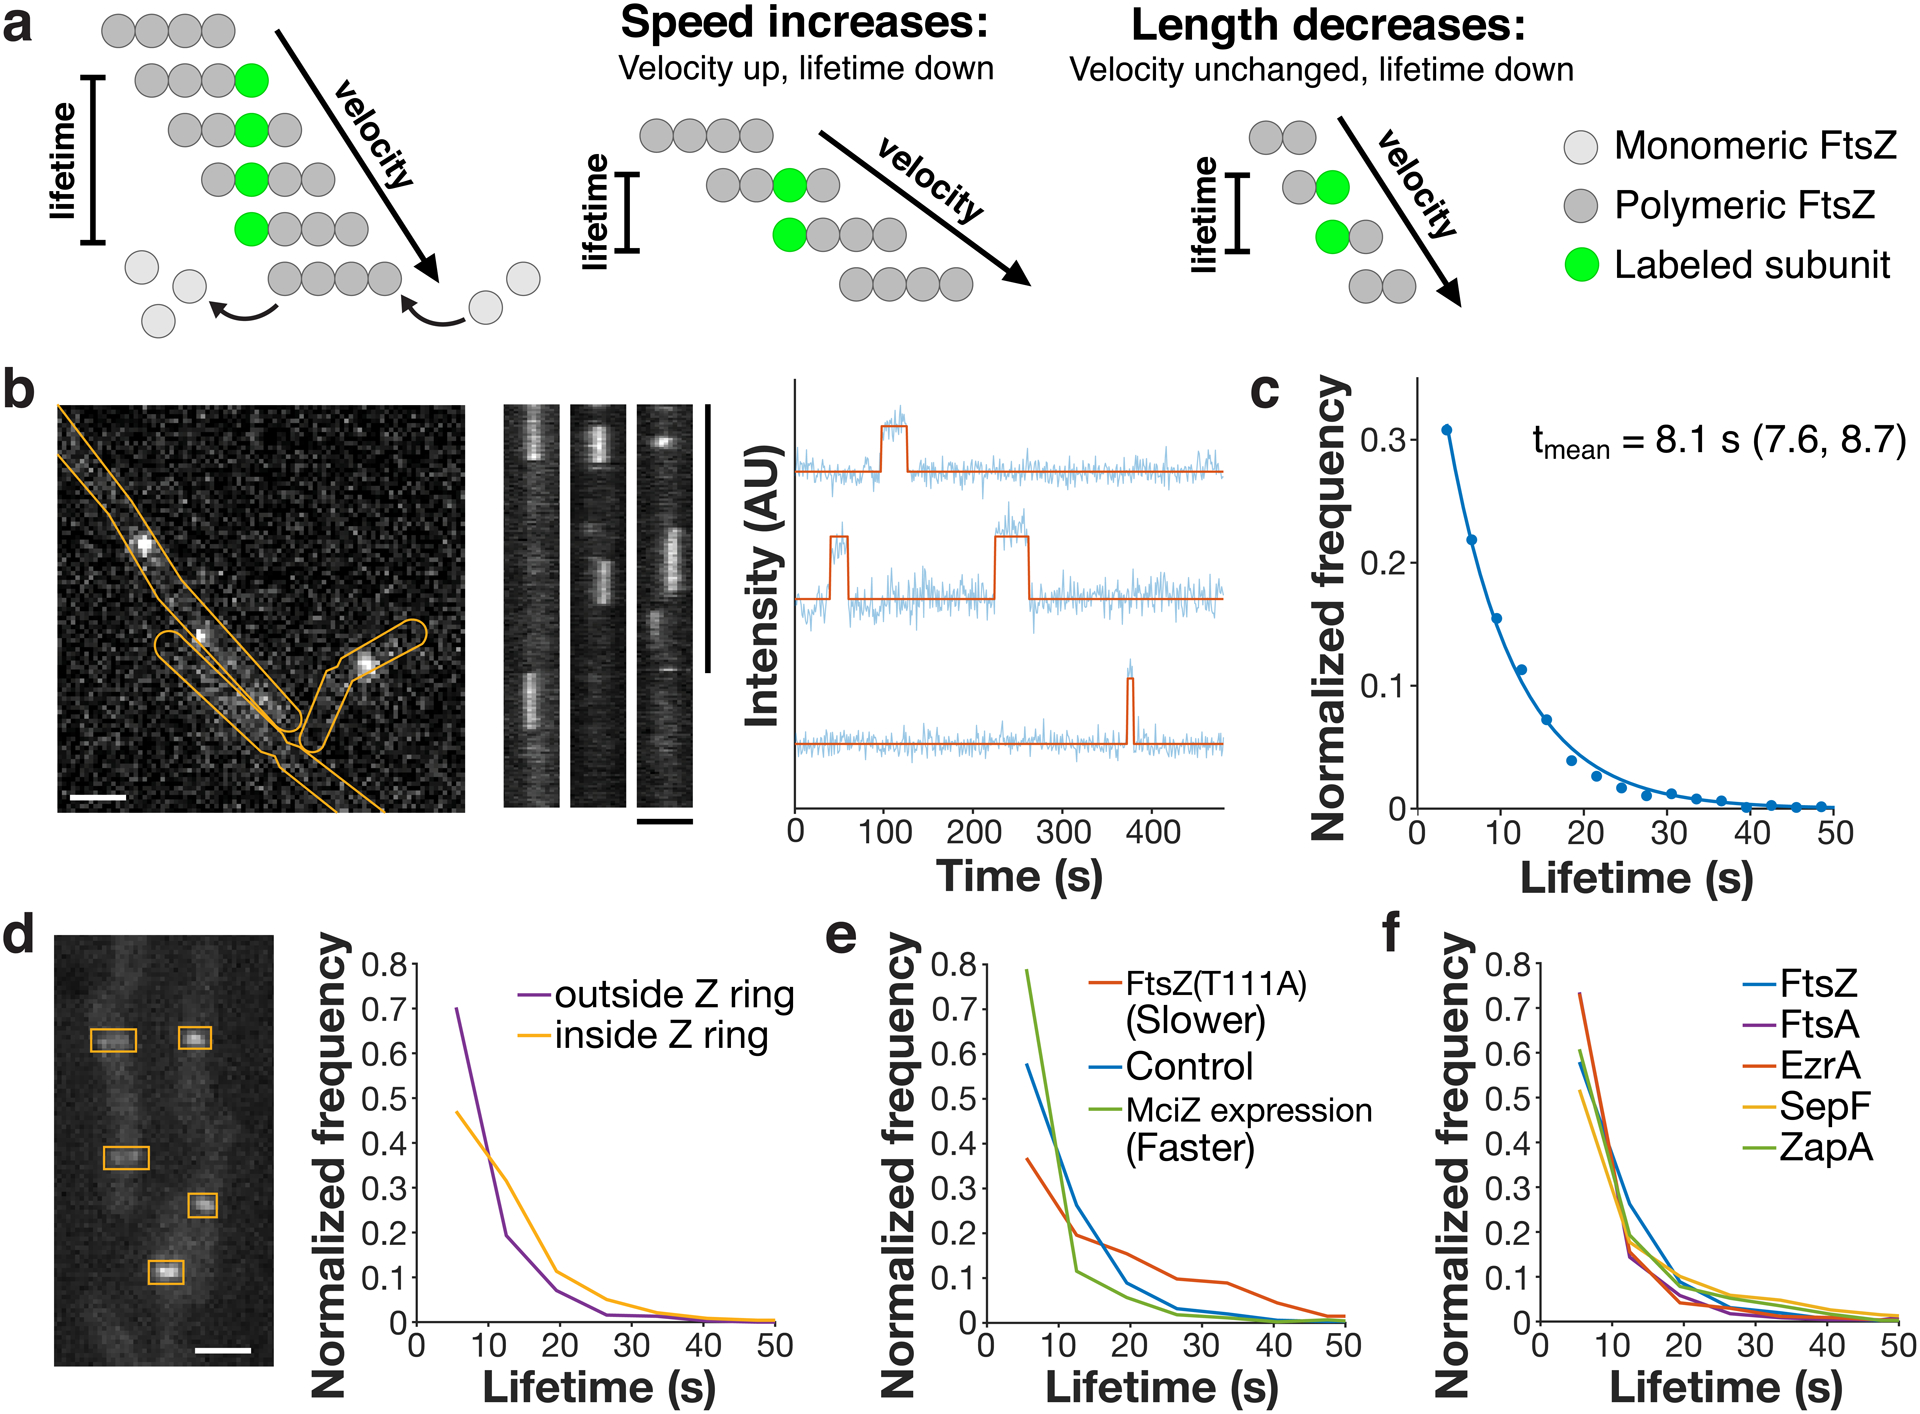
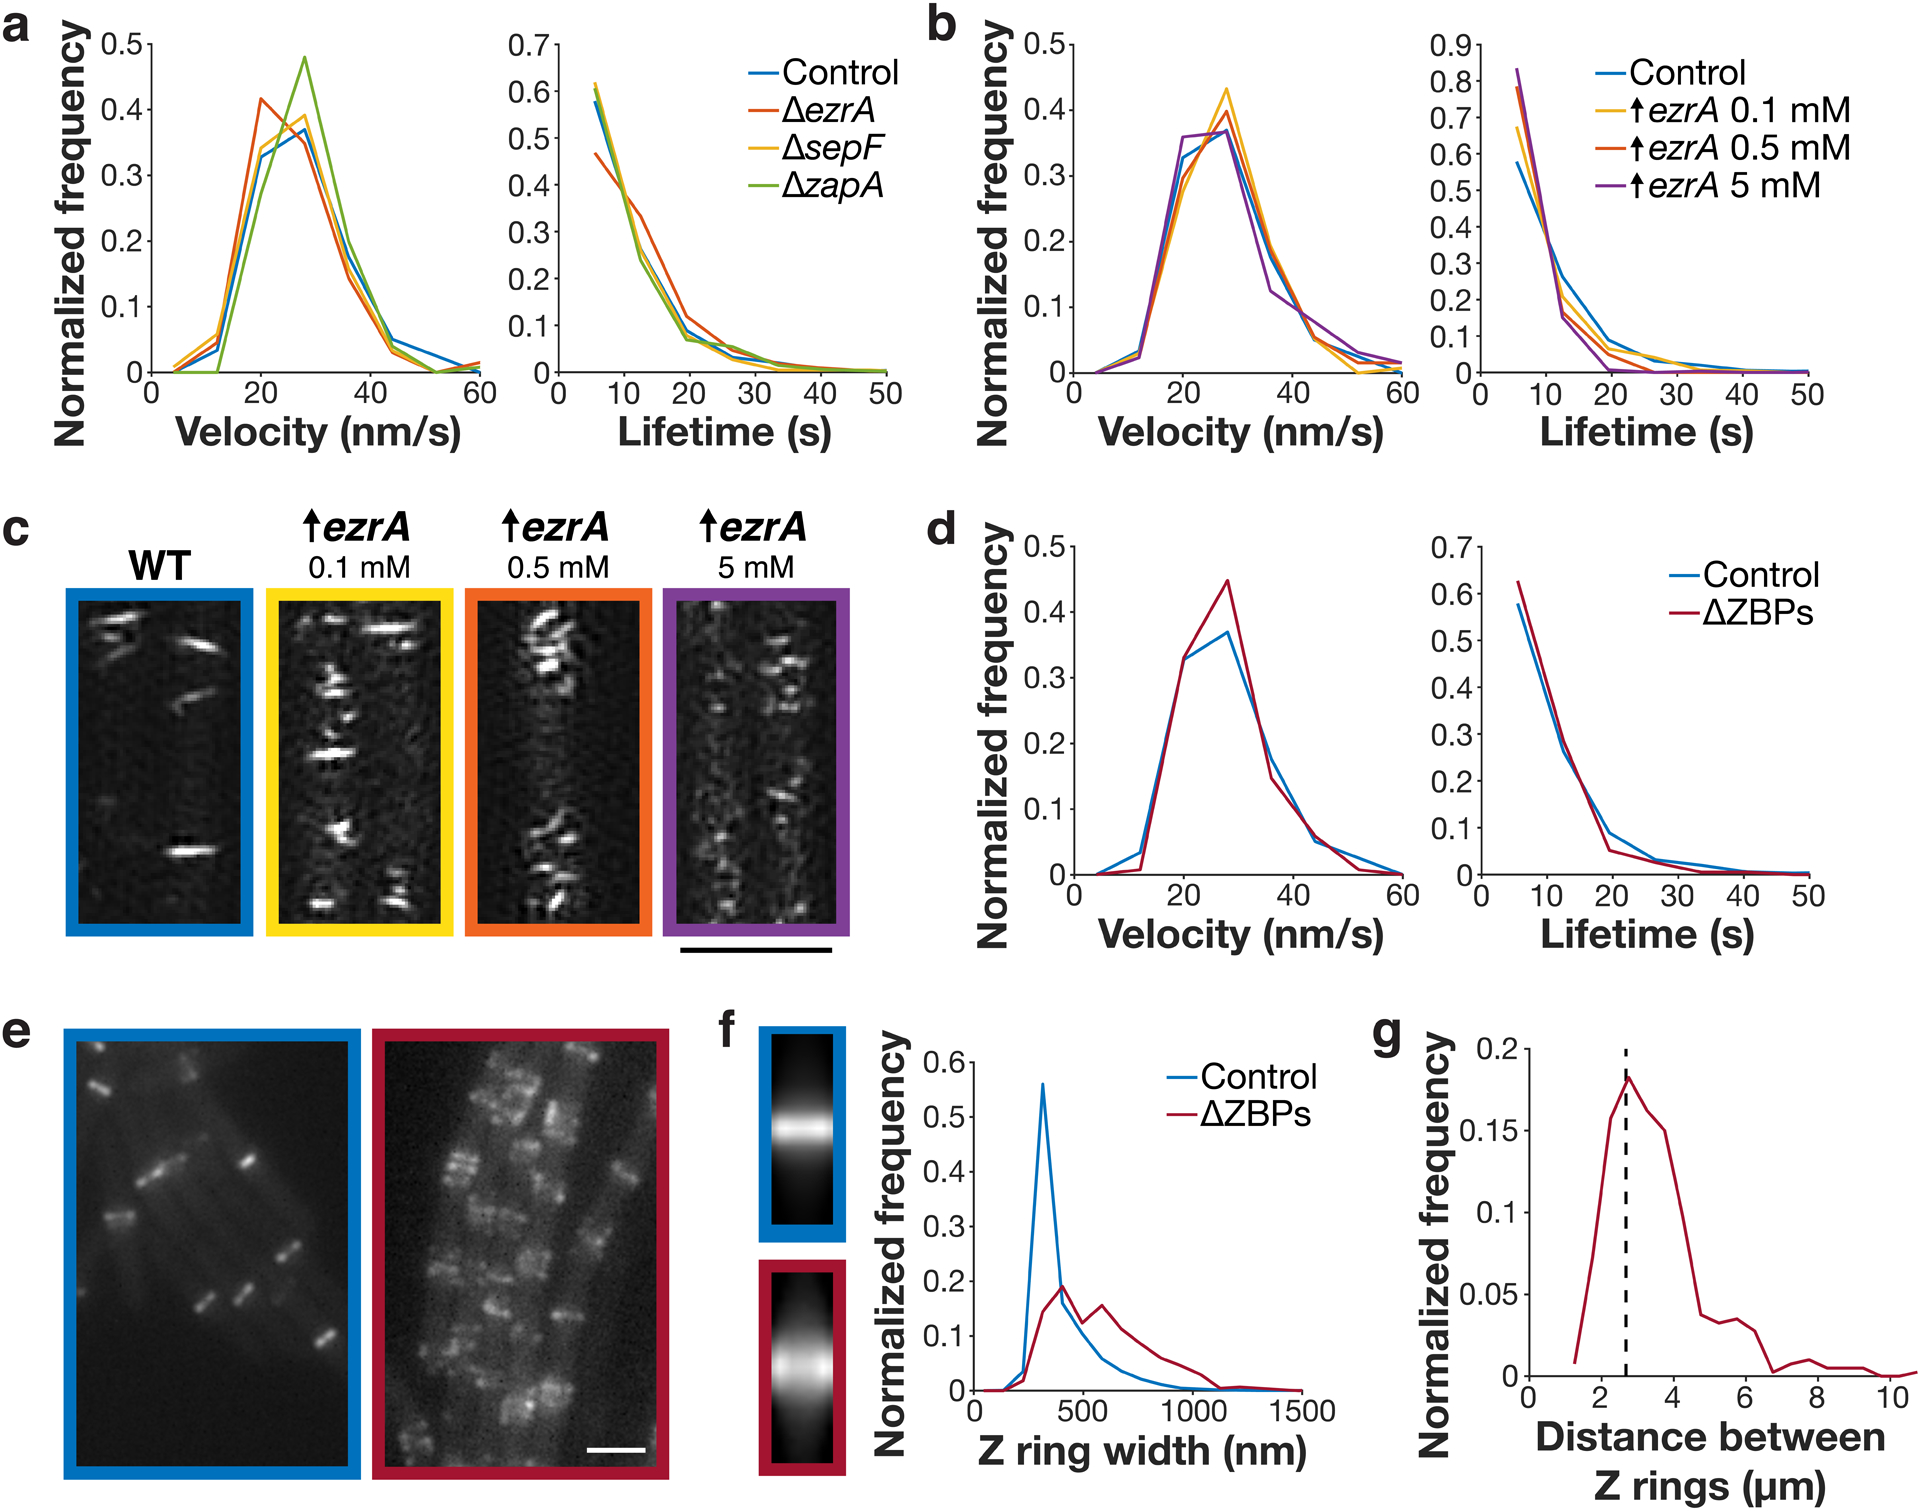
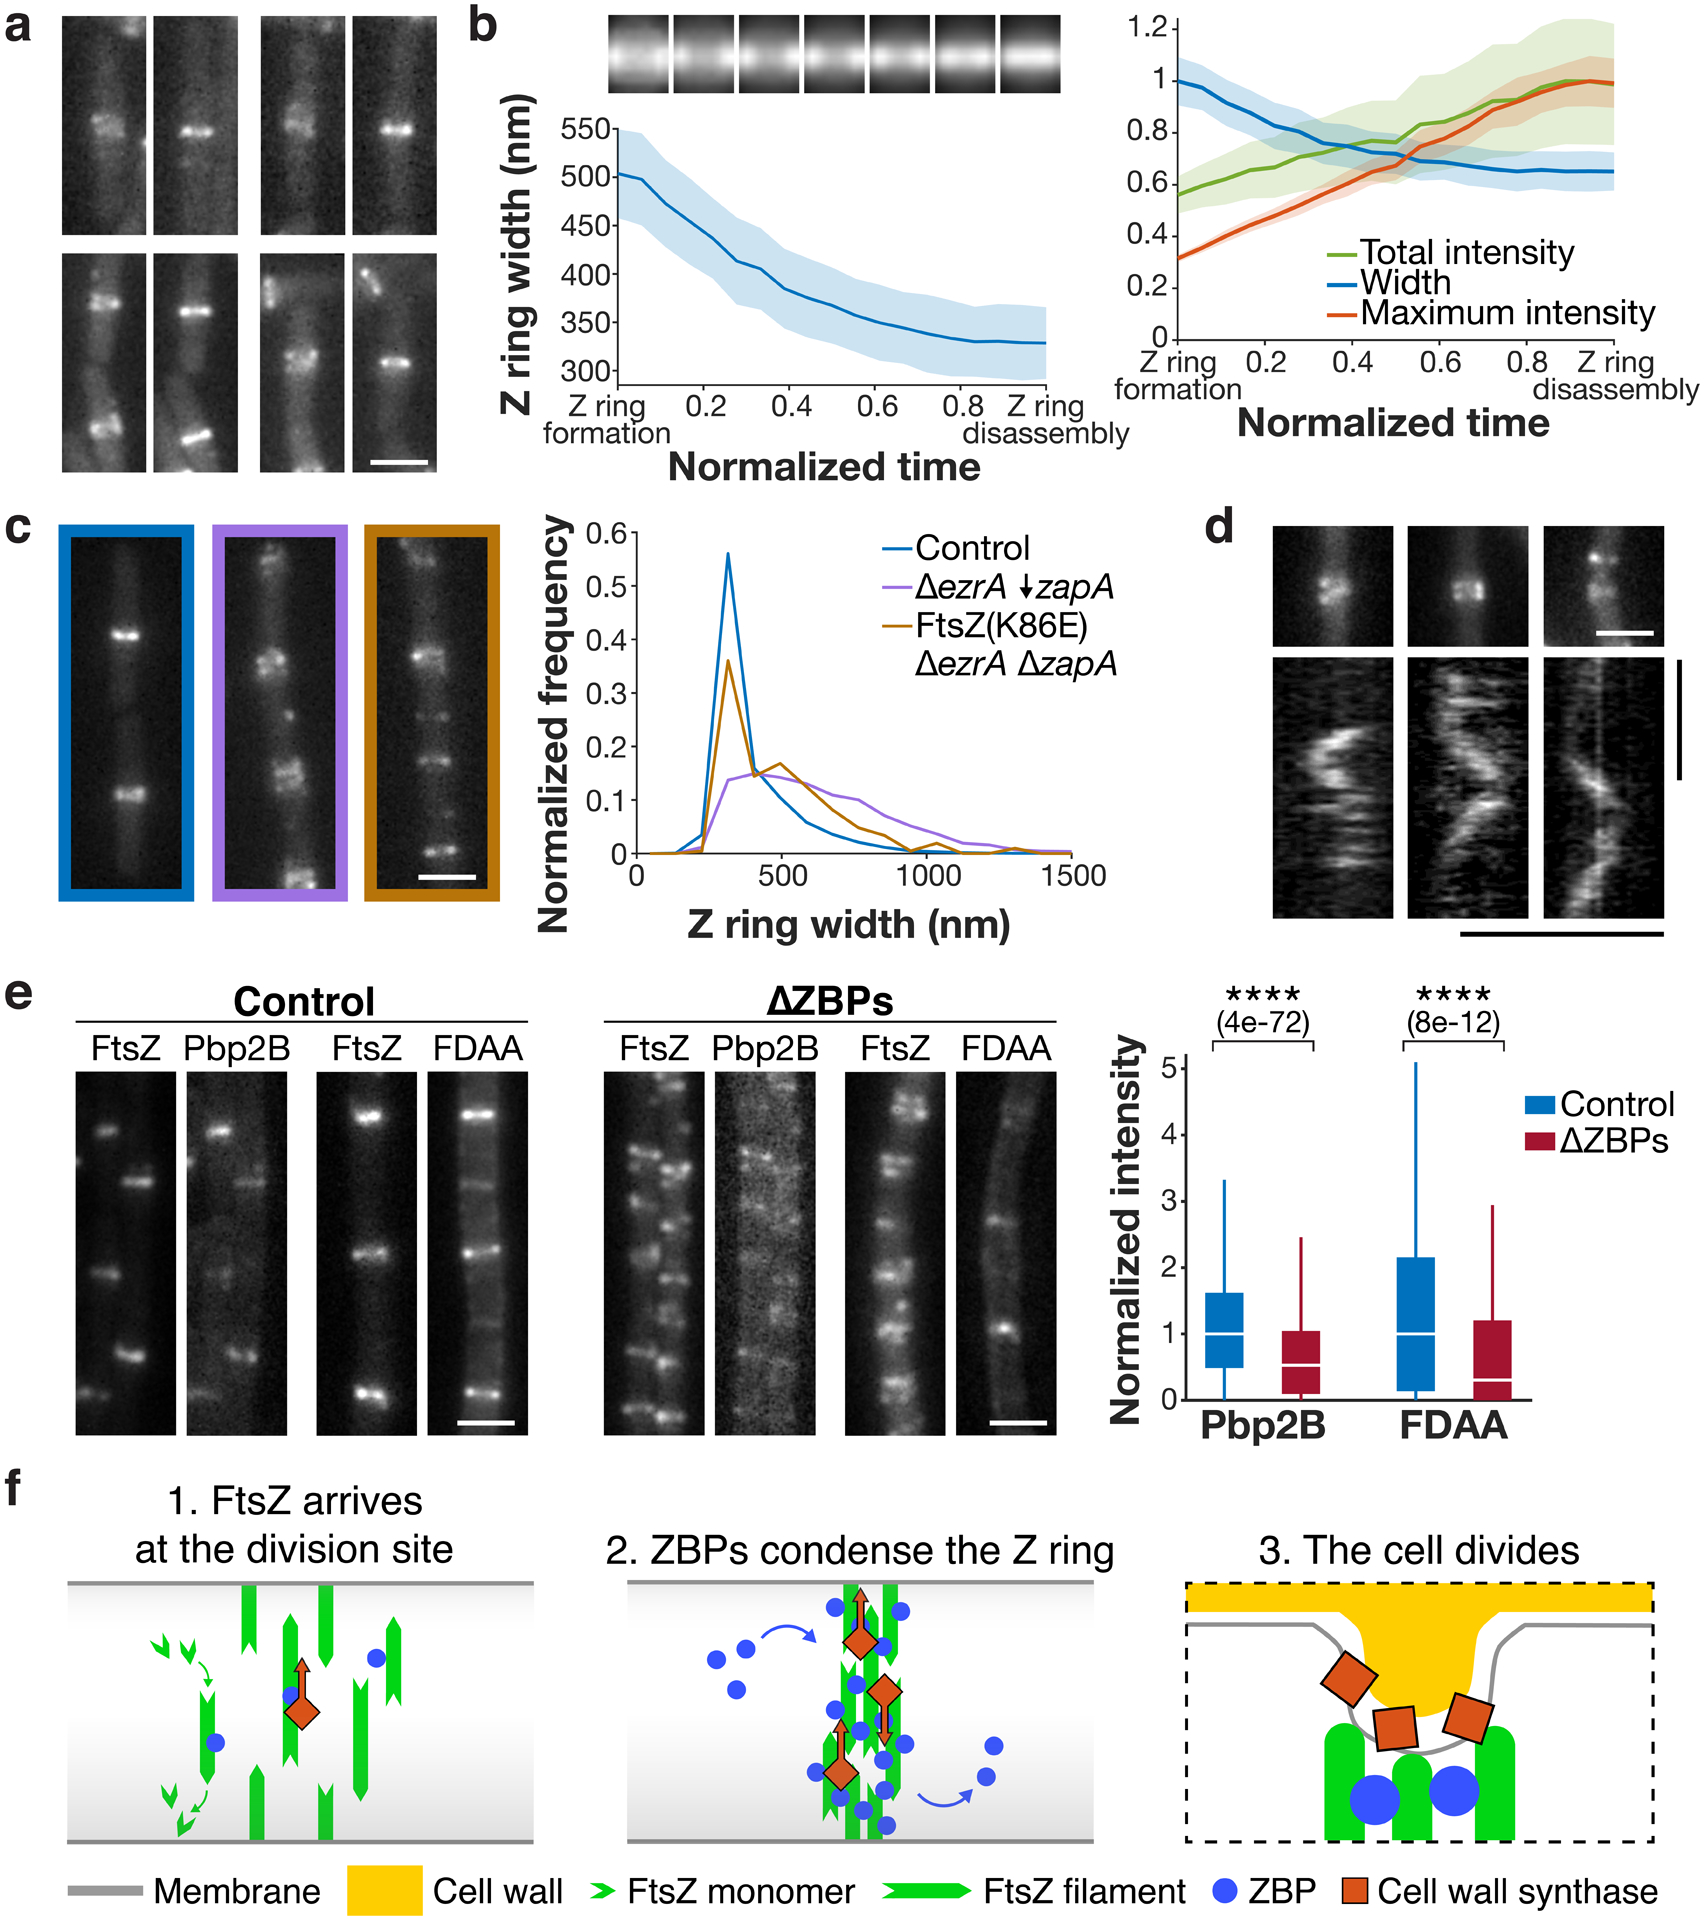
Although many components of the cell division machinery in bacteria have been identified1,2, the mechanisms by which they work together to divide the cell remain poorly understood. Key among these components is the tubulin FtsZ, which forms a Z ring at the midcell. FtsZ recruits the other cell division proteins, collectively called the divisome, and the Z ring constricts as the cell divides. We applied live-cell single-molecule imaging to describe the dynamics of the divisome in detail, and to evaluate the individual roles of FtsZ-binding proteins (ZBPs), specifically FtsA and the ZBPs EzrA, SepF and ZapA, in cytokinesis. We show that the divisome comprises two subcomplexes that move differently: stationary ZBPs that transiently bind to treadmilling FtsZ filaments, and a moving complex that includes cell wall synthases. Our imaging analyses reveal that ZBPs bundle FtsZ filaments together and condense them into Z rings, and that this condensation is necessary for cytokinesis.


Conflict of interest statement

Competing Interests Statement: Authors declare no competing interests.

Figures

Extended Data Fig. 1
Extended Data Fig. 1. Cell lengths with fusions for fluorescence microscopy
a Cell lengths in strains expressing HaloTag (HT) fusions used in this study. (sw) indicates a sandwich fusion. Cell lengths were measured from confocal microscopy of FM5-95 membrane stained cells. When cell division is inhibited, cell length increases; that cell lengths in each strain are equal to or less than that of wild type (WT) cells indicates that these fluorescent fusions do not strongly inhibit cell division. In some cases where the fluorescent fusion is merodiploid or expressed under inducible control, cells are shorter than WT, as might be expected when components of the cell division machinery are overexpressed. Blue: fusions to early-arriving division proteins, red: fusions to late-arriving division proteins. Gray lines: mean (solid line) ± standard deviation (dashed lines) for WT cell lengths. N>400 cells for each sample. b Lengths of cells with various division proteins knocked out, for comparison with a. We include all knockouts whose lengths can be measured in a straightforward way: ΔftsA cells have severe division defects and are highly elongated (see Extended Data Fig. 10), and the remaining division proteins are essential to avoid lethal filamentation. N>140 cells for each sample. c EzrA and ZapA HT fusions are functional and SepF HT fusion expressed at an ectopic site does not disrupt SepF function. EzrA is synthetically lethal with SepF and ZapA,. We therefore knocked out one of these proteins and then expressed our HT fusion to the other protein; if HT fusion induced a critical defect in protein function, this combination will be lethal. Instead, in each case cells remained viable, with comparable lengths to the knockout alone. N>200 cells for each sample.
Extended Data Fig. 2
Extended Data Fig. 2. Controls for FtsZ lifetime measurements
a FtsZ subunit lifetime is consistent across experimental replicates. To measure lifetimes, cells expressing FtsZ-HaloTag were induced with 20 μM IPTG for 2 hours, labelled with 40 pM JF549-HTL, and then imaged by TIRFM. Light curves: 4 experimental replicates for which N>200. Points represent combined data from all experimental replicates (17 replicates). Error bars: weighted standard deviation of distributions for all replicates. b FtsZ subunit lifetime is consistent across measurement techniques. Lifetime distributions were measured using an automated hidden Markov model (HMM) based analysis pipeline and manually for N=265 particles (dashed line). c FtsZ subunit lifetime is not affected by Pbp2B tagging. The 1-colour strain (bAB309) contains labelled FtsZ-HaloTag, induced as a second copy with 20 μM IPTG for 2 hours; the 2-colour strain (bGS104) contain both this FtsZ-HaloTag construct and a native mNeonGreen-Pbp2B fusion, which was used to localize the division site. d FtsZ subunit lifetime is not affected by photobleaching. If the measurements were affected by photobleaching, the measured lifetimes would increase when we decrease the imaging interval; however, we see that the lifetime distributions are consistent for images taken at 0.5-second intervals and 1-second intervals. For images at 0.5-second intervals, images were acquired continuously with 0.5-second exposures. For images at 1-second intervals, images were acquired with the same settings, with 0.5 seconds of exposure and 0.5-second intervals without illumination. e Co-overexpression of FtsA and FtsZ increases the number of FtsZ filaments in the cell (left) but does not change FtsZ subunit lifetime (right). The increased number of filaments that form upon FtsAZ overexpression is consistent with steady-state treadmilling of FtsZ. The fact that the subunit lifetime does not change when FtsAZ is overexpressed further indicates that the additional FtsZ forms new filaments rather than elongating existing filaments. A second copy of ftsAZ is expressed from an IPTG-inducible promoter with 100 μM IPTG for 2 hours. Filament density is visualized by TIRFM for at least two replicates of each condition. Scale bar: 2 μm.
Extended Data Fig. 3
Extended Data Fig. 3. Effects of individual ZBP knockouts on cell and Z ring morphology
Each pair of images shows cell morphology (phase-contrast imaging, left), and Z ring morphology (epifluorescence images of cells expressing FtsZ-mNeonGreen induced with 20 μM IPTG for 2 hours, right) in control cells, compared to cells with individual ZBPs deletions. ΔezrA cells less condensed Z rings, along with the expected Z rings near their poles; ΔsepF and ΔzapA cells have normal Z rings. FtsZ(T111A) mutant cells have excess Z rings and form mini-cells. The distribution of Z ring widths in each strain is plotted at bottom left. Representative images from at least two replicates of each condition. Scale bars: 2 μm.
Extended Data Fig. 4
Extended Data Fig. 4. Effects of ZBP overexpression on FtsZ
a Each pair of images shows cell morphology (phase-contrast imaging, left), and Z ring morphology (epifluorescence images of cells expressing FtsZ-mNeonGreen induced with 20 μM IPTG for 2 hours, right), in cells overexpressing SepF and ZapA. These cells have normal Z ring morphology except for some polar Z rings in SepF-overexpressing cells. Second copies of sepF and zapA were expressed from a xylose-inducible promoter with 30 mM xylose for 2 hours. Representative images from at least two replicates of each condition. Scale bars: 2 μm. b sepF- and zapA-overexpressing cells have similar FtsZ treadmilling velocities (left) and subunit lifetimes (right) to control cells. For velocity measurements, FtsZ-mNeonGreen was induced with 20 μM IPTG for 2 hours, imaged by TIRFM, and analysed from kymographs. For lifetime measurements, FtsZ-HaloTag was induced with 20 μM IPTG for 2 hours and labelled with 40 pM JF549-HTL. c Each pair of images shows cell morphology (phase-contrast imaging, left), and Z ring morphology (epifluorescence images of cells expressing FtsZ-mNeonGreen induced with 20 μM IPTG for 2 hours, right), in control cells and cells with EzrA overexpressed. EzrA-overexpressing cells have perturbed Z ring morphology, as expected, a phenotype exacerbated with increasing induction. A second copy of ezrA was expressed from a xylose-inducible promoter by adding xylose at the indicated mM concentration. The 0.1, 0.5, and 5 mM concentrations were selected for quantitative analysis as the 10 and 20 mM xylose overexpression yielded unstable FtsZ filaments whose lifetimes were too short to be measured accurately. Representative images from at least two replicates of each condition. Scale bars: 2 μm.
Extended Data Fig. 5
Extended Data Fig. 5. Effects of removing synthetically lethal combinations of ZBPs on cell and Z ring morphology
Each pair of images shows cell morphology (phase-contrast imaging, left), and Z ring morphology (epifluorescence images of cells expressing FtsZ-mNeonGreen induced with 20 μM IPTG for 2 hours, right), in control cells and cells lacking synthetically lethal combinations of ZBPs. To achieve this, a combination of knockouts (indicated by Δ) and depletions (indicated by ↓) were used; depletions were performed by expressing each gene under an inducible promoter until the start of the experiment, then withdrawing the inducer for 7 hours. This was repeated for all permutations of synthetically lethal combinations of ZBPs; all of these combinations result in elongated cells and disrupted Z ring architecture. Representative images from at least two replicates of each condition. Scale bars: 2 μm.
Extended Data Fig. 6
Extended Data Fig. 6. Effects of removing synthetically lethal combinations of ZBPs on FtsZ
Velocity, lifetime, and Z ring morphology measurements for cells missing each synthetic lethal combination of ZBPs. All synthetic lethal combinations were investigated by a combination of knockouts (indicated by Δ) and depletions (indicated by ↓); depletions were performed by expressing the gene under an inducible promoter until the start of the experiment, then withdrawing the inducer for 7 hours. a Velocity (left) and lifetime (right) of cells missing synthetically lethal combinations of ZBPs are unchanged from control. For velocity measurements, FtsZ-mNeonGreen was induced with 20 μM IPTG for 2 hours, imaged by TIRFM, and then analysed from kymographs. For lifetime measurements, FtsZ-HaloTag was induced with 20 μM IPTG for 2 hours and labelled with 40 pM JF549-HTL. bc Z rings in cells missing synthetically lethal combinations of ZBPs are wider than control cells and cells missing individual ZBPs. Average intensity projections (b) and widths (c) of Z rings in each condition. Z rings were visualized using epifluorescence images of cells expressing FtsZ-mNeonGreen, induced with 20 μM IPTG for 2 hours. Z ring projections were created by averaging >100 Z ring images for each strain. Because ZBPs can be removed by either knockout or depletion, for each strain we compare to the equivalent single mutant knockouts and depletions.
Extended Data Fig. 7
Extended Data Fig. 7. Effects of a ΔsepF ΔzapA dual knockout
top Each pair of images shows cell morphology (phase-contrast imaging, left), and Z ring morphology (epifluorescence images of cells expressing FtsZ-mNeonGreen induced with 20 μM IPTG for 2 hours, right), in control cells and cells with both sepF and zapA knocked out: ΔsepF ΔzapA is the only combination of ZBP deletions that is not synthetically lethal and their Z ring morphology is normal. Representative images from at least two replicates of each condition. Scale bars: 2 μm. bottom ΔsepF ΔzapA cells have similar FtsZ treadmilling velocities (left), subunit lifetimes (centre), and Z ring widths (right) to control cells. For velocity measurements, FtsZ-mNeonGreen was induced with 20 μM IPTG for 2 hours, imaged by TIRFM, and analysed from kymographs. For lifetime measurements, FtsZ-HaloTag was induced with 20 μM IPTG for 2 hours and labelled with 40 pM JF549-HTL. For Z ring width measurements, FtsZ-mNeonGreen was induced with 20 μM IPTG for 2 hours and imaged by epifluorescence.
Extended Data Fig. 8
Extended Data Fig. 8. Characterization of the FtsZ(K86E) suppressor mutant
a Each pair of images shows cell morphology (phase-contrast imaging, left), and Z ring morphology (epifluorescence images of cells expressing FtsZ-mNeonGreen induced with 20 μM IPTG for 2 hours, right) in FtsZ(K86E) and FtsZ(K86E) ΔezrA ΔzapA cells. FtsZ(K86E) Z rings look similar to the control. Z rings in FtsZ(K86E) ΔezrA ΔzapA are somewhat perturbed, but less so than typical cells missing synthetically lethal combinations of ZBPs; they also have polar Z rings, as is typical for ΔezrA strains. Representative images from at least two replicates of each condition. Scale bars: 2 μm. b FtsZ(K86E) and FtsZ(K86E) ΔezrA ΔzapA have similar FtsZ treadmilling velocities to control (left), and FtsZ(K86E) Z rings are identical in width to control, while FtsZ(K86E) ΔezrA ΔzapA are wider (right). For velocity measurements in each strain, FtsZ-mNeonGreen was induced with 20 μM IPTG for 2 hours, imaged by TIRFM, and analysed from kymographs. For Z ring width measurements, FtsZ-mNeonGreen was induced with 20 μM IPTG for 2 hours and imaged by epifluorescence. c Pbp2B intensity at midcell in FtsZ(K86E) mutant cells. Left: Representative images of Pbp2B in the indicated strains, visualized by epifluorescence imaging of cells expressing Pbp2B-mNeonGreen, from at least 4 replicates of each condition. Right: Pbp2B intensity at the division site in each strain. Although the FtsZ(K86E) restores viability in a ΔezrA ΔzapA strain, it does so without rescuing Pbp2B recruitment to midcell. For each box plot, the white line indicates the median, the box extends to the 25th and 75th percentiles, and the whiskers indicate 1.5x interquartile range. P-values were obtained from a two-sided t-test; ns indicates p > 0.5, **** indicates p<0.0001, and p-values are included in parenthesis. N>5000 division sites for each condition. Scale bars: 2 μm.
Extended Data Fig. 9
Extended Data Fig. 9. Pbp2B localization and FDAA incorporation in ΔZBPs cells
a Z rings (left) and Pbp2B localization (right) (epifluorescence images of cells expressing both Pbp2B-mNeonGreen and FtsZ-HaloTag induced with 20 μM IPTG for 2 hours and labelled with 5 nM JF549-HTL) in control and ΔZBPs cells. White arrows indicate the Z ring positions in each image. Representative images from at least two replicates of each condition. Scale bars: 2 μm. b Z rings and fluorescent D-amino acid (FDAA) incorporation (epifluorescence images of cells labelled with 1 mM fluorescent D-lysine (FDL) for 30 seconds, right) in control and ΔZBPs cells. White arrows indicate the Z ring positions in each image. Representative images from at least 4 replicates of each condition. Scale bars: 2 μm. c Z ring width versus Pbp2B recruitment. Pbp2B intensity at midcell is higher when Z rings are more condensed; this is expected given that Pbp2B recruitment and Z ring condensation both increase over time. N = 2761 Z rings. d Pbp2B directional motion is seen at Z rings of all widths. Z ring width distributions of all Z rings (solid lines) and the Z rings at which Pbp2B moves directionally (dashed lines) for either control cells (left) or ΔZBPs cells (right) are similar. This confirms that the Pbp2B motion seen in ΔZBPs is present at decondensed rings. N>100 Z rings in each distribution. Shaded area: SEM.
Extended Data Fig. 10
Extended Data Fig. 10. FtsA modulates FtsZ dynamics and Z ring formation
a Z ring morphology (epifluorescence images of cells expressing FtsZ-mNeonGreen induced with 30 mM xylose for 2 hours) in control cells and ΔftsA cells. ΔftsA cells have highly altered Z rings. In ΔftsA cells, FtsZ is expressed with 10 μM IPTG from the pHyperSpank promoter; higher or lower expression levels do not allow for cell survival. Representative images from three replicates of each condition. Scale bars: 2 μm. b Distributions of α values for FtsZ motion in control and ΔftsA cells, obtained by tracking FtsZ filament motion and fitting each track to MSD(Δt) = D*Δtα. α > 1 indicates directional motion, so FtsZ filaments in ΔftsA cells exhibit less directional treadmilling compared to control cells. N>6000 tracks for each condition. c Tracks of FtsZ filament motion in control and ΔftsA cells. Tracks with α > 1 are cyan, tracks with α ≤ 1 are magenta. In control cells, FtsZ filaments often treadmill directionally along the short axis of the cell. In ΔftsA cells, directional motion occurs less frequently and follows the short axis of the cell less consistently. Segmented cells are shown in black on a grey background. Scale bars: 2 μm.
Figure 1:
Figure 1:. The divisome consists of two dynamically distinct subcomplexes.
a Schematic of divisome proteins in B. subtilis, with early-arriving proteins in blue and late-arriving proteins in red. Light blue: FtsZ filament, dark blue: FtsZ binding proteins, light red: trimeric complex, dark red: cell wall synthesis enzymes. All blue proteins are stationary, and all red proteins move directionally with the same velocity. b Kymographs of single molecules of stationary ZBPs at division sites, from two replicates for each condition. c Kymographs of single molecules of directionally-moving proteins at division sites, from at least two replicates for each condition. d Velocity distributions of all directionally-moving proteins, measured from kymographs. Scale bars: horizontal: 2 μm, vertical: 1 min.
Figure 2:
Figure 2:. FtsZ lifetime reports treadmilling dynamics in vivo.
a Left: Velocity and lifetime can be measured independently for a treadmilling filament. Velocity is measured by imaging the motion of FtsZ filaments (dark grey circles), whereas lifetime is measured from the dwell time of a single labelled subunit (green circle) in the filament. Centre: If the speed of a FtsZ filament changes, this changes both the measured velocity and lifetime. Right: If the length of a FtsZ filament changes, the lifetime will change, but velocity will not. Thus, lifetime reflects both treadmilling speed and filament length, whereas velocity is insensitive to filament length. b Lifetimes were measured by live-cell single-molecule TIRFM (left) of stationary FtsZ subunits (kymographs, centre). Representative images from 17 replicates. Intensity traces were fit to a hidden Markov model to measure single-molecule lifetimes (right). c FtsZ subunit lifetime distribution, fit to a single exponential f(t) = Aeτt. tmean: mean lifetime and 95% confidence interval, measured from this fit. d Left: mNeonGreen-Pbp2B was imaged by epifluorescence microscopy, and ROIs were drawn around Z rings. Representative image from 4 replicates. Right: Lifetime distributions of FtsZ inside and outside of Z rings, classified by colocalization with ROIs. e FtsZ subunit lifetime distributions in conditions that change treadmilling speed. f Lifetime distributions of FtsZ, FtsA, and the ZBPs. Scale bars: horizontal: 2 μm, vertical: 1 min.
Figure 3:
Figure 3:. The ZBPs affect Z ring morphology but not dynamics.
a FtsZ filament velocity distributions (left) and subunit lifetime distributions (right) in cells with individual ZBPs deleted. b FtsZ filament velocity distributions (left) and subunit lifetime distributions (right) in cells with EzrA overexpressed. c FtsZ filaments in cells overexpressing EzrA, visualized by SIM-TIRF imaging. 4 replicates were obtained for control cells, and one replicate was obtained for each EzrA overexpression condition (4 replicates total). d Left: FtsZ filament velocity distributions (left) and subunit lifetime distributions (right) in cells with all ZBPs removed. ΔZBPs cells had sepF and zapA deleted and ezrA depleted. e Z rings in control (left) and ΔZBPs cells (right), from at least two replicates for each condition. f Left: average intensity projections of Z rings in control and ΔZBPs cells, created by averaging N>400 Z ring images for each strain. Right: Z ring width distributions in control and ΔZBPs cells. g Distances between neighbouring Z rings in ΔZBPs cells. Dashed line: estimated spacing between Z rings in non-dividing B. subtilis cells, based on cell length (see Methods). Scale bars: 2 μm.
Figure 4:
Figure 4:. Z ring condensation is required for cell division.
a Z ring condensation in control cells. Each pair of images shows a newly formed Z ring that has not yet condensed (left), and the same Z ring after condensation (right). Representative images from 4 replicates. b Left: Z ring condensation during the cell cycle. Top: Average intensity projections of Z rings from normalized time points over the cell cycle. Bottom: Z ring width over the cell cycle, measured as the full width at half maximum of the average intensity projections. Time from Z ring formation to Z ring disassembly (defined as the first and last frames in which the Z ring could be detected) was normalized for each cell. Shading: bootstrapped standard error. Right: Z ring width, total intensity, and maximum intensity over the cell cycle, normalized and plotted on the same axis. N = 760 cell cycles. c The FtsZ(K86E) mutant rescues the ΔezrA ΔzapA synthetic lethal condition and partially restores Z ring morphology, as seen in representative Z ring images from at least two replicates each (left) and width distributions (right). ↓ indicates depletion. d Pbp2B dynamics in ΔZBPs. Kymographs were drawn at the Z rings indicated above. 4 replicates were obtained. e Left and centre: Colocalization of Pbp2B with FtsZ and colocalization of FDAA labelling with FtsZ in control cells (left) and ΔZBPs cells (centre), from at least two replicates for each condition. Right: Amount of Pbp2B and FDAA labelling at the division site, measured by fluorescence intensity. N > 1000 for each condition. For each box plot, the white line indicates the median, the box extends to the 25th and 75th percentiles, and the whiskers indicate 1.5x interquartile range. P-values were obtained from a two-sided t-test; **** indicates p<0.0001, and p-values are included in parenthesis. f Left: At the start of the cell division process, FtsZ filaments treadmill around the cell circumference at midcell. Centre: Stationary ZBPs transiently bind to FtsZ filaments to condense the Z ring. Right: ZBP-driven bundling of FtsZ filaments may also function during cytokinesis, where crowding may induce inward membrane deformations, both concentrating cell wall synthesis to the Z ring and orienting it to divide the cell in two. Scale bars: horizontal: 2 μm, vertical: 1 min.

Comment in

  • Keeping division on track.
    den Blaauwen T. den Blaauwen T. Nat Microbiol. 2021 May;6(5):538-539. doi: 10.1038/s41564-021-00891-2. Nat Microbiol. 2021. PMID: 33927383 No abstract available.

Similar articles

Cited by

References

    1. Erickson HP, Anderson DE & Osawa M FtsZ in bacterial cytokinesis: cytoskeleton and force generator all in one. Microbiol. Mol. Biol. Rev 74, 504–528 (2010). - PMC - PubMed
    1. Adams DW & Errington J Bacterial cell division: assembly, maintenance and disassembly of the Z ring. Nature Publishing Group 7, 642–653 (2009). - PubMed
    1. Gamba P, Veening J-W, Saunders NJ, Hamoen LW & Daniel RA Two-step assembly dynamics of the Bacillus subtilis divisome. J. Bacteriol 191, 4186–4194 (2009). - PMC - PubMed
    1. Meier EL & Goley ED Form and function of the bacterial cytokinetic ring. Curr. Opin. Cell Biol 26, 19–27 (2014). - PubMed
    1. Bisson-Filho AW et al. Treadmilling by FtsZ filaments drives peptidoglycan synthesis and bacterial cell division. Science 355, 739–743 (2017). - PMC - PubMed

Publication types

MeSH terms