. 2021 Apr;27(4):677-687.
doi: 10.1038/s41591-021-01284-y. Epub 2021 Mar 18.

Gene replacement of α-globin with β-globin restores hemoglobin balance in β-thalassemia-derived hematopoietic stem and progenitor cells

Affiliations

Gene replacement of α-globin with β-globin restores hemoglobin balance in β-thalassemia-derived hematopoietic stem and progenitor cells

M Kyle Cromer et al. Nat Med. 2021 Apr.

Abstract

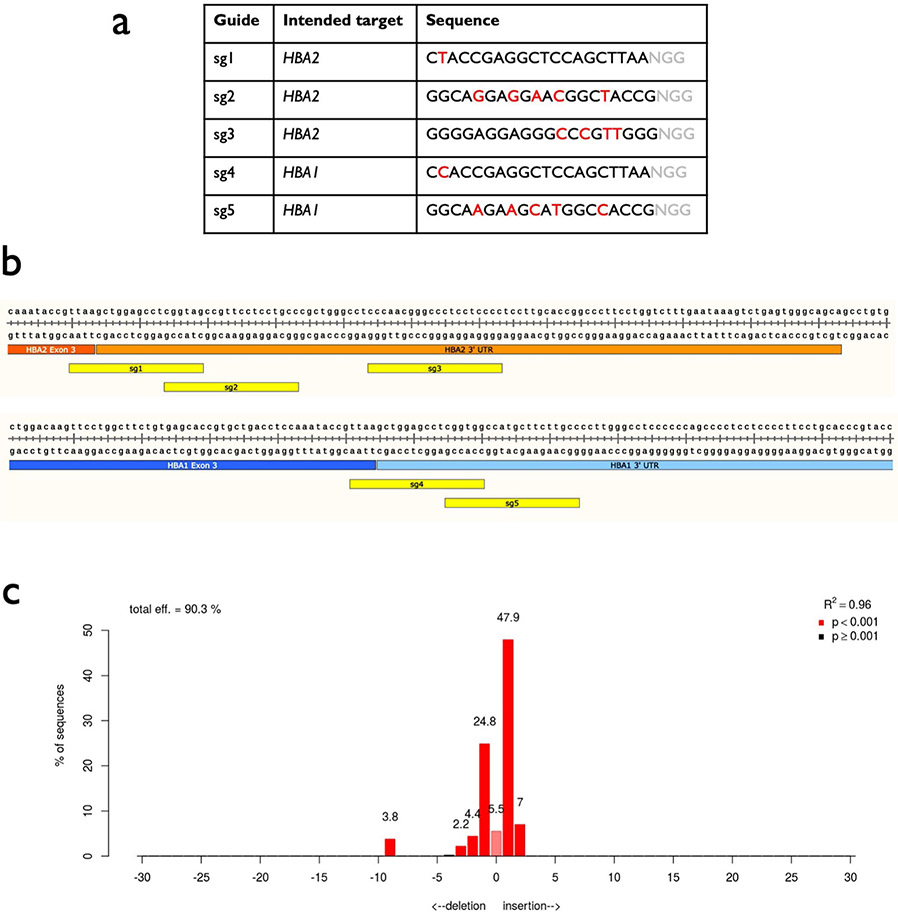
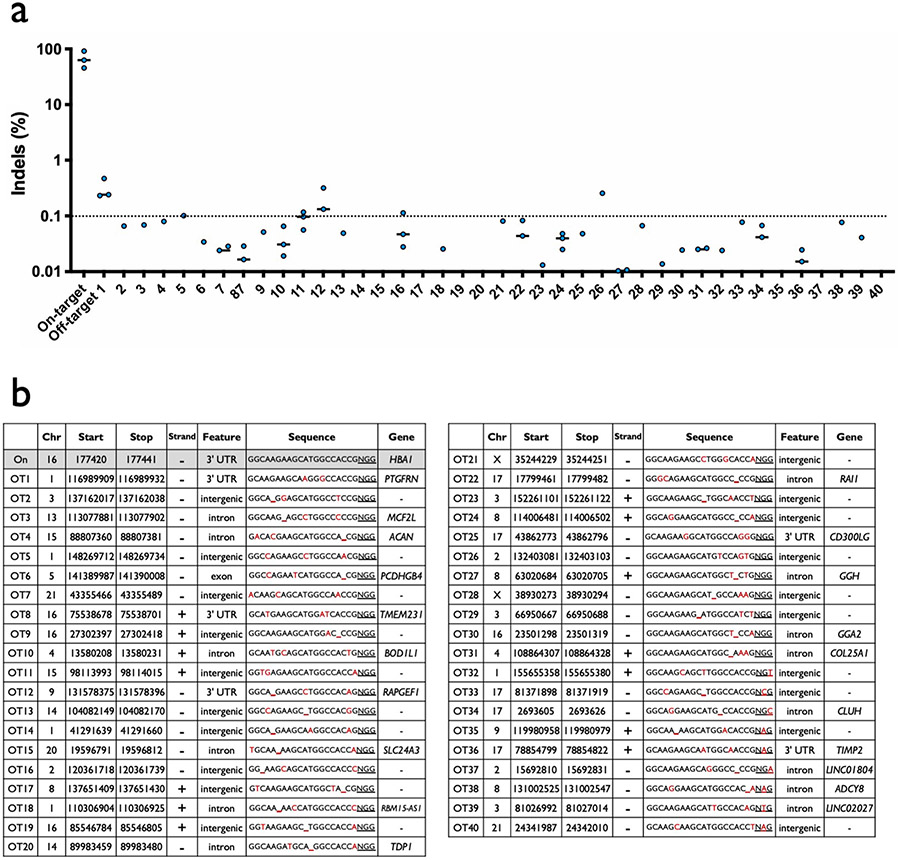
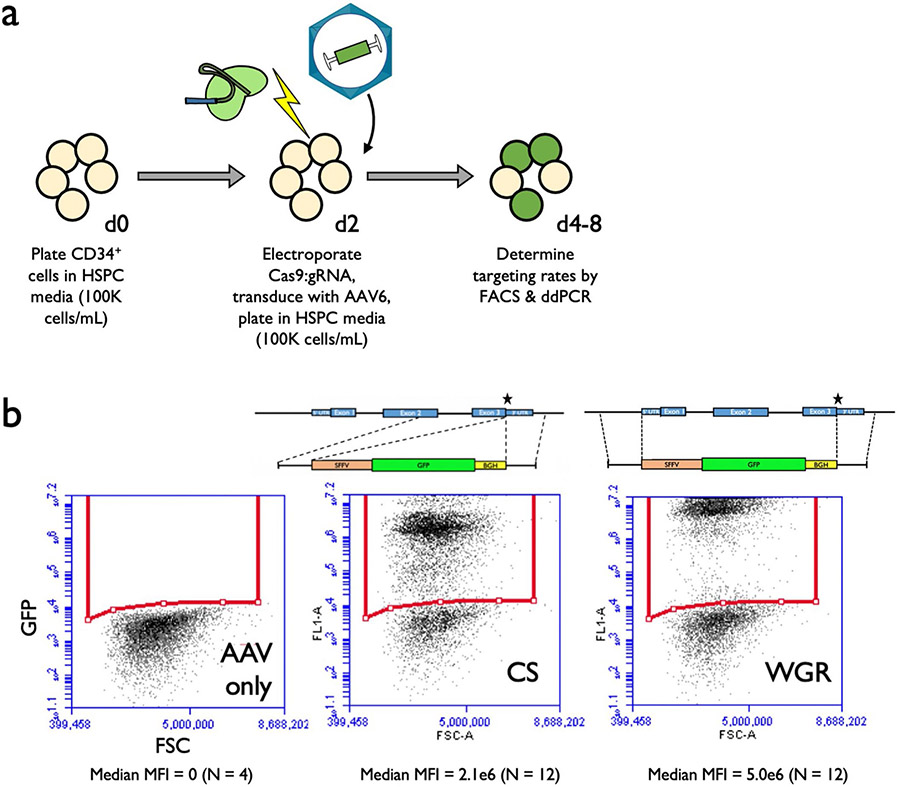
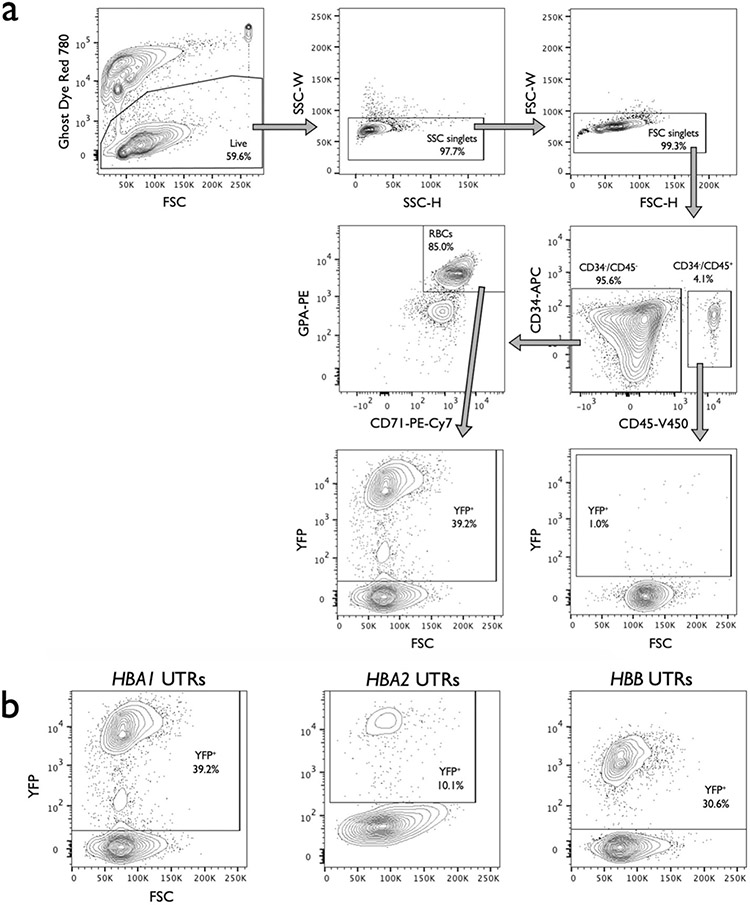
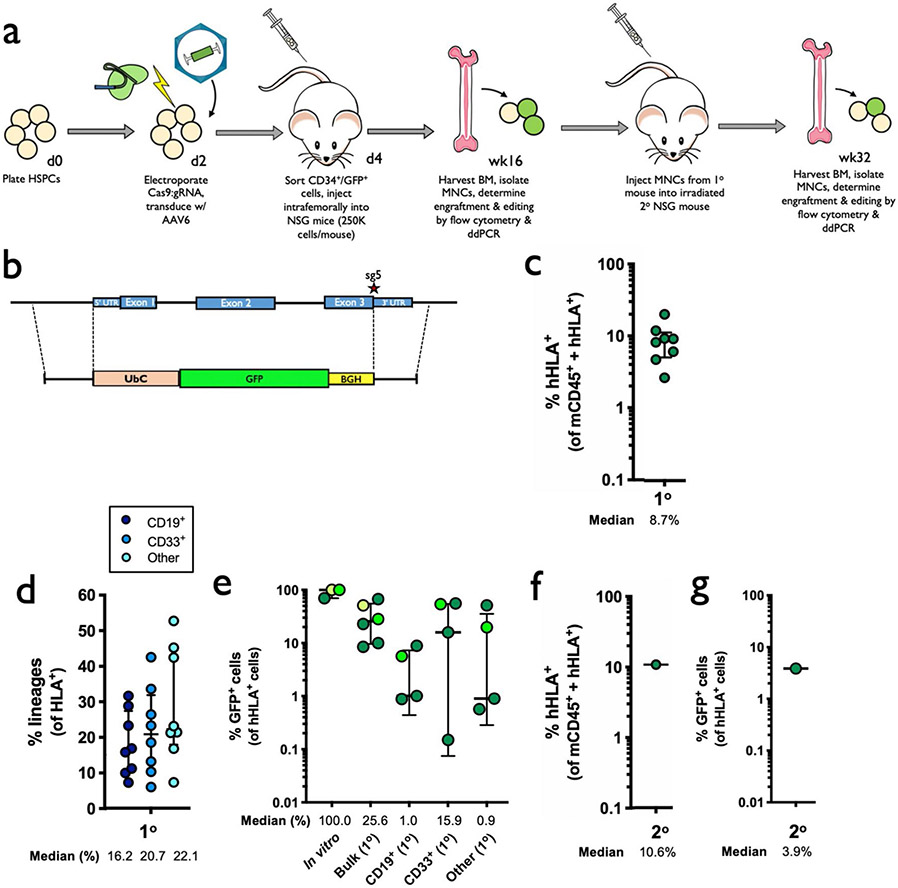
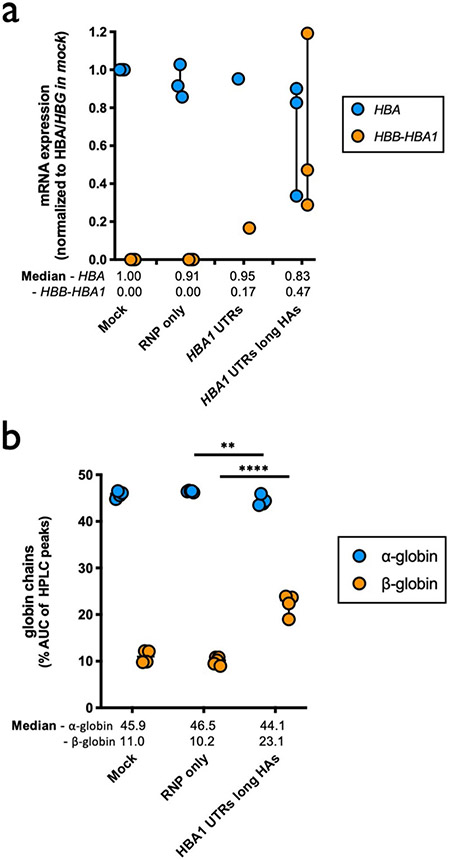
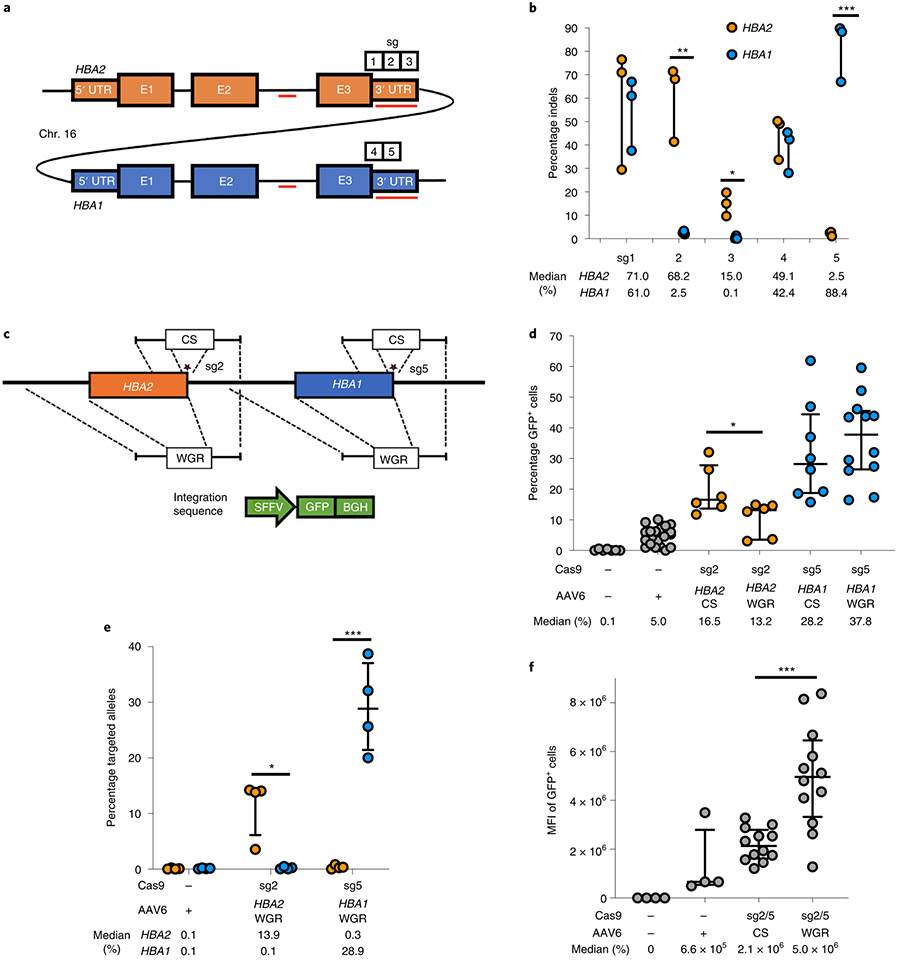
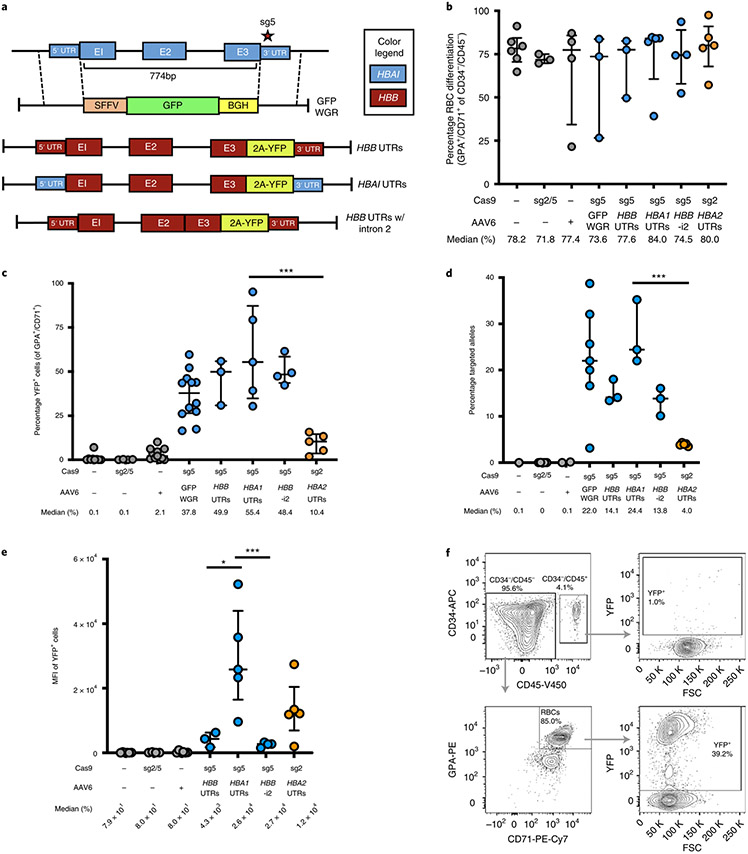
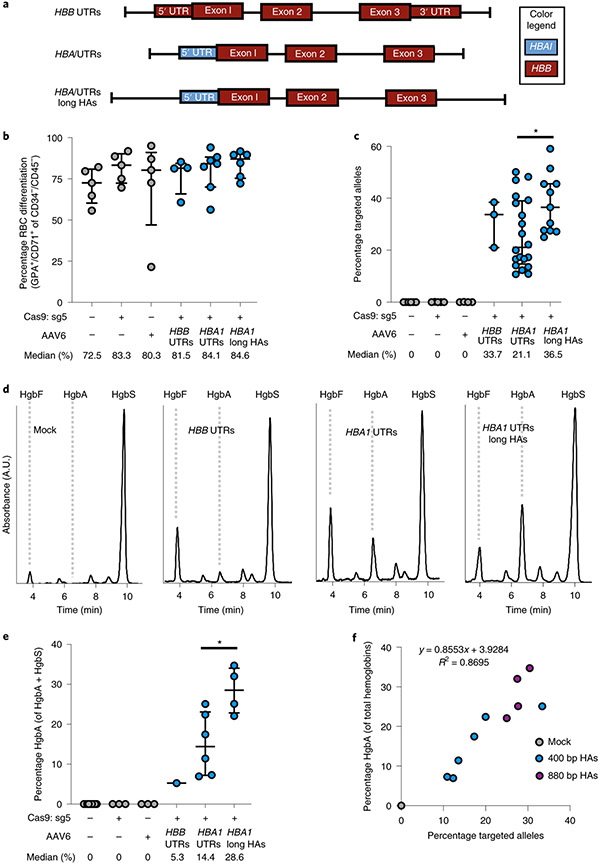
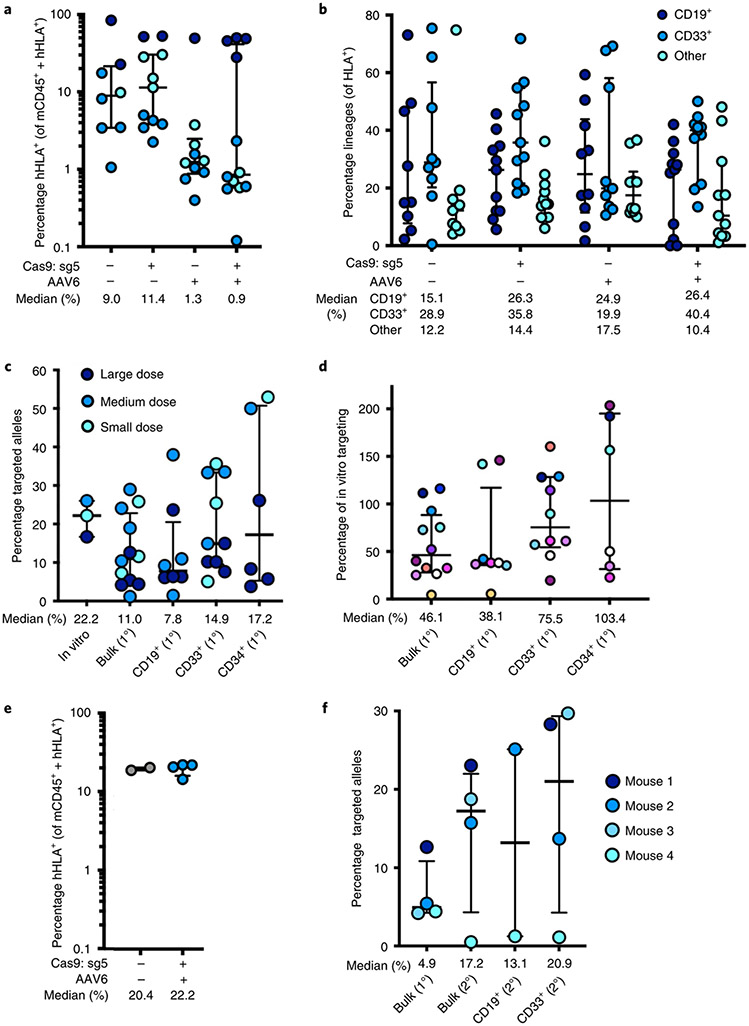
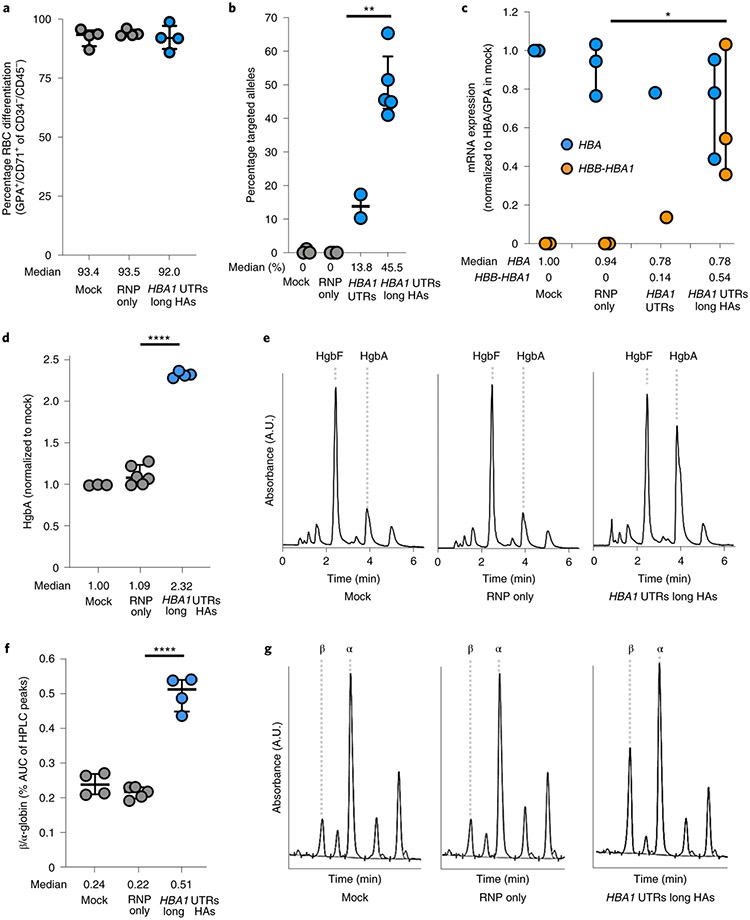
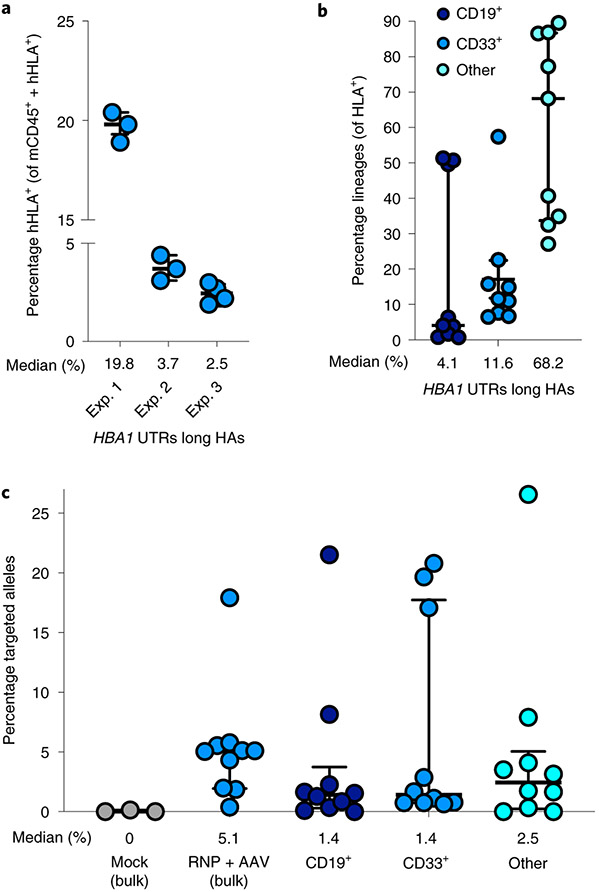
β-Thalassemia pathology is due not only to loss of β-globin (HBB), but also to erythrotoxic accumulation and aggregation of the β-globin-binding partner, α-globin (HBA1/2). Here we describe a Cas9/AAV6-mediated genome editing strategy that can replace the entire HBA1 gene with a full-length HBB transgene in β-thalassemia-derived hematopoietic stem and progenitor cells (HSPCs), which is sufficient to normalize β-globin:α-globin messenger RNA and protein ratios and restore functional adult hemoglobin tetramers in patient-derived red blood cells. Edited HSPCs were capable of long-term and bilineage hematopoietic reconstitution in mice, establishing proof of concept for replacement of HBA1 with HBB as a novel therapeutic strategy for curing β-thalassemia.


Figures

Extended Data Fig. 1 ∣
Extended Data Fig. 1 ∣. Analysis of Cas9 sgRNAs targeting α-globin loci.
a, Table with guide RNA sequences. PAM shown in grey, and differences between HBA1 and HBA2 are highlighted in red for each guide. b, Schematic depicting locations of all five guide sequences at genomic loci. c, Representative indel spectrum of HBA1-specific sg5 generated by TIDE software.
Extended Data Fig. 2 ∣
Extended Data Fig. 2 ∣. Off-target analysis of HBA1-specific sg5.
a, Summary of rhAmpSeq targeted sequencing results at on-target and 40 most highly predicted off-target sites by COSMID for HBA1 sg5. Values are indel frequency for RNP treatment after subtraction of indel frequency for Mock treatment at each locus for each experimental replicate. N = 3 biologically independent HSPC donors, though not all values are displayed since some were <0.01% after subtraction of Mock indel frequencies. Bars represent median. b, List of genomic coordinates for forty most highly predicted off-target sites by COSMID for HBA1 sg5.
Extended Data Fig. 3 ∣
Extended Data Fig. 3 ∣. Targeting α-globin with GFP integration vectors.
a, Timeline for editing and analysis of HSPCs targeted with SFFV-GFP integration vectors. b, Depicted are representative flow cytometry images for human HSPCs 14d post-editing. This indicates that WGR integration yields a greater MFI per GFP+ cell than CS integration at the HBA1 locus. Analysis was performed on BD Accuri C6 platform. Median MFI across all replicates is shown below each flow cytometry image, and schematics of integration vectors are shown above.
Extended Data Fig. 4 ∣
Extended Data Fig. 4 ∣. Staining and gating scheme used to analyze editing and differentiation rates of RBCs.
a, Representative flow cytometry staining and gating scheme for human HSPCs targeted at HBA1 with HBB-T2A-YFP (HBA1 UTRs) and differentiated into RBCs. This indicates that only RBCs (CD34/CD45/CD71+/GPA+) are able to express the promoterless YFP marker. Analysis was performed on BD FACS Aria II platform. b, Representative flow cytometry images of RBCs (CD34/CD45/CD71+/GPA+) derived from HSPCs targeted with HBA1 UTRs, HBA2 UTRs, and HBB UTRs vector. AAV only controls were used for each vector to establish gating scheme, leading to slight variation in positive/negative cut-offs across images.
Extended Data Fig. 5 ∣
Extended Data Fig. 5 ∣. Viability of HSPCs post-editing.
HSPC viability was quantified 2-4d post-editing by flow cytometry. Depicted are the percentage of cells that stained negative for GhostRed viability dye. All cells were edited with our optimized HBB WGR vector using standard conditions (that is electroporation of Cas9 RNP + sg5, 5 K MOI of AAV, and no AAV wash at 24 h). Bars represent median ± interquartile range. WT: N = 5 for mock, N = 3 for RNP only, N = 1 for AAV only, and N = 6 for RNP + AAV treatment group; SCD: N = 2 for each treatment group with exception of RNP + AAV with N = 4; β-thal: N = 3 for mock, N = 1 for RNP only, and N = 7 for RNP + AAV treatment group.
Extended Data Fig. 6 ∣
Extended Data Fig. 6 ∣. Relationship between % edited alleles and % edited cells.
a, Representative flow cytometry plots of HSPCs simultaneously targeted at HBA1 with GFP (shown in Fig. 1c) and mPlum integration cassettes. b, Table showing % of populations targeted with GFP only, mPlum only, and both colors. Percent of edited cells was then converted to % edited alleles by the following equation: (total % targeted cells + (% dual color)*2)/2 = total % targeted alleles. c, Percent edited cells is plotted against % edited alleles for data shown in panel B. A polynomial regression (R2 = 0.9981) was used to determine an equation to convert between % edited alleles and % edited cells.
Extended Data Fig. 7 ∣
Extended Data Fig. 7 ∣. Colony-forming ability of edited HSPCs.
a, Distribution of genotypes of methylcellulose colonies displayed in Panels B and D. Numbers of clones corresponding to each category are included in the pie chart. b, In vitro (pre-engraftment) live CD34+ HSPCs from healthy donors were single-cell sorted into 96-well plates containing semisolid methylcellulose media for colony forming assays. 14d post-sorting cells were analyzed for morphology. Depicted are number of colonies formed for each lineage (CFU-E = erythroid lineage; CFU-GEMM = multi-lineage; or CFU-GM = granulocyte/macrophage lineage) divided by the total number of wells available for colonies. Columns represent median ± interquartile range. N = 3 experimental replicates with a minimum of 3 96-well methylcellulose-coated plates for mock, RNP only, and WGR-GFP AAV6 treatment groups; N = 2 for AAV only and HBB-HBA1 AAV6 treatment groups. c, Percent distribution of each lineage among all colonies for each treatment for Panel B. d, As above, in vitro (pre-engraftment) live CD34+ β-thalassemia HSPCs were sorted into 96-well plates for colony forming assays. Depicted are number of colonies formed for each lineage (B = BFU-E and C = CFU-E (erythroid lineage); GE = CFU-GEMM (multi-lineage); or GM = CFU-GM (granulocyte/macrophage lineage)) divided by the total number of wells available for colonies. Columns represent median ± interquartile range. For Mock and RNP + AAV, N = 2 experimental replicates with a minimum of 3 96-well methylcellulose-coated plates for each treatment; N = 1 experimental replicate with 3 plates for RNP only treatment. e, Percent distribution of each lineage among all colonies for each treatment for Panel D.
Extended Data Fig. 8 ∣
Extended Data Fig. 8 ∣. Engraftment into NSG mice of human HSPCs targeted with GFP at α-globin locus.
a, Timeline for targeting of HSPCs with UbC-GFP integration vector, transplantation into mice (both 1° and 2° engraftment), and subsequent analysis. b, AAV6 DNA repair donor design schematic to introduce a UbC-GFP-BGH integration is depicted at the HBA1 locus. c, 16 weeks after bone marrow transplantation of targeted human CD34+ HSPCs into NSG mice, bone marrow was harvested and rates of engraftment were determined (1°). Depicted is the percentage of mTerr119 cells (non-RBCs) that were hHLA+ from the total number of cells that were either mCd45+ or hHLA+. Bars represent median ± interquartile range. N = 8 biologically independent NSG mouse transplantations. d, Among engrafted human cells, the distribution among CD19+ (B-cell), CD33+ (myeloid), or other (that is HSPC/RBC/T/NK/Pre-B) lineages are indicated. Bars represent median ± interquartile range. N = 8 biologically independent NSG mouse transplantations. e, Percentage of GFP+ cells among pre-transplantation (in vitro, post-sorting) and successfully engrafted populations, both bulk HSPCs and among lineages. Bars represent median ± interquartile range. N = 3 independent HSPC donors from in vitro experiments that were transplanted into N = 6 individual NSG mice, from which N = 4 individual mice were lineage sorted and analyzed. Various green shades correspond to each particular HSPC donor. b, Following primary engraftments, engrafted human cells were transplanted a second time into the bone marrow of NSG mice. 16 weeks post-transplantation, bone marrow was harvested and rates of engraftment were determined (2°). Depicted is the percentage of mTerr119 cells (nonRBCs) that were hHLA+ from the total number of cells that were either mCd45+ or hHLA+. N = 1 NSG mouse transplantation. g, Percentage of GFP+ cells among successfully engrafted population from the secondary transplant depicted in Panel F. N = 1 NSG mouse transplantation.
Extended Data Fig. 9 ∣
Extended Data Fig. 9 ∣. Characterization of targeted β-thalassemia HSPCs.
a, Following differentiation of targeted HSPCs into RBCs, mRNA was harvested and converted into cDNA. Expression of HBA (does not distinguish between HBA1 and HBA2) and HBB transgene were normalized to HBG expression. Bars represent median ± interquartile range. N = 3 biologically independent editing experiments for all treatment groups with exception of HBA1 UTRs with N = 1. b, Summary of reverse-phase globin chain HPLC results showing % AUC of β-globin and α-globin. Bars represent median ± interquartile range. Bars represent median ± interquartile range. N = 3 biologically independent erythroid differentiation experiments for all treatment groups with exception of RNP only with N = 5. **P < 0.005; ***P < 0.0001 using unpaired two-tailed t test without adjustment for multiple comparisons.
Fig. 1 ∣
Fig. 1 ∣. sgRNA and AAV6 design for editing at the α-globin locus.
a, Schematic of HBA2 and HBA1 gDNA. Sequence differences between the two genes are depicted as red lines. Locations of the five prospective sgRNAs are indicated. b, Indel frequencies for each guide at HBA2 and HBA1 in human CD34+ HSPCs are depicted in orange and blue, respectively. Bars represent median ± interquartile range. n = 3 for each treatment group. *P = 0.0083, **P = 0.0037, ***P = 0.00042 by unpaired two-tailed t-test. c, AAV6 DNA repair donor design schematics for the introduction of a SFFV-GFP-BGH integration are depicted at HBA2 and HBA1 loci. Stars denote Cas9 cleavage sites for sg2 and sg5 within HBA2 and HBA1, respectively. d, Percentage of GFP+ cells using HBA2- and HBA1-specific guides and CS and WGR GFP integration donors, as determined by flow cytometry. Bars represent median ± interquartile range. Values represent biologically independent HSPC donors: n = 7 for mock, n = 20 for AAV only, n = 6 for HBA2-editing vectors, n = 8 for HBA1 CS vector and n = 12 for HBA1 WGR vector. *P = 0.042 by unpaired two-tailed t-test. e, Targeted allele frequency at HBA2 and HBA1 by ddPCR for determination of whether off-target integration occurs at the unintended gene. Bars represent median ± interquartile range. n = 4 biologically independent HSPC donors for each treatment group. *P = 0.0052, ***P = 0.00039 by unpaired two-tailed t-test. f, MFI of GFP+ cells across each targeting event as determined by the BD FACS Aria II platform. Bars represent median ± interquartile range. n = 4 biologically independent HSPC donors for mock and AAV-only treatments, and n = 12 for CS and WGR treatment groups. ***P = 0.00026 by unpaired two-tailed t-test. E1–3, exons 1–3.
Fig. 2 ∣
Fig. 2 ∣. WGR of α-globin using a promoterless reporter.
a, AAV6 donor design for integration of HBB-T2A-YFP at the HBA1 locus. b, Percentage of CD34/CD45 HSPCs acquiring RBC surface markers—GPA and CD71—as determined by flow cytometry. Bars represent median ± interquartile range. Values represent biologically independent HSPC donors: n = 6 for mock; n = 3 for RNP only, GFP WGR and HBB UTRs; n = 4 for AAV only and HBB UTRs without intron 2 (HBB-i2); and n = 5 for HBA1 UTRs and HBA2 UTRs. c, Percentage of GFP+ cells as determined by flow cytometry. Bars represent median ± interquartile range. Values represent biologically independent HSPC donors: n = 9 for mock; n = 4 for RNP only and HBB UTRs without intron 2; n = 11 for AAV only; n = 12 for GFP WGR; n = 3 for HBB UTRs; and n = 5 for HBA1 and HBA2 UTRs. ***P = 0.0035 by unpaired two-tailed t-test. d, Targeted allele frequency in bulk edited population as determined by ddPCR. Bars represent median ± interquartile range. Values represent biologically independent HSPC donors: n = 1 for mock; n = 5 for RNP only; n = 2 for AAV only; n = 7 for GFP WGR; n = 3 for HBB, HBA1 and HBB UTRs without intron 2; and n = 5 for HBA2 UTRs. ***P = 0.00023 by unpaired two-tailed t-test. e, MFI of GFP+ cells for each treatment as determined by the BD FACS Aria II platform. Values represent biologically independent HSPC donors: n = 6 for mock and AAV only; n = 4 for RNP only and HBB UTRs without intron 2; n = 3 for HBB UTRs; and n = 5 for HBA1 and HBA2 UTRs. Bars represent median ± interquartile range. *P= 0.037, ***P = 0.012 by unpaired two-tailed t-test without adjustment for multiple comparisons. f, Representative flow cytometry staining (FCS) and gating scheme for human HSPCs targeted at HBA1 with HBA1 UTRs donor and differentiated into RBCs. This indicates that only RBCs (CD34/CD45/CD71+/GPA+) are able to express the integrated T2A-YFP marker. E1–3, exons 1–3. K, 1,000.
Fig. 3 ∣
Fig. 3 ∣. WGR of α-globin with β-globin in SCD HSPCs.
a, AAV6 donor design for integration of a WGR HBB transgene at the HBA1 locus. b, Percentage of CD34/CD45 HSPCs acquiring RBC surface markers—GPA and CD71—as determined by flow cytometry. Bars represent median ± interquartile range. Values represent biologically independent HSPC donors: n = 5 for mock, RNP only and AAV only; n = 4 for HBB UTRs; n = 7 for HBA1 UTRs; and n = 6 for HBA1 UTRs long HAs (HBA1 long HAs). c, Targeted allele frequency in bulk edited population at HBA1 as determined by ddPCR. Bars represent median ± interquartile range. Values represent biologically independent HSPC donors: n = 6 for mock, n = 5 for RNP only, n = 4 for AAV only, n = 3 for HBB UTRs, n = 20 for HBA1 UTRs and n = 11 for HBA1 UTRs long HAs. *P = 0.021 by unpaired two-tailed t-test. d, Representative HPLC plots for each treatment following targeting and RBC differentiation of human SCD CD34+ HSPCs. Retention times for HgbF, HgbA and HgbS tetramer peaks are indicated. e, Percentage HgbA of total hemoglobin tetramers. Bars represent median ± interquartile range. Values represent biologically independent HSPC donors: n = 9 for mock, n = 3 for RNP only and AAV only, n = 1 for HBB UTRs, n = 6 for HBA1 UTRs and n = 4 for HBA1 UTRs long HAs. *P = 0.019 by unpaired two-tailed t-test. f, Correlation between percentage HgbA and percentage targeted alleles in edited SCD HSPCs differentiated into RBCs and analyzed by HPLC. n = 11 biologically independent HSPC donors. A.U., arbitrary units.
Fig. 4 ∣
Fig. 4 ∣. Engraftment of α-globin-targeted human HSPCs into NSG mice.
a, Sixteen weeks after transplantation of edited human CD34+ HSPCs into mice, bone marrow was harvested and engraftment rates were determined. Depicted is the percentage of mTerr119 cells (non-RBCs) that were hHLA+ among the total number of mCd45+ or hHLA+ cells. Bars represent median ± interquartile range. Values represent biologically independent transplantations: n = 8 for mock, n = 11 for RNP only, n = 10 for AAV only and n = 12 for RNP + AAV. b, Among engrafted human cells, distribution among CD19+ (B-cell), CD33+ (myeloid) and other (that is, HSPC/RBC/T/NK/Pre-B) lineages. Bars represent median ± interquartile range. Values represent biologically independent transplantations: n = 9 for mock, n = 11 for RNP only and RNP + AAV and n = 10 for AAV only. c, Targeted allele frequency at HBA1 as determined by ddPCR among in vitro (pretransplantation) HSPCs and bulk engrafted HSPCs, as well as among lineages. Bars represent median ± interquartile range. n = 3 for in vitro HSPCs, n = 12 for bulk engrafted HSPCs, n = 8 for CD19+ HSPCs, n = 10 for CD33+ HSPCs and n = 6 for CD34+ HSPCs. d, Targeted allele frequency at HBA1 among engrafted human cells compared to targeting rate pretransplantation in an in vitro human HSPC population. Individual mice are represented by different colors. Bars represent median ± interquartile range. n = 12 for bulk engrafted HSPCs, n = 8 for CD19+ HSPCs, n = 10 for CD33+ HSPCs and n = 6 for CD34+ HSPCs. e, 16 weeks post secondary transplantation, bone marrow was harvested and engraftment rates were determined as above. Bars represent median ± interquartile range. n = 2 for mock and n = 4 for edited treatment groups. f, Targeted allele frequency at HBA1 determined by ddPCR among engrafted human cells in bulk sample and lineages in secondary transplantations. Bars represent median ± interquartile range. n = 4 for each treatment group, with the exception of CD19+ HSPCs (n = 2). Large, medium and small doses correspond to 1,300,000, 750,000 and 250,000 transplanted cells, respectively. 1° and 2° indicate analysis of engraftment human cells harvested from primary or secondary mouse transplantations, respectively.
Fig. 5 ∣
Fig. 5 ∣. WGR of α-globin with β-globin in β-thalassemia HSPCs.
a, Percentage of CD34/CD45 HSPCs acquiring RBC surface markers—GPA and CD71—as determined by flow cytometry. Bars represent median ± interquartile range. n = 4 for each treatment group. b, Targeted allele frequency at HBA1 in β-thalassemia HSPCs as determined by ddPCR. Bars represent median ± interquartile range. n = 3 for mock, n = 2 for RNP only and HBA1 UTRs and n = 5 for HBA1 UTRs long HAs treatments. **P = 0.0047 by unpaired two-tailed t-test. c, Following differentiation of edited HSPCs into RBCs, mRNA expression was quantified by ddPCR. Expression of transgene HBA (does not distinguish between HBA1 and HBA2) and HBB was normalized to GPA expression. Bars represent median ± interquartile range. n = 3 for each treatment group, with the exception of HBA1 UTRs (n = 1). *P = 0.033 by unpaired two-tailed t-test. d, Summary of hemoglobin tetramer HPLC. Bars represent median ± interquartile range. Values represent biologically independent erythroid differentiations. n = 4 for mock, n = 5 for RNP only and n = 4 for HBA1 UTRs long HAs. ****P < 0.00001 by unpaired two-tailed t-test. e, Representative hemoglobin tetramer HPLC plots for each treatment following editing and RBC differentiation. Retention times for HgbF and HgbA tetramer peaks are indicated. f, Summary of reverse-phase globin chain HPLC results showing AUC of β-/α-globin. Bars represent median ± interquartile range. Values represent biologically independent erythroid differentiations: n = 3 for mock, n = 6 for RNP only and n = 4 for HBA1 UTRs long HAs. ****P = 0.000006 by unpaired two-tailed t-test. g, Representative reverse-phase globin chain HPLC plots for each treatment following targeting and RBC differentiation. Retention times for β- and α-globin peaks are indicated. A.U., arbitrary units.
Fig. 6 ∣
Fig. 6 ∣. Engraftment of α-globin-targeted β-thalassemia HSPCs into NSG mice.
a, Sixteen weeks after transplantation of targeted β-thalassemia HSPCs into mice, bone marrow was harvested and rates of engraftment were determined. Depicted are percentages of mTerr119 cells (non-RBCs) that were hHLA+ among the total number of mCd45+ or hHLA+ cells. Exp. 1–3 denote three separate mouse transplantation experiments of edited patient-derived HSPCs. Bars represent median ± interquartile range. n = 10 independent mouse transplantations. b, Among engrafted human cells, distribution is shown among B-cell, myeloid and other (that is, HSPC/RBC/T/NK/Pre-B) lineages. Bars represent median ± interquartile range. n = 9 independent mouse transplantations. c, Targeted allele frequency at HBA1 determined by ddPCR among engrafted human cells in bulk sample and lineages. Bars represent median ± interquartile range. n = 3 for mock treatment group and n = 10 for targeted treatment group.

References

    1. Galanello R & Origa R Beta-thalassemia. Orphanet J. Rare Dis 5, 11 (2010). - PMC - PubMed
    1. Mentzer WC & Kan YW Prospects for research in hematologic disorders: sickle cell disease and thalassemia. JAMA 285, 640–642 (2001). - PubMed
    1. Ehlers KH, Giardina PJ, Lesser ML, Engle MA & Hilgartner MW Prolonged survival in patients with beta-thalassemia major treated with deferoxamine. J. Pediatr 118, 540–545 (1991). - PubMed
    1. Mettananda S, Gibbons RJ & Higgs DR alpha-Globin as a molecular target in the treatment of beta-thalassemia. Blood 125, 3694–3701 (2015). - PMC - PubMed
    1. Dye DE, Brameld KJ, Maxwell S, Goldblatt J & O’Leary P The impact of single gene and chromosomal disorders on hospital admissions in an adult population. J. Community Genet 2, 81–90 (2011). - PMC - PubMed

Publication types