. 2021 May;24(5):658-666.
doi: 10.1038/s41593-021-00818-4. Epub 2021 Mar 18.

Spinal astroglial cannabinoid receptors control pathological tremor

Affiliations

Spinal astroglial cannabinoid receptors control pathological tremor

Eva Maria Meier Carlsen et al. Nat Neurosci. 2021 May.

Abstract

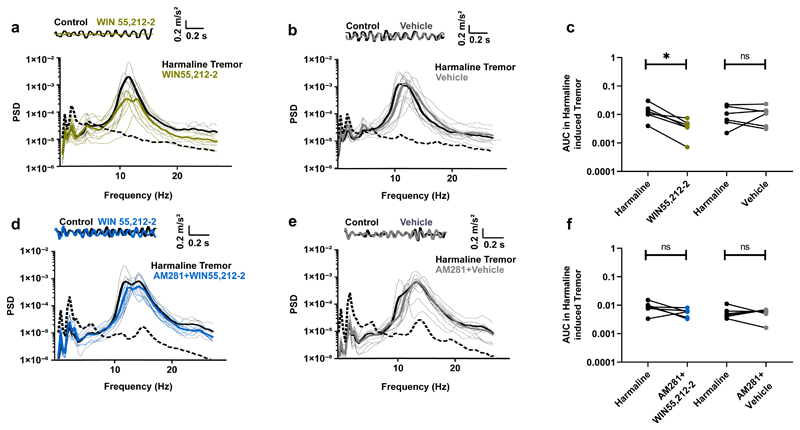
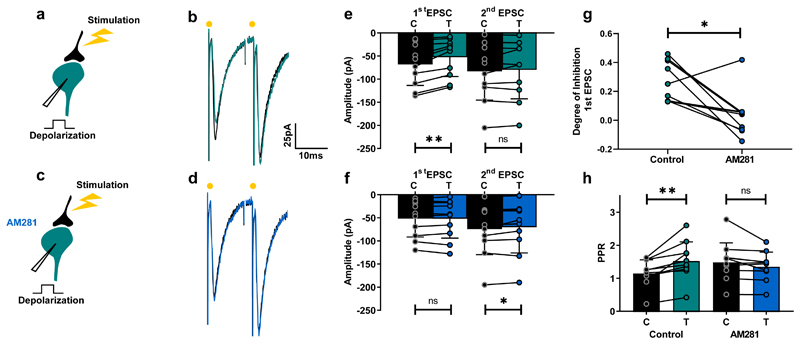
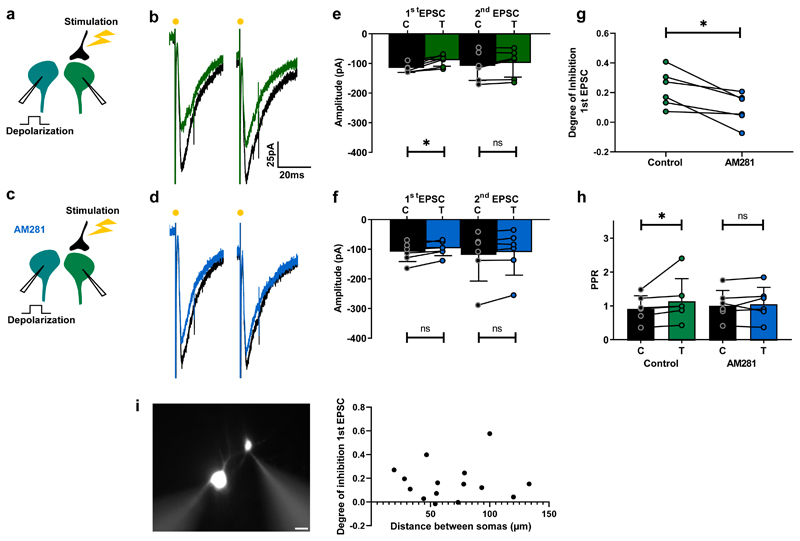
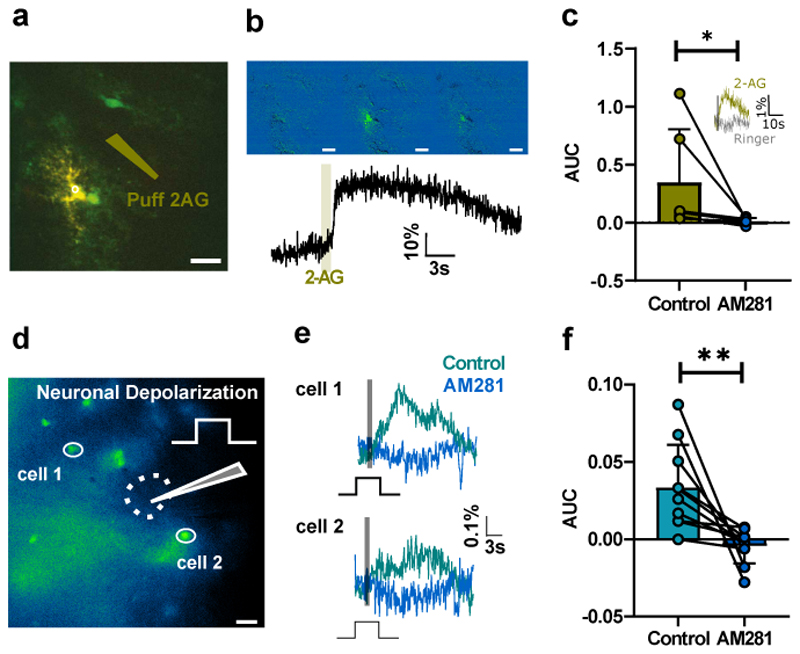
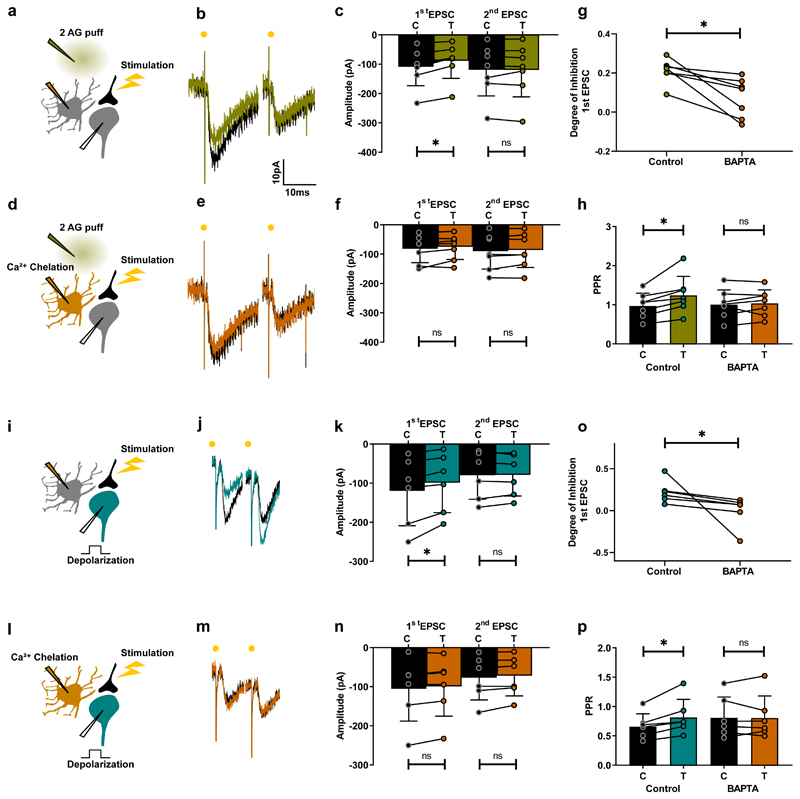
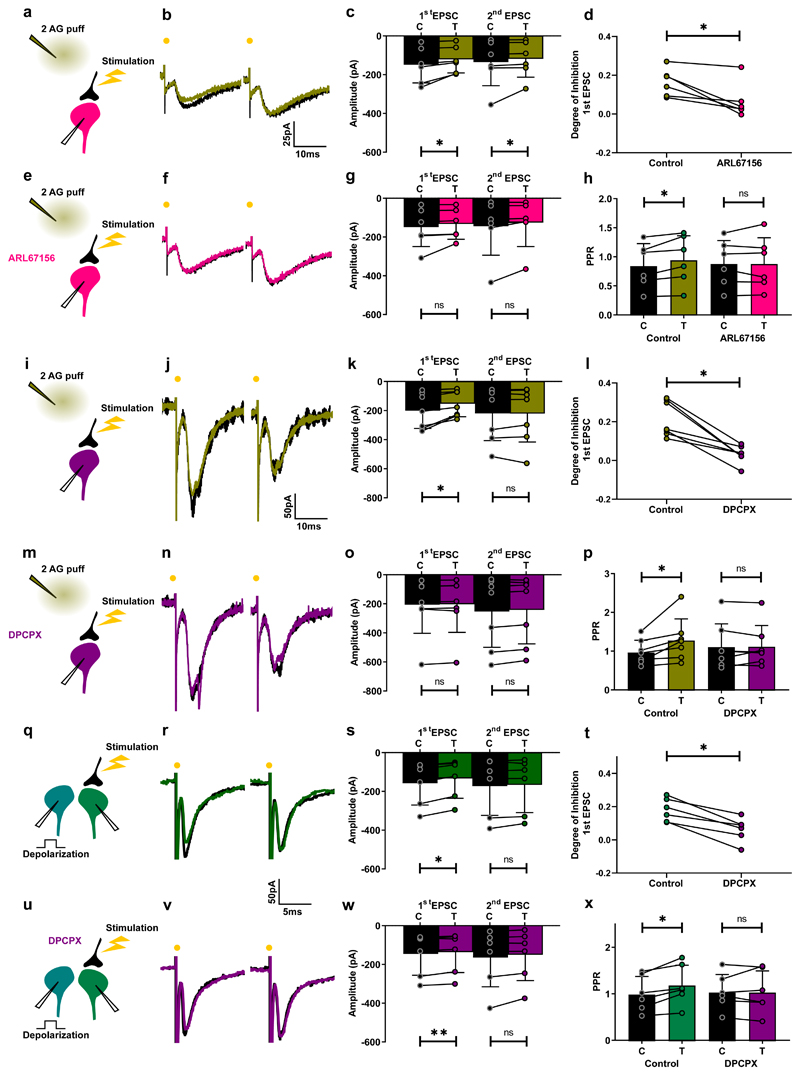
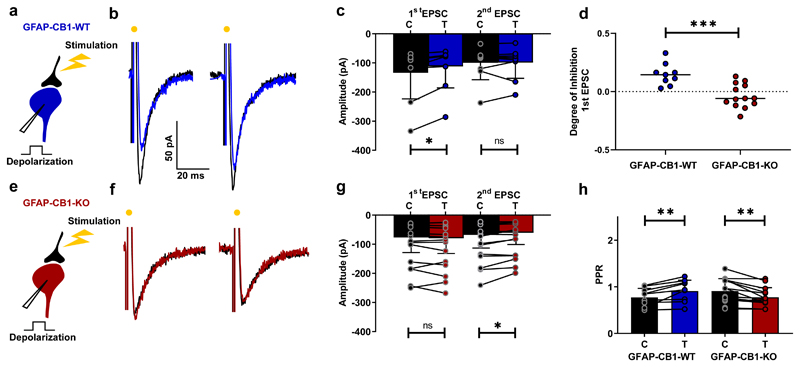
Cannabinoids reduce tremor associated with motor disorders induced by injuries and neurodegenerative disease. Here we show that this effect is mediated by cannabinoid receptors on astrocytes in the ventral horn of the spinal cord, where alternating limb movements are initiated. We first demonstrate that tremor is reduced in a mouse model of essential tremor after intrathecal injection of the cannabinoid analog WIN55,212-2. We investigate the underlying mechanism using electrophysiological recordings in spinal cord slices and show that endocannabinoids released from depolarized interneurons activate astrocytic cannabinoid receptors, causing an increase in intracellular Ca2+, subsequent release of purines and inhibition of excitatory neurotransmission. Finally, we show that the anti-tremor action of WIN55,212-2 in the spinal cords of mice is suppressed after knocking out CB1 receptors in astrocytes. Our data suggest that cannabinoids reduce tremor via their action on spinal astrocytes.


Conflict of interest statement

The authors declare no competing interests.

Figures

Fig. 1
Fig. 1. Activation of CB receptors in the spinal cord has an anti-tremor effect.
a,b,d,e, Top: accelerometer traces. Bottom: power spectra of whole animal tremor. Dotted lines: examples of spontaneous tremor occurring before harmaline treatment. a, Administration of harmaline induced a tremor that was inhibited by intrathecal injection of WIN55,212-2. b, Intrathecal injection of a vehicle had no effect on harmaline-induced tremor. c, Area under the power spectra curve (8Hz-25Hz). Each dot pair corresponds to one animal. Significant effect of WIN55,212-2 (Wilcoxon matched-pairs signed rank test, n = 6, p = 0.031). No significant effect of vehicle (Wilcoxon matched-pairs signed rank test, n = 6, p = 0.99). d, When animals were pretreated with CB1 receptor antagonist AM281 (0.5mg/kg), WIN55,212-2 did not decrease tremor significantly. e, Pretreatment with AM281 and subsequent intrathecal injection of a vehicle had no effect on tremor. f, Area under the power spectra curve (8Hz-25Hz). Each dot pair corresponds to one animal. For animals pretreated with AM281, no significant effect of WIN55,212-2 (Wilcoxon matched-pairs signed rank test, n = 6, p = 0.16) or of vehicle (Wilcoxon matched-pairs signed rank test, n = 6, p = 0.99). The statistical test used was two-sided.
Fig. 2
Fig. 2. Depolarization of ventral horn interneurons induces suppression of excitatory synaptic transmission
a,c, Schematic of spinal cord slice recordings. b, Example average response (10 sweeps) of an interneuron to electric stimulation of excitatory afferents before (black) and after a depolarizing pulse (turquoise). d, Same protocol in presence of AM281 (blue). e, Mean EPSC amplitudes from all cells tested before and after depolarization. First EPSC: significant inhibition (Wilcoxon matched-pairs signed rank test, n = 10 individual cells, p = 0.002); second EPSC: non-significant difference Wilcoxon matched-pairs signed rank test, n = 10 individual cells, p = 0.85). f, AM281 prevent induction of DSE (first EPSC: Wilcoxon matched-pairs signed rank test, n = 10 individual cells, p = 0.92; second EPSC: Wilcoxon matched-pairs signed rank test, n = 10 individual cells, p = 0.049). g, Degree of inhibition of first EPSC in control conditions and in the presence of AM281 (Wilcoxon matched-pairs signed rank test, n = 10 individual cells, p = 0.014). h, PPR before and after depolarization in control conditions and following addition of AM281. Significant increase in control (Wilcoxon matched-pairs signed rank test, n = 10 individual cells, p = 0.002). No significant change in AM281 (Wilcoxon matched-pairs signed rank test, n = 10 individual cells, p = 0.065). Data are presented as mean values +/- SD. The statistical test used was two-sided.
Fig. 3
Fig. 3. DSE in the spinal cord occurs between interneurons
a,c, Schematic of spinal cord slice recordings. b, Example average response (10 sweeps) of an interneuron to electric stimulation before (black) and after depolarization of another interneuron (green). d, Same protocol in presence of AM281 (blue). e, mean EPSC amplitudes from all cells tested before and after depolarization. First EPSC: significant inhibition (Wilcoxon matched-pairs signed rank test, n = 6 individual cells, p = 0.031); second EPSC, no significant difference (Wilcoxon matched-pairs signed rank test, n = 6 individual cells, p = 0.16). f, Mean EPSC amplitudes before and after depolarization in the presence of AM281. No significant change induced by depolarization. (Wilcoxon matched-pairs signed rank test, n =6 individual cells: first EPSC, p = 0.09; second EPSC, p = 0.09). g, Degree of depolarization-induced inhibition of first EPSC in control conditions and after AM281. Significant difference (Wilcoxon matched-pairs signed rank test, n = 6 individual cells, p = 0.031). h, PPR before and after depolarization in control conditions and following addition of AM281. Significant increase in control (Wilcoxon matched-pairs signed rank test, n = 6 individual cells, p = 0.031). No significant change in AM281 (Wilcoxon matched-pairs signed rank test, n = 6 individual cells, p = 0.43). i, Epifluorescence image of an example pair of neurons recorded in whole-cell configuration. Scalebar: 20 µm. Plot: degree of inhibition as function of distance between somas for all pairs measured (n=15 pairs). Data are presented as mean values +/- SD. The statistical test used was two-sided.
Fig. 4
Fig. 4. Neuronal depolarization activates astrocytic CB1 receptors
a, Single GFP-expressing astrocyte loaded with Oregon Green TTX (1 µM) and cadmium chloride (100 µM) present in the bath. Puff pipette loaded with 2-AG (10 µM) (olive). b, Cell activity monitored by two-photon microscopy before and after puff application of 2-AG (average response, 15±7%, n = 6 individual cells). c, Area under the curve (AUC) of the Ca2+ response monitored with epifluorescence microscopy following puff application of 2-AG in the presence of TTX (1µm), before and after addition of AM281. Significant reduction (Wilcoxon matched-pairs signed rank test, p = 0.031, n = 6 individual cells). Insert: A puff or Ringer’s (same position, same intensity) had no effect (n = 3 individual cells). d. Example slice: GFP expression in a Rhod-2-AM loaded slice from the GFAP-GFP mouse. Whole-cell recording of an interneuron (position indicated by the dotted line) while monitoring Ca2+ in two GFP-positive cells stained with Rhod-2 by means of epifluorescence microscopy. Recording performed in TTX (1 µM). Scalebar: 20 µm. e, One-second depolarization of the interneuron (grey bar) induced an increase in Ca2+ for both cells depicted in d (mean of 3 consecutive trials). The responses were abolished by AM281 (1µM). f, AUC before and after AM281 for all tested cells. Significant decrease (Wilcoxon matched-pairs signed rank test, n = 10 cells from 3 animals, p = 0.002). Data are presented as mean values +/- SD. The statistical test used was two-sided.
Fig. 5
Fig. 5. DSE in the ventral horn is mediated by astrocytes
a, d, i, l, Schematic of spinal cord slice recordings. Patch pipette containing BAPTA (30 mM) (orange) cell-attached to an astrocyte. Puff pipette filled with 2-AG (10 µM). b, Example average response (10 sweeps) of an interneuron to electric stimulation of excitatory axons before (black) and after 2-AG puff (olive). c, Mean amplitude EPSCs from all cells tested before and after puff. First EPSC: significant inhibition (Wilcoxon matched-pairs signed rank test, n = 7 individual cells, p = 0.016); second EPSC, no significant difference (Wilcoxon matched-pairs signed rank test, n = 7 individual cells, p = 0.58). d-f, Same protocol after breaking into the astrocytes (orange). No significant change induced by 2-AG (Wilcoxon matched-pairs signed rank test, n = 7 individual cells; first EPSC, p = 0.22; second EPSC, p = 0.58). g, Degree of inhibition of first EPSC. Significant difference (Wilcoxon matched-pairs signed rank test, n = 7 individual cells, p = 0.016). h, PPR before and after 2-AG in control conditions and after BAPTA loading of astrocyte. Significant increase in control (Wilcoxon matched-pairs signed rank test, n = 7 individual cells, p = 0.016). No significant change after BAPTA (Wilcoxon matched-pairs signed rank test, n = 7 individual cells, p = 0.58). i-p, Same protocol except that inhibition is induced by postsynaptic depolarization (turquoise). k, First EPSC: significant inhibition (Wilcoxon matched-pairs signed rank test, n = 6 individual cells, p = 0.031); second EPSC, no significant difference (Wilcoxon matched-pairs signed rank test, n = 6 individual cells, p = 0.84). n, After BAPTA, first EPSC (Wilcoxon matched-pairs signed rank test, n = 6 individual cells, p = 0.16); second EPSC (Wilcoxon matched-pairs signed rank test, n = 6 individual cells, p = 0.06). o, Significant inhibition (Wilcoxon matched-pairs signed rank test, n = 6 individual cells, p = 0.031). p, PPR before and after depolarization in control conditions and after BAPTA. Significant increase in control (Wilcoxon matched-pairs signed rank test, n = 6 individual cells, p = 0.031). No significant change after BAPTA (Wilcoxon matched-pairs signed rank test, n = 6 individual cells, p = 0.99). Data are presented as mean values +/- SD. The statistical test used was two-sided.
Fig. 6
Fig. 6. Purines mediate suppression of excitation induced by 2-AG and depolarization.
a, e, i, m, q, u, Schematic of spinal cord slice recordings. Puff pipette filled with 2-AG (10 µM). b, Example average response (10 sweeps) of an interneuron to electric stimulation of excitatory axons before (black) and after 2-AG puff (olive). c, Mean amplitude EPSCs from all cells tested before and after puff. First EPSC: significant inhibition (Wilcoxon matched-pairs signed rank test, n = 6 individual cells, p = 0.031); second EPSC: significant inhibition (Wilcoxon matched-pairs signed rank test, n = 6 individual cells, p = 0.031). e-g, Same protocol after addition of ARL67156. No significant change induced by 2-AG. (Wilcoxon matched-pairs signed rank test, n = 6 individual cells; first EPSC, p = 0.06; second EPSC, p = 0.06). d, Degree of inhibition of first EPSC. Significant difference (Wilcoxon matched-pairs signed rank test, n = 6 individual cells, p = 0.031). h, PPR before and after 2-AG in control conditions and after ARL67156. Significant increase in control (Wilcoxon matched-pairs signed rank test, n = 6 individual cells, p = 0.03). No significant change after ARL67156 (Wilcoxon matched-pairs signed rank test, n = 6 individual cells, p = 0.99). i-p, Same protocol. k, First EPSC: significant inhibition (Wilcoxon matched-pairs signed rank test, n = 6 individual cells, p = 0.03); second EPSC, no significant difference (Wilcoxon matched-pairs signed rank test, n = 6 individual cells, p = 0.41). n, After DPCPX, no significant inhibition (Wilcoxon matched-pairs signed rank test, n = 6; first EPSC, p = 0.31; second EPSC, p = 0.22). o, Significant inhibition (Wilcoxon matched-pairs signed rank test, n = 6 individual cells, p = 0.031). p, PPR before and after depolarization in control conditions and after DPCPX. Significant increase in control (Wilcoxon matched-pairs signed rank test, n = 6 individual cells, p = 0.031). No significant change after DPCPX (p = 0.99). q-s, Same protocol as in Fig. 3a-c. s, Mean EPSC amplitudes before and after depolarization. First EPSC: significant inhibition (Wilcoxon matched-pairs signed rank test, n = 6 individual cells, p = 0.031); second EPSC: no significant difference (Wilcoxon matched-pairs signed rank test, n = 6 individual cells, p = 0.31). u-w, Same protocol after addition of DPCPX (5 µM) (purple). No significant change induced by depolarization (Wilcoxon matched-pairs signed rank test, n = 6 individual cells; first EPSC, p = 0.06; second EPSC, p = 0.06). t, Degree of inhibition of first EPSCs. Significant difference (Wilcoxon matched-pairs signed rank test, n = 6 individual cells, p = 0.03). x, PPR before and after depolarization in control conditions and after DPCPX. Significant increase in control (Wilcoxon matched-pairs signed rank test, n = 6 individual cells, p = 0.03). No significant change in DPCPX (Wilcoxon matched-pairs signed rank test, n = 6 individual cells, p = 0.69). Data are presented as mean values +/- SD. The statistical test used was two-sided.
Fig. 7
Fig. 7. DSE occurs in the adult spinal cord but not in animals lacking astrocytic CB1 receptors.
a, e, Schematic of spinal cord slice recording. b, Example average response (10 sweeps) of an interneuron to electric stimulation of excitatory axons before (black) and after a depolarizing pulse (blue) in a slice from a GFAP-CB1-WT mouse (P54). c, Mean EPSC amplitudes from all cells tested before and after depolarization. First EPSC: significant inhibition (p = 0.004, Wilcoxon matched-pairs signed rank test, n = 9 cells from 4 animals); second EPSC: no significant difference (p = 0.82, Wilcoxon matched-pairs signed rank test, n = 9 cells from 4 animals). e-g, Same protocol in a slice from GFAP-CB1-KO mouse (P53). No significant change of the first EPSC induced by depolarization (Wilcoxon matched-pairs signed rank test, n = 13 cells from 4 animals; first EPSC, p = 0.31; second EPSC, p = 0.02). d, Degree of inhibition of first EPSC. Significant difference (Mann-Whitney test, p = 0.0006). h, PPR before and after depolarization in GFAP-CB1-WT and GFAP-CB1-KO slices. Significant increase in GFAP-CB1-WT (Wilcoxon matched-pairs signed rank test, n = 9 cells from 4 animals, p = 0.004). Significant decrease in GFAP-CB1-KO (Wilcoxon matched-pairs signed rank test, n = 13 cells from 4 animals, p = 0.001). Data are presented as mean values +/- SD. The statistical tests used were two-sided.
Fig. 8
Fig. 8. Knocking out astrocytic CB1 receptors prevents the anti-tremor effect of WIN55,212-2
a,c, Top: accelerometer traces. Bottom: power spectra of whole animal tremor. Dotted lines: examples of spontaneous tremor occurring before harmaline treatment. a, Raw trace recorded by the accelerometer for a GFAP-CB1-WT mouse before (blue) and after intrathecal injection of WIN55,212-2 (30mg/ml) (olive) and power spectra of tremor for all animals before and after injection of WIN55,212-2. b, Area under the curve (AUC) of the power spectra between 8Hz-25Hz. Significantly decrease after WIN55,212-2 intrathecal injection in GFAP-CB1-WT animals (Wilcoxon matched-pairs signed rank test, n = 10 animals, p = 0.002). c, Raw trace recorded by the accelerometer for a GFAP-CB1-KO mouse before (red) and after intrathecal injection of WIN55,212-2 (30mg/ml) (olive) and power spectra of tremor for all GFAP-CB1-KO animals before and after injection of WIN55,212-2. d, AUC of the power spectra between 8Hz-25Hz. Control AUC not significantly changed after intrathecal injection of WIN55,212-2 in GFAP-CB1-KO mice (Wilcoxon matched-pairs signed rank test, n = 11 animals, p = 0.41). Inset: Comparison of tremor induced between the two genotypes. Same scale as in b and d. No significant difference (Mann Whitney test, p = 0.08). Boxplot: Whiskers: minimum to maximum. Central lines: median. Bottom and top edges: 25th to 75th percentiles. The statistical tests used were two-sided.

References

    1. Deuschl G, Bain P, Brin M. Consensus statement of the Movement Disorder Society on Tremor. Ad Hoc Scientific Committee. Movement disorders : official journal of the Movement Disorder Society. 1998;13(Suppl 3):2–23. doi: 10.1002/mds.870131303. - DOI - PubMed
    1. Alty JE, Kempster PA. A practical guide to the differential diagnosis of tremor. Postgrad Med J. 2011;87:623–629. doi: 10.1136/pgmj.2009.089623. - DOI - PubMed
    1. Biary N, Cleeves L, Findley L, Koller W. Post-traumatic tremor. Neurology. 1989;39:103–106. doi: 10.1212/wnl.39.1.103. - DOI - PubMed
    1. Koch M, Mostert J, Heersema D, De Keyser J. Tremor in multiple sclerosis. J Neurol. 2007;254:133–145. doi: 10.1007/s00415-006-0296-7. - DOI - PMC - PubMed
    1. Rinker JR, 2nd, et al. Prevalence and characteristics of tremor in the NARCOMS multiple sclerosis registry: a cross-sectional survey. BMJ Open. 2015;5:e006714. doi: 10.1136/bmjopen-2014-006714. - DOI - PMC - PubMed

Methods only references

    1. Marsicano G, et al. CB1 cannabinoid receptors and on-demand defense against excitotoxicity. Science. 2003;302:84–88. doi: 10.1126/science.1088208. - DOI - PubMed
    1. Hirrlinger PG, Scheller A, Braun C, Hirrlinger J, Kirchhoff F. Temporal control of gene recombination in astrocytes by transgenic expression of the tamoxifen-inducible DNA recombinase variant CreERT2. Glia. 2006;54:11–20. doi: 10.1002/glia.20342. - DOI - PubMed

Publication types

MeSH terms

Substances

LinkOut - more resources