. 2021 Apr;53(4):564-573.
doi: 10.1038/s41588-021-00807-0. Epub 2021 Mar 18.

Chromosome-scale genome assembly provides insights into rye biology, evolution and agronomic potential

Affiliations

Chromosome-scale genome assembly provides insights into rye biology, evolution and agronomic potential

M Timothy Rabanus-Wallace et al. Nat Genet. 2021 Apr.

Abstract

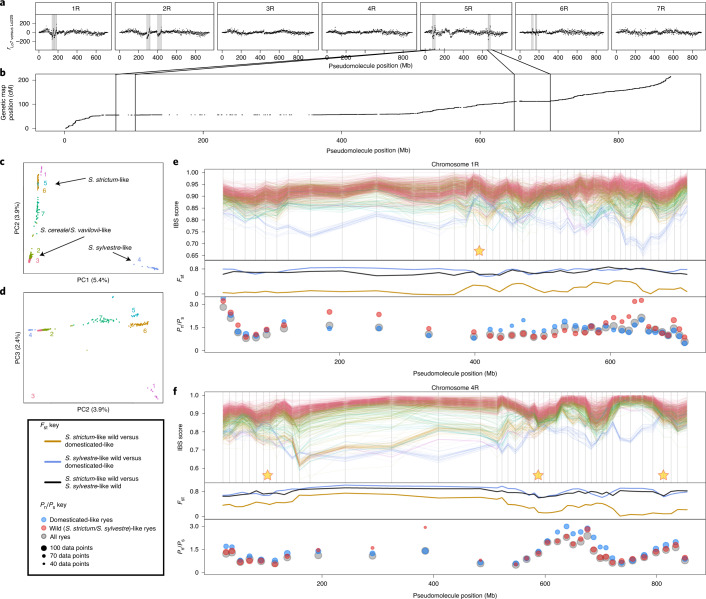
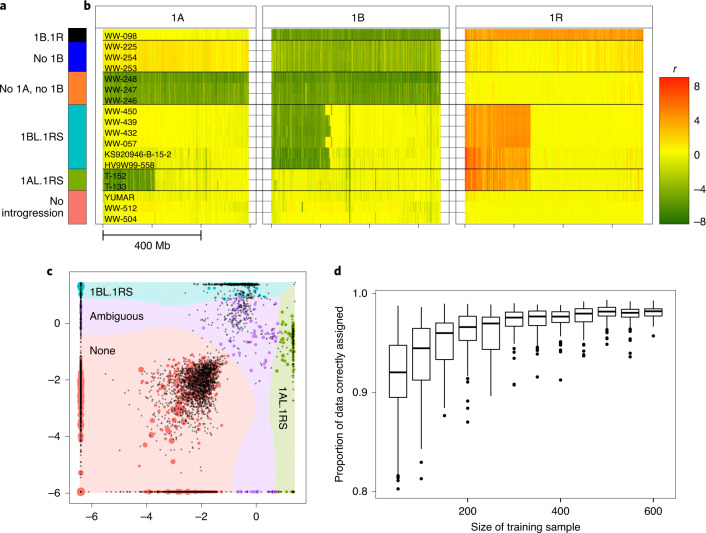
Rye (Secale cereale L.) is an exceptionally climate-resilient cereal crop, used extensively to produce improved wheat varieties via introgressive hybridization and possessing the entire repertoire of genes necessary to enable hybrid breeding. Rye is allogamous and only recently domesticated, thus giving cultivated ryes access to a diverse and exploitable wild gene pool. To further enhance the agronomic potential of rye, we produced a chromosome-scale annotated assembly of the 7.9-gigabase rye genome and extensively validated its quality by using a suite of molecular genetic resources. We demonstrate applications of this resource with a broad range of investigations. We present findings on cultivated rye's incomplete genetic isolation from wild relatives, mechanisms of genome structural evolution, pathogen resistance, low-temperature tolerance, fertility control systems for hybrid breeding and the yield benefits of rye-wheat introgressions.


Conflict of interest statement

V.K. is an employee of KWS SAAT SE & Co. KGaA. D.S. is an employee of HYBRO Saatzucht GmbH & Co. KG. All other authors declare no competing interests.

Figures

Fig. 1
Fig. 1. Rye (‘Lo7’) genome composition and structure over chromosomes 1R to 7R.
Twin vertical gray lines in each chromosome denote the boundaries of the pericentromeric low-collinearity regions for each chromosome. a, Genetic map positions of markers used in assembly. Scaffold boundaries marked by gray vertical lines. b, Density of annotated gene models. c, Gene collinearity with barley (cv. ‘Morex’), with the position on the ‘Morex’ pseudomolecules on the vertical axis. Text and point colors represent barley chromosomes as labeled. dg, Positions and ages of four LTR retrotransposon families RLG-Sabrina (d), RLG-WHAM (e), RLC-Angela (f) and RLG_Cereba (g) in the genome, represented as a heatmap. Binned ages are on the vertical axis (from 0 million years ago, Ma, at the bottom) and bin positions are across the horizontal. Heat represents the number of TEs in each age/position bin (see legend inset). Red arrows mark notable changes in LTR-RT profiles.
Fig. 2
Fig. 2. Dissecting the relationships among rye genotypes.
a, Hi-C asymmetry detects SVs between the reference genotype ‘Lo7’ and S. cereale ‘Lo225’. SVs result in discontinuities in r, the ratio of Hi-C links mapping left:right relative to ‘Lo7’. Large inversions (marked) typically produce clean, diagonal lines. Visually identified candidate SVs are shaded. b, Detail of 5R genetic map marker positions showing how recombination rate relates to candidate SVs. The rightmost inversion marked on 5R corresponds to a region of suppressed recombination on chromosome 5R. The effect of other ‘Lo7’ versus ’Lo225’ SVs on recombination was harder to confirm since they fall in already-low-recombining regions. c,d, PCA plots showing the relationships among genetically determined rye clusters for PCs 1 and 2 (c) and for PCs 2 and 3 (d). e,f, Binwise IBS, Fst and Pn/Ps statistics calculated across the chromosomes using the expanded Schreiber et al. rye diversity panel data mapped to the ‘Lo7’ assembly. Exemplary instances are shown: chromosomes 1R (e) and 4R (f). The position of each bin on the genome is the mean pseudochromosome position of identified variable sites within that bin. Upper in each pane: binwise IBS scores of the panel genotypes compared with ‘Lo7’, with features discussed in the text marked with asterisks. Colors correspond to d. Middle in each pane: binwise Fst showing changes in genetic variance partitioning among and between subgroups across the chromosome. Line colors, Fst key. Lower in each pane: binwise Pn/Ps ratios (shown when Pn + Ps > = 10 for a given bin) for recently acquired rye polymorphisms (wheat outgroup). The values were calculated separately for different groups of ryes (‘domesticated’ (cluster 3) versus ‘wild’ (clusters 1,4–7)—see d) to allow detection of possible recent selective events affecting different rye groups. Point colors/sizes, Pn/Ps key.
Fig. 3
Fig. 3. Combined reference mapping as a means to classify wheat and wheat–rye introgression karyotypes.
a, Color key for b and c. b, Normalized read mapping depths for 1-Mb bins of chromosomes 1A, 1B and 1R, for a selection of wheat lines (including also some Aegilops tauschii accessions which contain no A or B subgenome) with various chromosome complements and introgressions (rows). The value r denotes the difference between the log2 reads per million mapping to a bin, compared to T. aestivum cv. ‘Chinese Spring’. c, Visual representation of the SVM classifier, with the two selection features based on relative read mapping densities to ‘translocation-prone’ and ‘other’ chromosomal regions (Methods) shown on the x and y axes. Points represent training samples, with color corresponding to human-designated classification and size proportional to the total number of mapped reads for the sample. Black points are samples not classified by a human. Background colors represent the hypothetical classification that would be given to a sample at that position. d, Results of cross-validation testing the accuracy of the classifier and its relationship to the size of the training set. Box edges and whiskers represent quartiles and the center lines show the arithmetic means.
Fig. 4
Fig. 4. Comparative genomics of rye genes with agricultural importance.
ae, Density (instances per Mb) of mTERFs (a), PPRs (d) as well as NLRs (e) across the pseudomolecules. For visualization, the y axis is transformed using x → x1/3. f, Genomic locations of genes and loci discussed in the text. Colored bars correspond and refer to the colors of the box outlines in gk; gj, physical organization of selected NLR gene clusters compared across cultivated Triticeae genomes: Pm2 (g), Lr10/RGA2 (h), Pm3 (i) and Mla (j). k, Organization of RFL genes at the ‘Lo7’ Rfmulti locus compared to its wheat (‘Chinese Spring’) counterpart. Flanking markers are shown on either end of the rye sequence. Two full-length wheat RFLs and a putative rye ortholog are labeled. PPR genes are colored red. l, CNV between ‘PUMA-SK’ and ‘Lo7’ within the Fr2 interval revealed by 10x Genomics linked read sequencing. A (Dup)lication flagged by the Loupe analysis software is marked. The estimated copy number differences between ‘Lo7’ and ‘Puma’ are shown for CBF genes.
Fig. 5
Fig. 5. The cold tolerance associated region Fr2 in ‘Puma’ and ‘NorstarPuma5A:5R’ translocation line.
a, Chromosome labeling (top) using probes specific for ‘Norstar’ chromosome 5A (Afa) and ‘Puma’ 5R (pSc119.2) confirm the presence of a rye translocation in NorstarPuma5A:5R (red box), which also alters the binding of GAA. White bars, 10 µm. b, Combined reference read mapping of group 5 chromosomes confirms the balanced translocation event, gain of a large region of chromosome 5R from ‘Puma’ (rye, light read line) and loss of a large region on chromosome 5A of ‘Norstar’ (wheat, light blue line) in ‘NorstarPuma5A:5R’. Read depth is given in log2 reads per million versus ‘Chinese Spring’. c, Gene expression analysis of rye CBF genes with CNV in ‘Puma’ (blue line) and ‘NorstarPuma5A:5R’ (orange line). Plants were grown in a time series with decreasing day length and temperature over a 70-d period and the temperatures at which 50% lethality was observed (LT50) were recorded (heatmap).

References

    1. Beck HE, et al. Present and future Köppen–Geiger climate classification maps at 1-km resolution. Sci. Data. 2018;5:180214. - PMC - PubMed
    1. Sharma S, et al. Integrated genetic map and genetic analysis of a region associated with root traits on the short arm of rye chromosome 1 in bread wheat. Theor. Appl. Genet. 2009;119:783–793. - PMC - PubMed
    1. Lukaszewski, A.J. in Alien Introgression in Wheat (eds Molnár-Láng, M. et al.) 163–189 (Springer, 2015).
    1. Kim W, Johnson J, Baenziger P, Lukaszewski A, Gaines C. Agronomic effect of wheat–rye translocation carrying rye chromatin (1R) from different sources. Crop Sci. 2004;44:1254–1258.
    1. Crespo-Herrera LA, Garkava-Gustavsson L, Åhman I. A systematic review of rye (Secale cereale L.) as a source of resistance to pathogens and pests in wheat (Triticum aestivum L.) Hereditas. 2017;154:14. - PMC - PubMed

Publication types