Charge-Transfer Complex of Linifanib with 2,3-dichloro-3,5-dicyano-1,4-benzoquinone: Synthesis, Spectroscopic Characterization, Computational Molecular Modelling and Application in the Development of Novel 96-microwell Spectrophotometric Assay
- PMID: 33737805
- PMCID: PMC7966300
- DOI: 10.2147/DDDT.S296502
Charge-Transfer Complex of Linifanib with 2,3-dichloro-3,5-dicyano-1,4-benzoquinone: Synthesis, Spectroscopic Characterization, Computational Molecular Modelling and Application in the Development of Novel 96-microwell Spectrophotometric Assay
Abstract
Background: Linifanib (LFB) is a multi-targeted receptor tyrosine kinase inhibitor used in the treatment of hepatocellular carcinoma and other types of cancer. The charge-transfer (CT) interaction of LFB is important in studying its receptor binding mechanisms and useful in the development of a reliable CT-based spectrophotometric assay for LFB in its pharmaceutical formulation to assure its therapeutic benefits.
Purpose: The aim of this study was to investigate the CT reaction of LFB with 2,3-dichloro-3,5-dicyano-1,4-benzoquinone (DDQ) and its application in the development of a novel 96-microwell spectrophotometric assay for LFB.
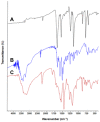
Methods: The reaction was investigated, its conditions were optimized, the physicochemical and constants of the CT complex and stoichiometric ratio of the complex were determined. The solid-state LFB-DDQ complex was synthesized and its structure was analyzed by UV-visible, FT-IR, and 1H-NMR spectroscopic techniques, and also by the computational molecular modeling. The reaction was employed in the development of a novel 96-microwell spectrophotometric assay for LFB.
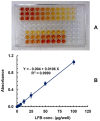
Results: The reaction resulted in the formation of a red-colored product, and the spectrophotometric investigations confirmed that the reaction had a CT nature. The molar absorptivity of the complex was linearly correlated with the dielectric constant and polarity index of the solvent; the correlation coefficients were 0.9526 and 0.9459, respectively. The stoichiometric ratio of LFB:DDQ was 1:2. The spectroscopic and computational data confirmed the sites of interaction on the LFB molecule, and accordingly, the reaction mechanism was postulated. The reaction was utilized in the development of the first 96-microwell spectrophotometric assay for LFB. The assay limits of detection and quantitation were 1.31 and 3.96 μg/well, respectively. The assay was successfully applied to the analysis of LFB in its bulk and tablets with high accuracy and precision.
Conclusion: The assay is simple, rapid, accurate, eco-friendly as it consumes low volumes of organic solvent, and has high analysis throughput.
Keywords: 2,3-dichloro-3,5-dicyano-1,4-benzoquinone; 96-microwell spectrophotometric assay; charge-transfer reaction; high-throughput pharmaceutical analysis; linifanib; spectroscopic techniques.
© 2021 Darwish et al.
Conflict of interest statement
The authors report no conflicts of interest in this work.
Figures




Similar articles
-
Spectrophotometric and computational characterization of charge transfer complex of selumetinib with 2,3-dichloro-5,6-dicyano-1,4-benzoquinone and its utilization in developing an innovative green and high throughput microwell assay for analysis of bulk form and pharmaceutical formulation.BMC Chem. 2025 Jan 29;19(1):27. doi: 10.1186/s13065-024-01353-6. BMC Chem. 2025. PMID: 39881370 Free PMC article.
-
Charge-transfer reaction of 2,3-dichloro-1,4-naphthoquinone with crizotinib: Spectrophotometric study, computational molecular modeling and use in development of microwell assay for crizotinib.Saudi Pharm J. 2015 Jan;23(1):75-84. doi: 10.1016/j.jsps.2014.06.003. Epub 2014 Jun 14. Saudi Pharm J. 2015. PMID: 25685046 Free PMC article.
-
Charge-transfer reaction of 1,4-benzoquinone with crizotinib: spectrophotometric study, computational molecular modeling and use in development of microwell assay for crizotinib.Spectrochim Acta A Mol Biomol Spectrosc. 2014 Oct 15;131:347-54. doi: 10.1016/j.saa.2014.04.099. Epub 2014 May 2. Spectrochim Acta A Mol Biomol Spectrosc. 2014. PMID: 24835938
-
Synthesis, spectroscopic and computational studies on hydrogen bonded charge transfer complex of duvelisib with chloranilic acid: Application to development of novel 96-microwell spectrophotometric assay.Spectrochim Acta A Mol Biomol Spectrosc. 2022 Jan 5;264:120287. doi: 10.1016/j.saa.2021.120287. Epub 2021 Aug 21. Spectrochim Acta A Mol Biomol Spectrosc. 2022. PMID: 34455386
-
DDQ as a versatile and easily recyclable oxidant: a systematic review.RSC Adv. 2021 Sep 8;11(47):29826-29858. doi: 10.1039/d1ra04575j. eCollection 2021 Sep 1. RSC Adv. 2021. PMID: 35479576 Free PMC article. Review.
Cited by
-
Development of Two Novel One-Step and Green Microwell Spectrophotometric Methods for High-Throughput Determination of Ceritinib, a Potent Drug for Treatment of Anaplastic Lymphoma Kinase-Positive Non-Small-Cell Lung Cancer.Medicina (Kaunas). 2023 Oct 12;59(10):1813. doi: 10.3390/medicina59101813. Medicina (Kaunas). 2023. PMID: 37893531 Free PMC article.
-
From the Matrix to the Nucleus and Back: Mechanobiology in the Light of Health, Pathologies, and Regeneration of Oral Periodontal Tissues.Biomolecules. 2021 May 31;11(6):824. doi: 10.3390/biom11060824. Biomolecules. 2021. PMID: 34073044 Free PMC article. Review.
-
Multispectral and Molecular Docking Studies Reveal Potential Effectiveness of Antidepressant Fluoxetine by Forming π-Acceptor Complexes.Molecules. 2022 Sep 10;27(18):5883. doi: 10.3390/molecules27185883. Molecules. 2022. PMID: 36144618 Free PMC article.
-
Spectrophotometric and computational characterization of charge transfer complex of selumetinib with 2,3-dichloro-5,6-dicyano-1,4-benzoquinone and its utilization in developing an innovative green and high throughput microwell assay for analysis of bulk form and pharmaceutical formulation.BMC Chem. 2025 Jan 29;19(1):27. doi: 10.1186/s13065-024-01353-6. BMC Chem. 2025. PMID: 39881370 Free PMC article.
-
Novel High-Throughput Microwell Spectrophotometric Assay for One-Step Determination of Lorlatinib, a Novel Potent Drug for the Treatment of Anaplastic Lymphoma Kinase (ALK)-Positive Non-Small Cell Lung Cancer.Medicina (Kaunas). 2023 Apr 13;59(4):756. doi: 10.3390/medicina59040756. Medicina (Kaunas). 2023. PMID: 37109714 Free PMC article.
References
-
- Mulliken RS, Pearson WB. Molecular Complexes. Wiley Publishers; 1969.
-
- Foster R. Organic Charge-Transfer Complexes. Academic Press; 1969.
-
- Das SK, Krishnamorthy G, Dofra SK. Excited state intramolecular proton transfer in 2-(2’-hydroxyphenyl)-1H-naphth-[2,3-d]-imidazole: effects of solvents and pH. Can J Chem. 2000;78(2):191–205. doi:10.1139/v99-244 - DOI
-
- Datta AS, Bagchi S, Chakrabortty A, et al. Studies on the weak interactions and CT complex formations between chloranilic acid, 2,3-dichloro-5,6-dicyano-p-benzoquinone, tetracyanoethylene and papaverine in acetonitrile and their thermodynamic properties, theoretically, spectrophotometrically aided by FTIR. Spectrochim Acta A. 2015;146:119–128. - PubMed
-
- Liu H, Liu Z, Jiang W, et al. Tuning the charge transfer properties by optimized donor –acceptor cocrystal for FET applications: from P type to N type. J Solid State Chem. 2019;274:47–51. doi:10.1016/j.jssc.2019.03.017 - DOI
MeSH terms
Substances
LinkOut - more resources
Full Text Sources
Other Literature Sources

