. 2021 Mar 2:15:580569.
doi: 10.3389/fnsys.2021.580569. eCollection 2021.

Adaptive Rewiring in Weighted Networks Shows Specificity, Robustness, and Flexibility

Affiliations

Adaptive Rewiring in Weighted Networks Shows Specificity, Robustness, and Flexibility

Ilias Rentzeperis et al. Front Syst Neurosci. .

Abstract

Brain network connections rewire adaptively in response to neural activity. Adaptive rewiring may be understood as a process which, at its every step, is aimed at optimizing the efficiency of signal diffusion. In evolving model networks, this amounts to creating shortcut connections in regions with high diffusion and pruning where diffusion is low. Adaptive rewiring leads over time to topologies akin to brain anatomy: small worlds with rich club and modular or centralized structures. We continue our investigation of adaptive rewiring by focusing on three desiderata: specificity of evolving model network architectures, robustness of dynamically maintained architectures, and flexibility of network evolution to stochastically deviate from specificity and robustness. Our adaptive rewiring model simulations show that specificity and robustness characterize alternative modes of network operation, controlled by a single parameter, the rewiring interval. Small control parameter shifts across a critical transition zone allow switching between the two modes. Adaptive rewiring exhibits greater flexibility for skewed, lognormal connection weight distributions than for normally distributed ones. The results qualify adaptive rewiring as a key principle of self-organized complexity in network architectures, in particular of those that characterize the variety of functional architectures in the brain.

Keywords: evolving network model; functional connectivity; hebbian plasticity; network diffusion; robustness; specificity; structural plasticity; structure function relation.


Conflict of interest statement

The authors declare that the research was conducted in the absence of any commercial or financial relationships that could be construed as a potential conflict of interest.

Figures

Figure 1
Figure 1
Adjacency matrices for two example networks evolving through adaptive rewiring with different values of τ. The smaller rewiring interval (τ = 3; upper row of adjacency matrices), produces a modular network, i.e., with dense connections within communities and sparse connections between them. The larger rewiring interval (τ = 4.5; lower row of adjacency matrices) has a different effect on the final rewired network; it gives rise to a centralized connectivity structure, where a few nodes have a large number of connections and the rest are sparsely connected or unconnected.
Figure 2
Figure 2
Modularity for both normal and lognormal networks grows as τ increases, but then decreases for larger τ values. (A) Q as a function of τ for prandom = 0. (B) Same as (A) for prandom = 0.2. Vertical lines indicate standard deviations from 100 instantiations of the rewiring algorithm.
Figure 3
Figure 3
For larger τ values, rewired networks have a large proportion of degree outliers from the mean with the majority of the nodes being sparsely connected and some heavily connected. (A) Proportion of nodes with outlier degrees as a function of τ for normal and lognormal networks. Vertical lines indicate the standard deviations from 100 instantiations of the rewiring algorithm. (B) The degree distribution for modular normal and lognormal networks (left to right; τnormal = 3, τlognormal = 4.5). Inset plots show the corresponding strength distributions. (C) Same as in (B), but for centralized networks (τnormal = 5, τlognormal = 7). In all cases prandom = 0.2. For (B,C) we took the aggregate of 1,000 rewiring instantiations and normalized them so that the sum of the proportions adds to 1.
Figure 4
Figure 4
Normal networks show a uniform modularity distribution and are more prone to connectivity transitions after slight perturbations to τtransition compared to lognormal ones which have a modularity distribution with a distinct peak. (A) Normal network. Modularity distributions for τ values at and near the transition point: (τtransition – 2δτ, τtransition – δτ, τtransition, τtransition + δτ, τtransition + 2δτ) = (3.95, 4.05, 4.15, 4.25, 4.35). For each τ we obtained 1,000 modularity values each corresponding to a different instantiation of the rewiring algorithm (B). Same as (A) for the lognormal network τ = (5.3, 5.4, 5.5, 5.6, 5.7).
Figure 5
Figure 5
The rewiring process for lognormal networks at τcentralized shows stability. (A) Scatter plot of the modularity values, Q, of networks after 4,000 rewirings at τmodularnormal = 3, τlognormal = 4.5) against those of their initial random configuration show no correlation. (B) Networks in the transition point (τnormal = 4.15, τlognormal = 5.5). Scatter plots show weak positive correlation. (C) For normal networks in the centralized regime there is still no correlation, however the modularity of the random network for lognormal networks is positively correlated with the final rewired network (τnormal = 5, τlognormal = 7), with a linear fit of slope 1 and intercept 0.
Figure 6
Figure 6
Robustness and specificity of the rewiring process depend on the value of τtest. The Q values of networks after 4,000 and 8,000 rewirings along with their linear fits are shown. For the first 4,000 rewirings τtransitionnormal = 4.15, τlognormal = 5.5) was used, for the subsequent 4,000 rewirings τtest. We collect data from 1,000 rewiring instantiations of a condition. In all cases prandom = 0.2. (A) τtest = τmodularnormal = 3, τlognormal = 4.5). (B) τtest = τmodular. (C) τtest = τcentralizednormal = 5, τlognormal = 7).
Figure 7
Figure 7
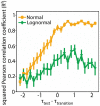
Lognormal networks show greater flexibility compared to normal networks. Squared Pearson correlation coefficient (R2) between Q4000 and Q8000 for different τtest values. We used bootstrapping to calculate the mean and standard deviation at each point. More specifically for each point we randomly selected 100 Q pairs (Q4000, Q8000) with replacement from a sample of 200 pairs and estimated R2. We repeated this process 1,000 times. We calculated the mean and standard deviation from this 1,000 generated data.

References

    1. Abbott L. F., Nelson S. B. (2000). Synaptic plasticity: taming the beast. Nat. Neurosci. 3, 1178–1183. 10.1038/81453 - DOI - PubMed
    1. Abdelnour F., Dayan M., Devinsky O., Thesen T., Raj A. (2018). Functional brain connectivity is predictable from anatomic network's Laplacian eigen-structure. NeuroImage 172, 728–739. 10.1016/j.neuroimage.2018.02.016 - DOI - PMC - PubMed
    1. Abdelnour F., Voss H. U., Raj A. (2014). Network diffusion accurately models the relationship between structural and functional brain connectivity networks. Neuroimage 90, 335–347. 10.1016/j.neuroimage.2013.12.039 - DOI - PMC - PubMed
    1. Albert R., Jeong H., Barabási A.-L. (2000). Error and attack tolerance of complex networks. Nature 406, 378–382. 10.1038/35019019 - DOI - PubMed
    1. Avena-Koenigsberger A., Misic B., Sporns O. (2018). Communication dynamics in complex brain networks. Nat. Rev. Neurosci. 19:17. 10.1038/nrn.2017.149 - DOI - PubMed

LinkOut - more resources