. 2021 Mar 2:12:617951.
doi: 10.3389/fimmu.2021.617951. eCollection 2021.

Framework for Characterizing Longitudinal Antibody Response in Children After Plasmodium falciparum Infection

Affiliations

Framework for Characterizing Longitudinal Antibody Response in Children After Plasmodium falciparum Infection

Eric Rogier et al. Front Immunol. .

Abstract

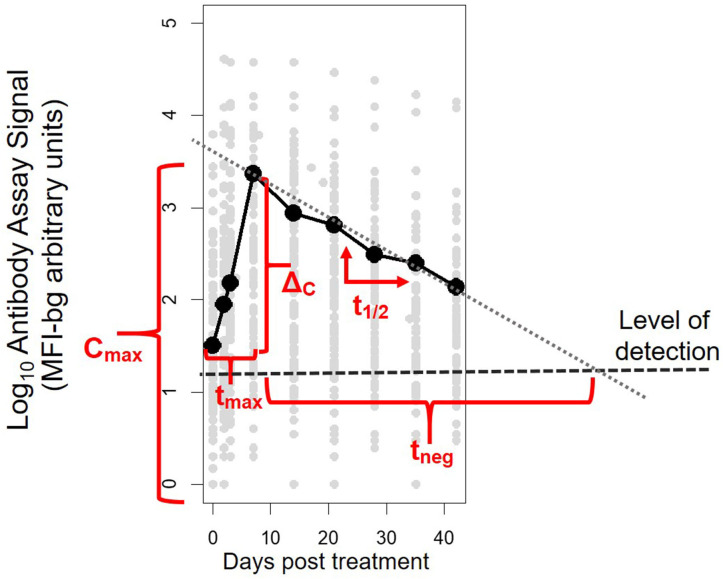
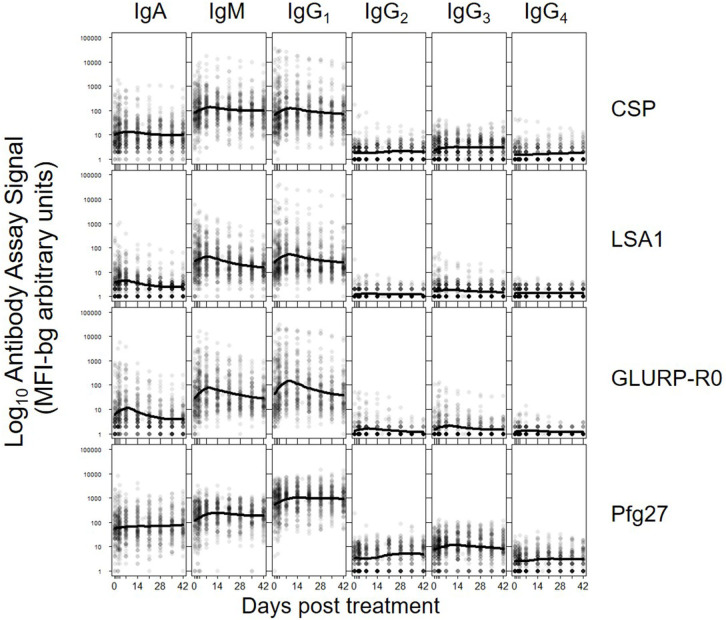
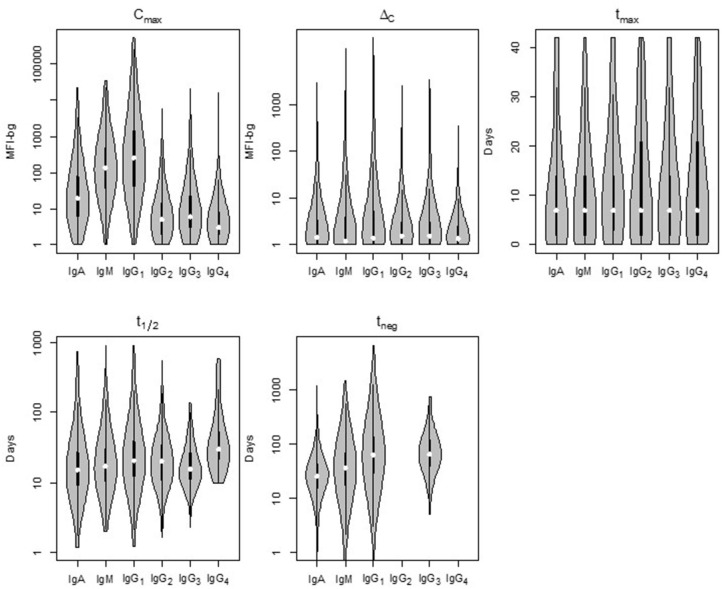
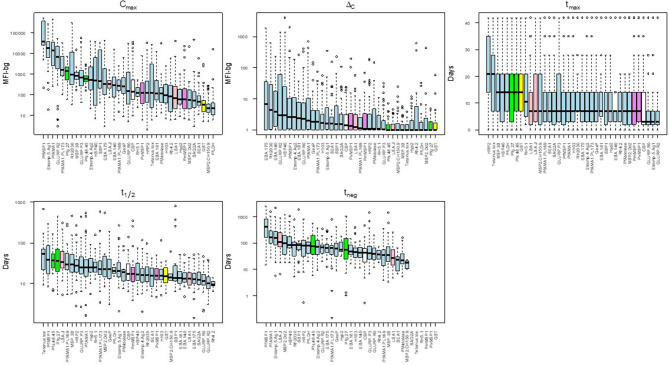
Human Plasmodium infection produces a robust adaptive immune response. Time courses for 104 children followed for 42 days after initiation of Plasmodium falciparum chemotherapy were assayed for antibody levels to the five isotypes of human immunoglobulins (Ig) and 4 subclasses of IgG for 32 P. falciparum antigens encompassing all 4 parasite stages of human infection. IgD and IgE against these antigens were undetectable at 1:100 serum concentration, but other Ig isotypes and IgG subclasses were consistently observed against all antigens. Five quantitative parameters were developed to directly compare Ig response among isotypes and antigens: Cmax, maximum antibody level; ΔC, difference between Cmax and the antibody level at Day 0; tmax, time in days to reach Cmax; t1/2, Ig signal half-life in days; tneg, estimated number of days until complete loss of Ig signal. Classical Ig patterns for a bloodborne pathogen were seen with IgM showing early tmax and IgG production highest among Ig isotypes. However, some unexpected trends were observed such as IgA showing a biphasic pattern for many antigens. Variability among these dynamics of Ig acquisition and loss was noted for different P. falciparum antigens and able to be compared both quantitatively and statistically. This parametrization methodology allows direct comparison of Ig isotypes produced against various Plasmodium antigens following malaria infection, and the same methodology could be applied to other longitudinal serologic studies from P. falciparum or different pathogens. Specifically for P. falciparum seroepidemiological studies, reliable and quantitative estimates regarding the IgG dynamics in human populations can better optimize modeling efforts for serological outputs.

Keywords: Plasmodium faciparum; antibody classes; antibody dynamics; antigens; malaria.


Conflict of interest statement

The authors declare that the research was conducted in the absence of any commercial or financial relationships that could be construed as a potential conflict of interest.

Figures

Figure 1
Figure 1
Illustrative example of the five parameters created to characterize post-treatment antibody (Ab) dynamics to Plasmodium antigens for each individual. The parameters represent: Cmax, maximum Ab signal; ΔC, maximum change in Ab signal; tmax, time to maximum Ab signal; t1/2, half-life of Ab signal (in days) after maximum signal has been reached; and tneg, modeled time until signal is reduced to below the level of detection of the assay.
Figure 2
Figure 2
Post-treatment dynamics of antibodies stratifying by Ig isotype/subclass to: sporozoite- stage CSP, hepatic-stage LSA1, erythrocytic-stage GLURP-R0 and sexual-stage Pfg27. Points on each plot represent individual sample assay signals, and solid lines represents LOESS fitting to all assay signal data for the specific antigen and Ig class/subclass. Plots for all Igs against all antigens shown in Supplementary Figure 2.
Figure 3
Figure 3
Distribution of the five post-treatment clearance parameters by Ig isotype/subclass for antibodies to malaria antigens in Angolan children treated for Plasmodium falciparum malaria. Violin plots display data for all P. falciparum antigens with the median estimate as a white point, black bars as the interquartile range (IQR), and whiskers extending 1.5 × IQR. Plots occasionally do not exist for IgG2 and/or IgG4 as not enough children samples provided quantifiable assay signals for these subclasses. Statistical comparison among isotypes shown in Supplementary Table 2. MFI-bg: median fluorescence intensity minus background assay signal.
Figure 4
Figure 4
Distribution of acquisition and decay parameters for IgG1 to different antigens in Angolan children treated for malaria. Antigens are color-coded by category: sporozoite (white), hepatic (pink), erythrocytic (blue), gametocyte (green), non-falciparum Plasmodium (violet) and other control (yellow). Boxplots display median as black solid line with box length representing interquartile range (IQR) and whiskers 1.5 × IQR. Outliers above or below 1.5 × IQR represented as circles. MFI-bg: median fluorescence intensity-background. Plots for parameter estimates for IgM, IgA, and IgG3 shown in Supplementary Figures 3–5, respectively.

References

    1. Outlaw DC, Ricklefs RE. Rerooting the evolutionary tree of malaria parasites. Proc Natl Acad Sci USA. (2011) 108:13183–7. 10.1073/pnas.1109153108 - DOI - PMC - PubMed
    1. Bensch S, Hellgren O, Krizanauskiene A, Palinauskas V, Valkiunas G, Outlaw D, et al. . How can we determine the molecular clock of malaria parasites? Trends Parasitol. (2013) 29:363–9. 10.1016/j.pt.2013.03.011 - DOI - PubMed
    1. Tse EG, Korsik M, Todd MH. The past, present and future of anti-malarial medicines. Malar J. (2019) 18:93. 10.1186/s12936-019-2724-z - DOI - PMC - PubMed
    1. Kwiatkowski DP. How malaria has affected the human genome and what human genetics can teach us about malaria. Am J Hum Genet. (2005) 77:171–92. 10.1086/432519 - DOI - PMC - PubMed
    1. Stevenson MM, Riley EM. Innate immunity to malaria. Nat Rev Immunol. (2004) 4:169–80. 10.1038/nri1311 - DOI - PubMed

Publication types

LinkOut - more resources