. 2021 Feb 18:24:79-91.
doi: 10.1016/j.omtn.2021.02.015. eCollection 2021 Jun 4.

AhR/miR-23a-3p/PKCα axis contributes to memory deficits in ovariectomized and normal aging female mice

Affiliations

AhR/miR-23a-3p/PKCα axis contributes to memory deficits in ovariectomized and normal aging female mice

Shuai Zhang et al. Mol Ther Nucleic Acids. .

Abstract

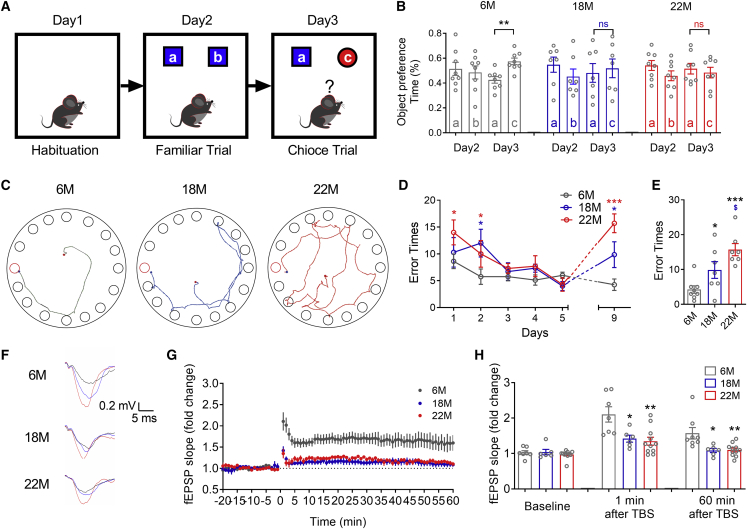
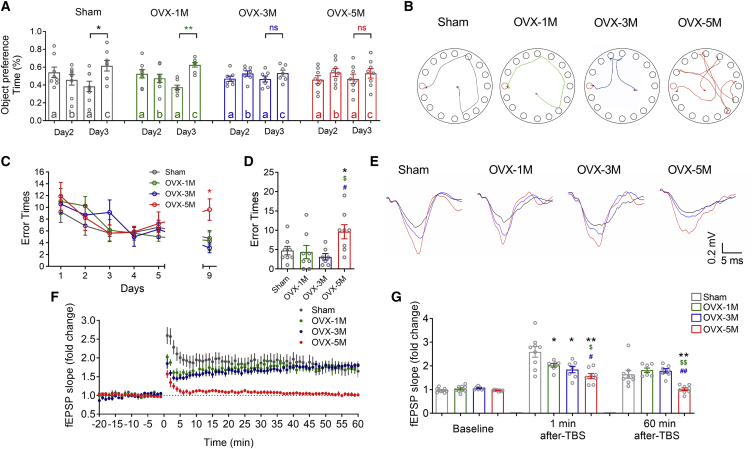
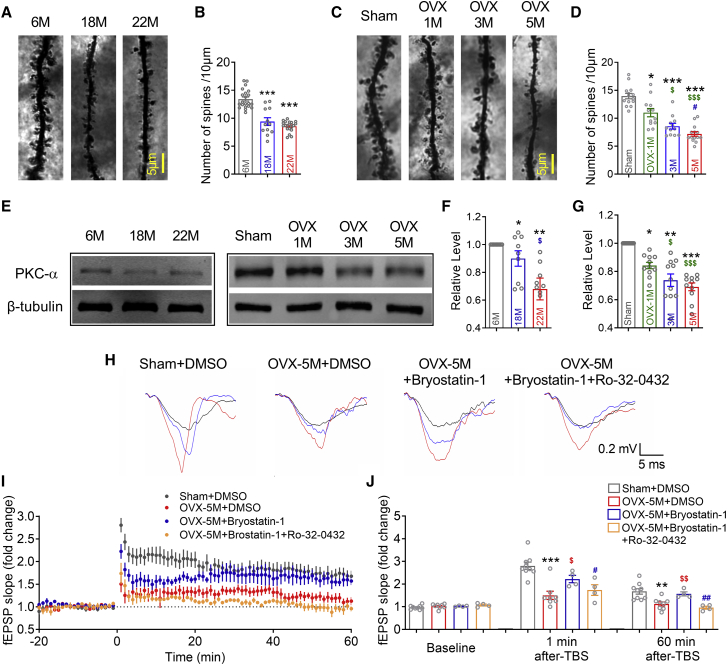
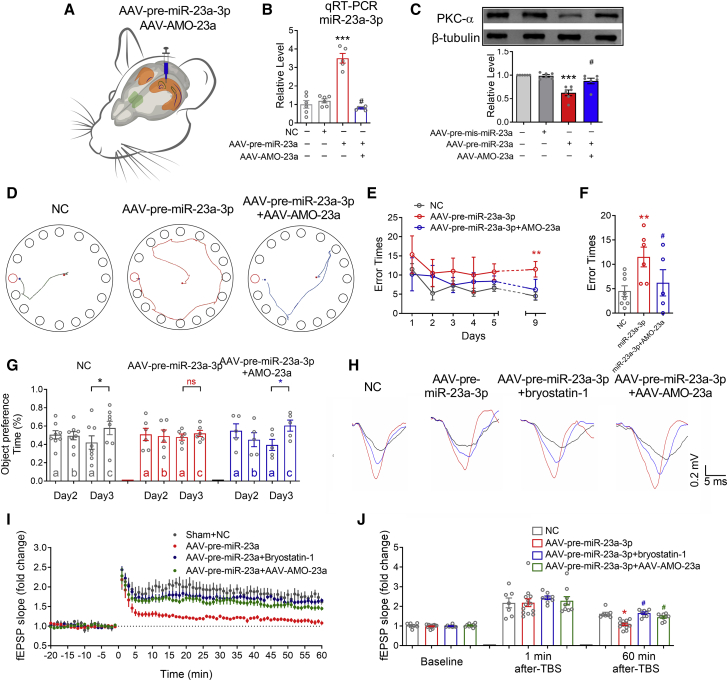
The mechanism of estrogen deficiency-induced cognitive impairment is still not fully elucidated. In this study, we assessed the effect of microRNA (miRNA) on the memory of long-term estrogen-deficient mice after ovariectomy (OVX) and normal aging. We observed that 5-month OVX and 22-month-old normal aging female mice showed significantly impaired spatial and object recognition memory, declined hippocampal long-term potentiation (LTP), and decreased hippocampal protein kinase C α (PKCα) protein. Quantitative real-time PCR analysis showed upregulated miRNA-23a-3p (miR-23a-3p) in the hippocampus of 5-month OVX and 22-month-old female mice. In vitro, overexpression of miR-23a-3p downregulated PKCα by binding the 3¢ UTRs of Prkca mRNAs, which was prevented by its antisense oligonucleotide AMO-23a. In vivo, adeno-associated virus-mediated overexpression of miR-23a-3p (AAV-pre-miR-23a-3p) suppressed hippocampal PKCα and impaired the memory of mice. Chromatin immunoprecipitation analysis showed that aryl hydrocarbon receptor (AhR) binds the promoter region of miR-23a-3p. The AhR-dependent downregulation of PKCα could be prevented by AMO-23a as well. Furthermore, knockdown of miR-23a-3p using AAV-AMO-23a rescued the cognitive and electrophysiological impairments of OVX and normal aging female mice. We conclude that long-term estrogen deficiency impairs cognition and hippocampal LTP by activating the AhR/miR-23a-3p/PKCα axis. The knockdown of miR-23a-3p may be a potentially valuable therapeutic strategy for estrogen deficiency-induced memory deficits.

Keywords: OVX; PKCα; aging; aryl hydrocarbon receptor; memory; miR-23a-3p.


Conflict of interest statement

The authors declare no competing interests.

Figures

None
Graphical abstract
Figure 1
Figure 1
Age-dependent impairments of cognition and synaptic plasticity in female aging mice (A) Diagram showing the procedure of the object recognition test. (B) Object preference calculated from exploring time for 6- (n = 8), 18- (n = 7), and 22- (n = 8) month-old mice. ∗∗p < 0.01 versus familiar object; ns, no statistical significance. (C) Representative path tracings of the probe test on day 9 in the Barnes maze test for each group. Typical exploring patterns indicated tending to the escape hole in 6-month-old mice, while random-type exploring paths were found in 18- and 22-month-old mice. (D) Comparison of average error times to find the escape hole for 6- (n = 8), 18- (n = 7), and 22- (n = 8) month-old mice on training days 1–6 and probe test day 9. (E) Bar graph showing comparison of average error times to find the escape hole for 6-, 18-, and 22-month-old mice on probe test day 9. (F) Sample hippocampal fEPSP traces of 6-, 18-, and 22-month-old mice during LTP. The black, red, and blue traces reflect the fEPSP at baseline, 1 min, and 60 min after TBS. (G) Time course graph showing recordings of C/A LTP. C/A fEPSPs exhibited a robust potentiation in the 6-month-old mice (n = 7) and mild potentiation in the 18- (n = 6) and 22- (n = 11) month-old mice. (H) Summary of the changes in C/A fEPSP slopes of 6-, 18-, and 22-month-old mice at baseline, 1 min, and 60 min after TBS. ∗p < 0.05 versus 6-month-old mice, ∗∗p < 0.01 versus 6-month-old mice, ∗∗∗p < 0.001 versus 6-month-old mice, $p < 0.05 versus 18-month-old mice; ns, no statistical significance. Data in all graphs are presented as mean ± SEM.
Figure 2
Figure 2
Long-term estrogen deficiency impairs the cognition of mice (A) Object preference calculated from exploring time for Sham (n = 8), 1- (n = 8), 3- (n = 7), and 5- (n = 8) month OVX mice. ∗p < 0.05 versus familiar object, ∗∗p < 0.01 versus familiar object; ns, no statistical significance. (B) Representative path tracings of the probe test on day 9 in the Barnes maze test for each group. Typical exploring patterns indicated tending to the escape hole in Sham and 1 or 3 months after OVX surgery, while random-type exploring paths were found 5 months after OVX surgery. (C) Comparison of average error times to find the escape hole for Sham (n = 8), 1- (n = 8), 3- (n = 7), and 5- (n = 8) month OVX mice on training days 1–6 and probe test day 9. (D) Bar graph showing comparison of average error times to find the escape hole for Sham group and OVX group on probe test day 9. (E) Sample hippocampal fEPSP traces of Sham, 1- , 3- , and 5-month OVX mice during LTP. The black, red, and blue traces reflect the fEPSP at baseline, 1 min, and 60 min after TBS. (F) Time course graph showing recordings of C/A LTP. C/A fEPSPs exhibited a robust potentiation of Sham (n = 9) and 1- (n = 7), and 3- (n = 7) month OVX mice and mild potentiation in the 5-month (n = 8) OVX mice. (G) Summary of the changes in C/A fEPSP slopes of Sham and 1-, 3-, and 5-month OVX mice at baseline, 1 min of TBS, and 60 min after TBS. ∗p < 0.05 versus Sham mice, ∗∗p < 0.01 versus Sham mice, $p < 0.05 versus 1-month OVX mice, $$p < 0.01 versus 1-month OVX mice, #p < 0.05 versus 3-month OVX mice, ##p < 0.01 versus 3-month OVX mice; ns, no statistical significance. Data in all graphs are presented as mean ± SEM.
Figure 3
Figure 3
Long-term estrogen deficiency induces hippocampal PKCα loss of function (A and B) Number of dendritic spines in CA1 region of 6- (n = 21), 18- (n = 12), and 22- (n = 22) month-old mice. ∗∗∗p < 0.001 versus 6-month-old mice. (C and D) Number of dendritic spines in CA1 region of Sham and 1-, 3-, and 5-month OVX mice. ∗p < 0.05 versus Sham mice, ∗∗∗p < 0.001 versus Sham mice, $p < 0.05 versus 1-month OVX mice, $$$p < 0.001 versus 1-month OVX mice, # p < 0.05 versus 3-month OVX mice. n = 12 neurons for each group. (E–G) western blot analysis with the hippocampus in 6- (n = 9), 18- (n = 9), and 22- (n = 9) month-old mice and Sham (n = 11), 1-month (n = 11), 3-month (n = 11), and 5-month (n = 11) OVX mice. ∗p < 0.05 versus 6M/Sham mice, ∗p < 0.01 versus 6-month-old/Sham mice, ∗∗∗p < 0.001 versus 6-month-old/Sham mice, $p < 0.05 versus 18-month-old mice or 1-month OVX mice, $$$p < 0.001 versus 1-month OVX mice. (E) Representative immunoblotting images of PKCα and β-tubulin. (F and G) The digital data of the immunoblotting analysis. The optical density was evaluated for each band and normalized to 6-month-old/Sham mice after correction for protein loading with β-tubulin. (H) Sample fEPSP traces of Sham + DMSO, 5-month OVX + DMSO, 5-month OVX + bryostatin-1, and 5-month OVX + bryostatin-1 + Ro32-0432 hippocampal slices during LTP. The black, red, and blue traces reflect the fEPSP at baseline, 1 min, and 60 min after TBS. (I) Time course graph showing the C/A LTP of Sham + DMSO (n = 9), 5-month OVX + DMSO (n = 8), 5-month OVX + bryostatin-1 (n = 4), and 5-month OVX + bryostatin-1 + Ro32-0432 (n = 4) hippocampal slices. (J) Summary of the changes in C/A fEPSP slopes of Sham + DMSO, 5-month OVX + DMSO, 5-month OVX + bryostatin-1, and 5-month OVX + bryostatin-1 + Ro32-0432 hippocampal slices at baseline, 1 min of TBS, and 60 min after TBS. ∗∗p < 0.01 versus Sham + DMSO, ∗∗∗p < 0.001 versus Sham + DMSO, $p < 0.05 versus 5-month OVX + DMSO, $$p < 0.01 versus 5-month OVX + DMSO, #p < 0.05 versus 5-month OVX + bryostatin-1, ##p < 0.01 versus 5-month OVX + bryostatin-1. Data in all graphs are presented as mean ± SEM.
Figure 4
Figure 4
PKCα is a potential target of miR-23a-3p (A) Complementarity between the miR-23a-3p seed sequence (5¢ end ~2–7 nucleotides) and the 3¢ UTR of mouse Prkca gene as predicted by a computational and bioinformatics-based approach using the TargetScan 5.1 algorithm. Watson-Crick complementarity is marked by a red color. (B) The levels of miR-23a-3p in the hippocampus of Sham and OVX mice as assessed by quantitative real-time PCR. ∗p < 0.05 versus Sham mice, ∗∗p < 0.01 versus Sham mice, $p < 0.05 versus 1-month OVX mice. n = 6 mice for each group. (C) The levels of miR-23a-3p in the hippocampus of 6-, 18-, and 22-month-old female mice as assessed by quantitative real-time PCR. ∗∗∗p < 0.001 versus 6-month-old mice, $$$p < 0.001 versus 18-month-old mice. n = 6 mice for each group. (D) The mechanism of the luciferase assay. The full-length 3¢ UTR of Prkca was amplified by PCR and cloned into the psiCHECK-2-control vector. (E and F) Luciferase reporter gene assay for interactions between miR-23a-3p and its binding site (E) and the mutated binding site (F) in the 3¢ UTR of the Prkca gene in HEK293T cells. HEK293T cells were transfected with psiCHECK-2 vector, miR-23a-3p mimics, AMO-23a, or negative control siRNAs (mis-miR-23a-3p and mis-AMO-23a) using Lipofectamine 2000. ∗∗∗p < 0.001 versus psiCHECK-2-control vector; #p < 0.05 versus miR-23a-3p; ns, no statistical significance. n = 3 batches of cells for each group. (G) Schematic diagram of miR-23a-3p silencing using antisense antagonist. miR-23a-3p binds to complementary target sites in the 3¢ UTRs of Prkca gene, which could be blocked by its antisense antagonist AMO-23a. (H) Expression of PKCα protein in primary cultured neurons was downregulated by miR-23a-3p determined by western blot analysis. ∗p < 0.05 versus mis-miR-23a-3p, #p < 0.05 versus miR-23a-3p. n = 3 batches of cells for each group. Data in all graphs are presented as mean ± SEM.
Figure 5
Figure 5
MiR-23a-3p gain of function impairs cognition and hippocampal synaptic plasticity of mice (A) Schematic diagram of stereotactic adeno-associated virus injection into CA1 region of hippocampus. (B) The levels of miR-23a-3p in the hippocampus of AAV-NC-, AAV-pre-miR-23a-3p-, and AAV-pre-miR-23a-3p + AAV-AMO-23a-injected mice as assessed by quantitative real-time PCR. n = 6 mice for each group. (C) miR-23a-3p gain of function by injection of AAV-pre-miR-23a-3p represses the protein level of PKCα in hippocampi, which was prevented by AAV-AMO-23a. n = 6 mice for each group. (D) Representative path tracings of the probe test on day 9 in the Barnes maze test for each group. (E) Comparison of average error times to find the escape hole for AAV-NC (n = 8)-, AAV-pre-miR-23a-3p (n = 6)-, and AAV-pre-miR-23a-3p + AAV-AMO-23a (n = 5)-injected mice on training days 1–6 and probe test day 9. (F) Bar graph showing comparison of average error times to find the escape hole for AAV-NC-, AAV-pre-miR-23a-3p-, and AAV-pre-miR-23a-3p + AAV-AMO-23a-injected mice on probe test day 9. (G) Object preference calculated from exploring time for AAV-NC (n = 8)-, AAV-pre-miR-23a-3p (n = 6)-, and AAV-pre-miR-23a-3p + AAV-AMO-23a (n = 5)-injected mice. ∗p < 0.05 versus familiar object; ns, no statistical significance. (H) Sample hippocampal fEPSP traces of AAV-NC-, AAV-pre-miR-23a-3p-, AAV-pre-miR-23a-3p + bryostatin-1-, and AAV-pre-miR-23a-3p + AAV-AMO-23a-injected mice during LTP. The black, red, and blue traces reflect the fEPSP at baseline, 1 min, and 60 min after TBS. (I) Time course graph showing the C/A LTP of AAV-NC (n = 7)-, AAV-pre-miR-23a-3p (n = 12)-, AAV-pre-miR-23a-3p + bryostatin-1 (n = 8)-, and AAV-pre-miR-23a-3p + AAV-AMO-23a (n = 9)-injected mice. (J) Summary of the changes in C/A fEPSP slopes of AAV-NC-, AAV-pre-miR-23a-3p-, AAV-pre-miR-23a-3p + bryostatin-1-, and AAV-pre-miR-23a-3p + AAV-AMO-23a-injected mice at baseline, 1 min after TBS, and 60 min after TBS. ∗p < 0.05 versus AAV-NC mice, ∗∗p < 0.01 versus AAV-NC mice, ∗∗∗p < 0.001 versus AAV-NC mice, #p < 0.05 versus AAV-pre-miR-23a-3p mice; ns, no statistical significance. Data in all graphs are presented as mean ± SEM.
Figure 6
Figure 6
AhR regulates miR-23a-3p transcription (A) Schematic representation of the upstream region of the mouse miR-23a-3p. The conservative AhR targeting sites are marked by a box. The primers for ChIP assay are underlined. (B–E) ChIP analysis of AhR binding to the promoter between −5,873 and −37 bp. ChIP assay was performed with hippocampal neuron. The anti-IgG antibody and no antibody treatments were used as negative control. The anti-AhR antibody was used to target specific immunoprecipitation. AhR binding to these target sites activates miR-23a-3p promoter activity. Bottom panels: qPCR analysis of AhR binding sequences (n = 3). (F and G) Top panels: Representative immunoblotting images of nuclear AhR and laminB1. Bottom panels: The digital data of the immunoblotting analysis. The optical density was evaluated for each band and normalized to 6M/Sham mice after correction for protein loading with laminB1. ∗p < 0.05 versus 6-month-old/Sham mice, ∗∗p < 0.01 versus 6-month-old/Sham mice, ∗∗∗p < 0.001 versus 6-month-old/Sham mice, $p < 0.05 versus 18-month-old/OVX-1-month-old mice, $$p < 0.01 versus 18-month-old/OVX-1 month mice. n = 6 mice for each group. (H) Downregulation of PKCα protein expression induced by PCB-126, which was reversed by AMO-23a transfection. ∗p < 0.05 versus DMSO-treated neuron, #p < 0.05 versus PCB-126-treated neuron. n = 3 batches of cells for each group. Data in all graphs are presented as mean ± SEM.
Figure 7
Figure 7
Knockdown of miR-23a-3p rescues cognition and hippocampal synaptic plasticity of 5-month OVX mice (A) Schematic diagram of stereotactic adeno-associated virus injection into CA1 region of hippocampus. (B) The levels of miR-23a-3p in the hippocampus of Sham (n = 6), Sham + AAV-mis-AMO-23a (n = 6), OVX-5M + AAV-mis-AMO-23a (n = 6), and OVX-5M + AAV-AMO-23a (n = 5) mice as assessed by quantitative real-time PCR. (C) Knockdown of miR-23a-3p by injection of AAV-AMO-23a rescues the protein level of hippocampal PKCα in 5-month OVX mice. n = 6 mice for each group. (D) Representative path tracings of the probe test on day 9 in the Barnes maze test for each group. (E) Comparison of average error times to find the escape hole for Sham + AAV-mis-AMO-23a mice (n = 8), OVX + AAV-mis-AMO-23a mice (n = 8), and OVX + AAV-AMO-23a mice (n = 7) on training days 1–6 and probe test day 9. (F) Bar graph showing comparison of average error times to find the escape hole for Sham + AAV-mis-AMO-23a mice, OVX + AAV-mis-AMO-23a mice, and OVX + AAV-AMO-23a mice on probe test day 9. (G) Object preference calculated from exploring time for Sham+AAV-mis-AMO-23a mice (n = 8), OVX + AAV-mis-AMO-23a mice (n = 8), and OVX + AAV-AMO-23a (n = 7) mice. ∗∗∗p < 0.001 versus familiar object; ns, no statistical significance. (H) Sample hippocampal fEPSP traces of Sham + AAV-mis-AMO-23a, OVX + AAV-mis-AMO-23a, and OVX + AAV-AMO-23a mice during LTP. The black, red, and blue traces reflect the fEPSP at baseline, 1 min, and 60 min after TBS. (I) Time course graph showing the C/A LTP of Sham + AAV-mis-AMO-23a mice (n = 8), OVX + AAV-mis-AMO-23a mice (n = 7), and OVX + AAV-AMO-23a mice (n = 11). (J) Summary of the changes in C/A fEPSP slopes of Sham + AAV-mis-AMO-23a mice, OVX + AAV-mis-AMO-23a mice, and OVX + AAV-AMO-23a mice at baseline, 1 min after TBS, and 60 min after TBS. ∗p < 0.05 versus Sham + AAV-mis-AMO-23a mice, ∗∗∗p < 0.001 versus Sham + AAV-mis-AMO-23a mice, #p < 0.05 versus OVX-5M + AAV-mis-AMO-23a mice; ns:, no statistical significance. Data in all graphs are presented as mean ± SEM.
Figure 8
Figure 8
Knockdown of miR-23a-3p rescues cognition and hippocampal synaptic plasticity of aging female mice (A) The levels of miR-23a-3p in the hippocampus of 6M (n = 6), 6M + AAV-mis-AMO-23a (n = 6), 22-month-old + AAV-mis-AMO-23a (n = 6), and 22-month-old + AAV-AMO-23a (n = 5) mice were assessed by quantitative real-time PCR. (B) Knockdown of miR-23a-3p by injection of AAV-AMO-23a rescues the protein level of hippocampal PKCα in 22-month-old female mice. n = 6 mice for each group. (C) Representative path tracings of the probe test on day 9 in the Barnes maze test for each group. (D) Comparison of average error times to find the escape hole for 6-month-old + AAV-mis-AMO-23a, 22-month-old + AAV-mis-AMO-23a, and 22-month-old + AAV-AMO-23a mice on training days 1–6 and probe test day 9. (E) Bar graph showing comparison of average error times to find the escape hole for 6-month-old + AAV-mis-AMO-23a (n = 8), 22-month-old + AAV-mis-AMO-23a (n = 7), and 22-month-old + AAV-AMO-23a (n = 5) mice on training days 1–6 and probe test day 9. (F) Sample hippocampal fEPSP traces of 6-month-old + AAV-mis-AMO-23a, 22-month-old + AAV-mis-AMO-23a, and 22-month-old + AAV-AMO-23a mice during LTP. The black, red, and blue traces reflect the fEPSP at baseline, 1 min, and 60 min after TBS. (G) Time course graph showing the C/A LTP of 6-month-old + AAV-mis-AMO-23a (n = 7), 22-month-old + AAV-mis-AMO-23a (n = 8), and 22-month-old + AAV-AMO-23a (n = 7) mice. (I) Summary of the changes in C/A fEPSP slopes of 6-month-old + AAV-mis-AMO-23a, 22-month-old + AAV-mis-AMO-23a, and 22-month-old + AAV-AMO-23a mice at baseline, 1 min after TBS, and 60 min after TBS. ∗p < 0.05 versus 6-month-old + AAV-mis-AMO-23a mice, ∗∗p < 0.01 versus 6-month-old + AAV-mis-AMO-23a mice, #p < 0.05 versus 22-month-old + AAV-mis-AMO-23a mice; ns, no statistical significance. Data in all graphs are presented as mean ± SEM.

Similar articles

Cited by

References

    1. Luine V.N., Frankfurt M. Estrogens facilitate memory processing through membrane mediated mechanisms and alterations in spine density. Front. Neuroendocrinol. 2012;33:388–402. - PMC - PubMed
    1. Hamson D.K., Roes M.M., Galea L.A. Sex Hormones and Cognition: Neuroendocrine Influences on Memory and Learning. Compr. Physiol. 2016;6:1295–1337. - PubMed
    1. Yun J., Yeo I.J., Hwang C.J., Choi D.Y., Im H.S., Kim J.Y., Choi W.R., Jung M.H., Han S.B., Hong J.T. Estrogen deficiency exacerbates Aβ-induced memory impairment through enhancement of neuroinflammation, amyloidogenesis and NF-κB activation in ovariectomized mice. Brain Behav. Immun. 2018;73:282–293. - PubMed
    1. Lobo R.A. Hormone-replacement therapy: current thinking. Nat. Rev. Endocrinol. 2017;13:220–231. - PubMed
    1. Fioravante D., Chu Y., de Jong A.P., Leitges M., Kaeser P.S., Regehr W.G. Retraction. eLife. 2018;7:e35974. - PMC - PubMed