. 2021 Mar 2:11:619242.
doi: 10.3389/fonc.2021.619242. eCollection 2021.

The Identification and Validation of Two Heterogenous Subtypes and a Risk Signature Based on Ferroptosis in Hepatocellular Carcinoma

Affiliations

The Identification and Validation of Two Heterogenous Subtypes and a Risk Signature Based on Ferroptosis in Hepatocellular Carcinoma

Zaoqu Liu et al. Front Oncol. .

Abstract

Background: Ferroptosis is essential for tumorigenesis and progression of hepatocellular carcinoma (HCC). The heterogeneity of ferroptosis and its relationship with tumor microenvironment (TME) have still remain elusive.

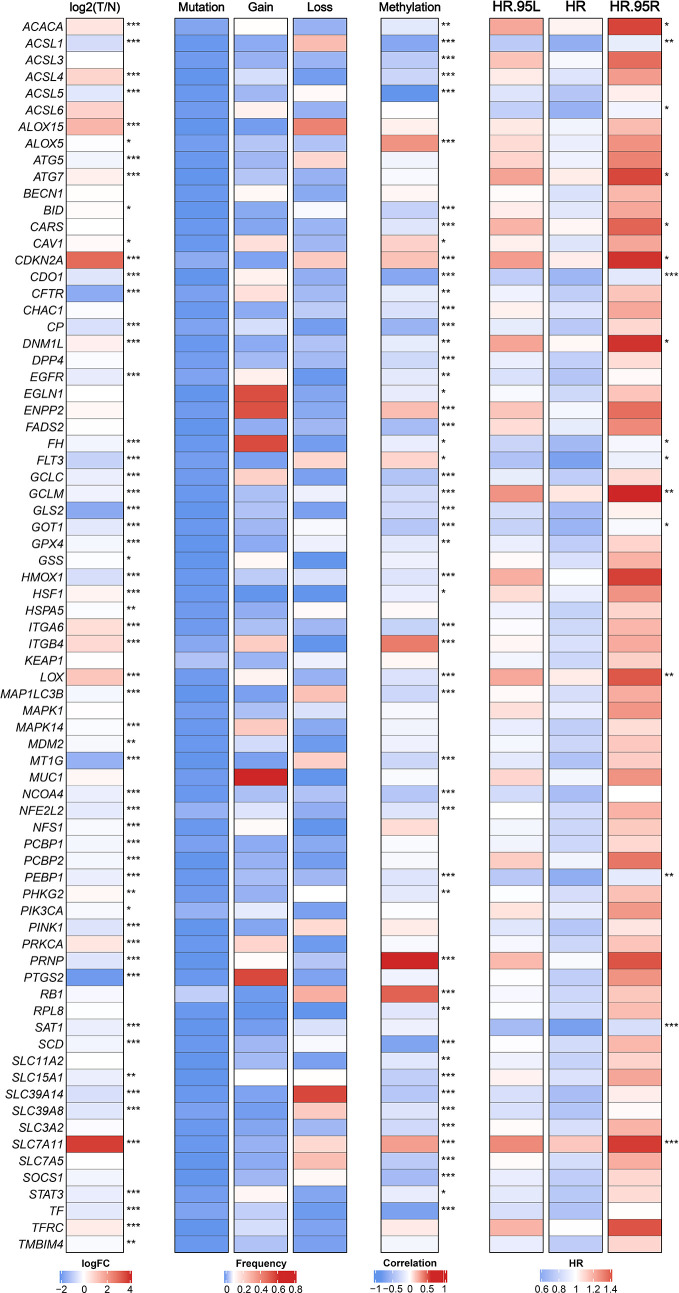
Methods: Based on 74 ferroptosis related genes (FRGs) and 3,933 HCC samples from 32 datasets, we comprehensively explored the heterogenous ferroptosis subtypes. The clinical significance, functional status, immune infiltration, immune escape mechanisms, and genomic alterations of different subtypes were further investigated.

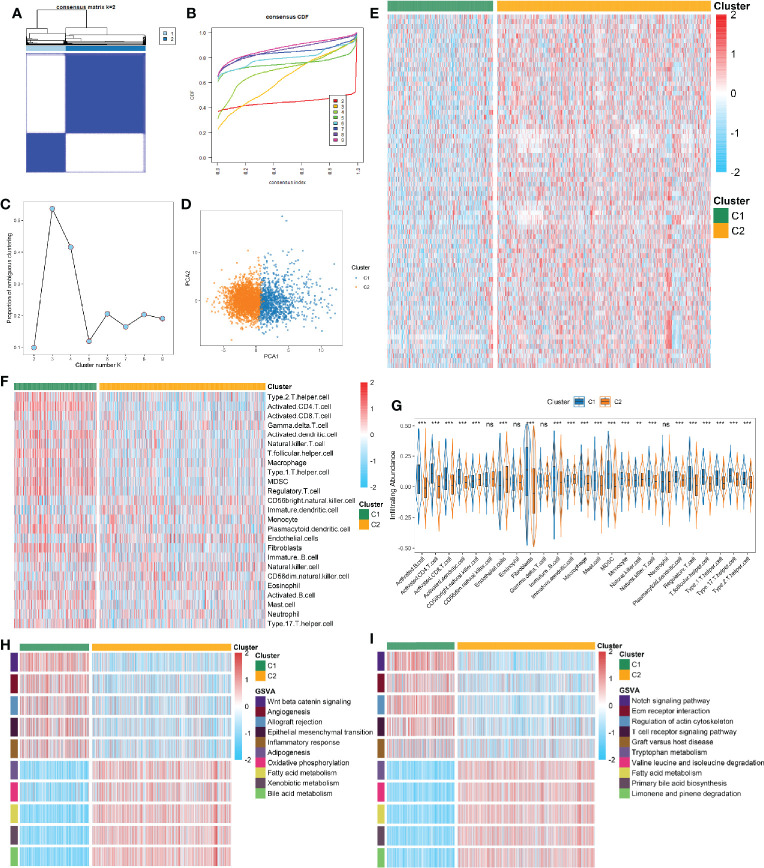
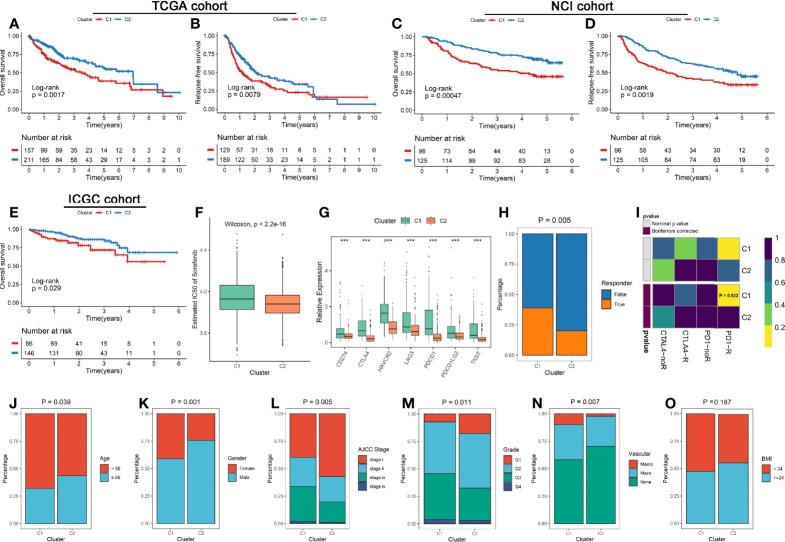
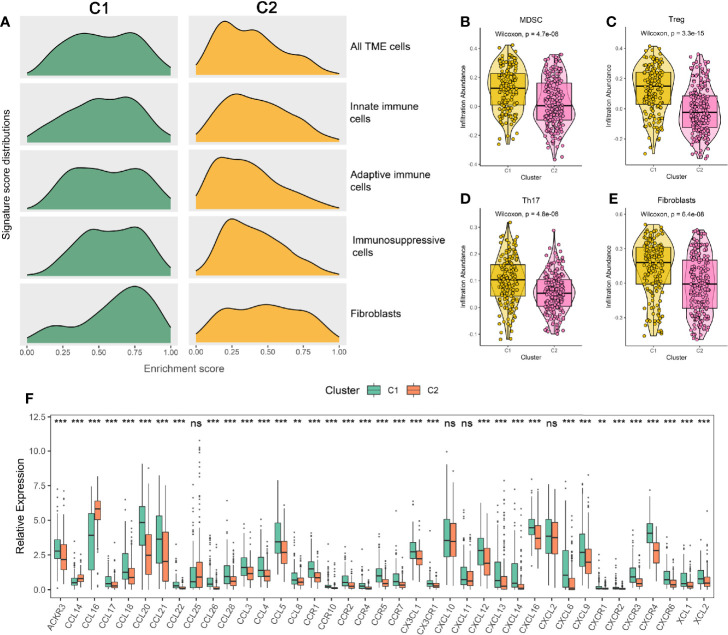
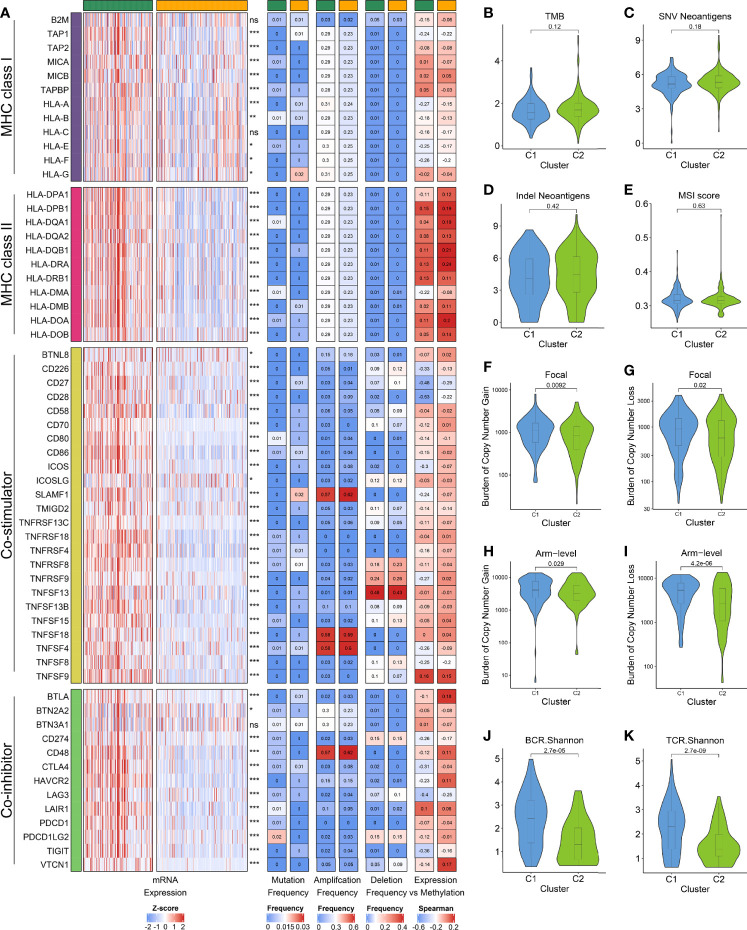
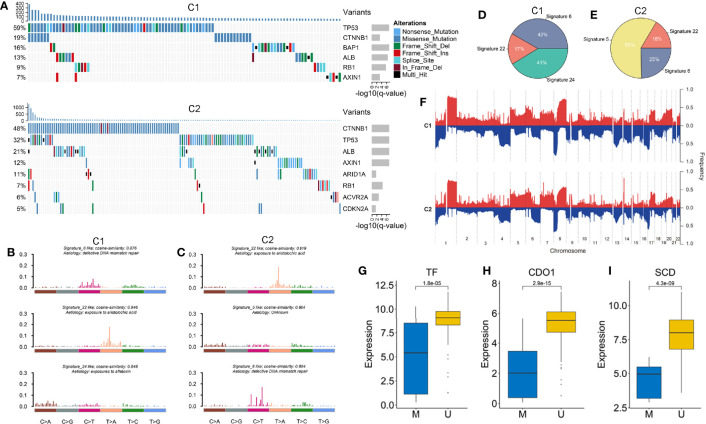
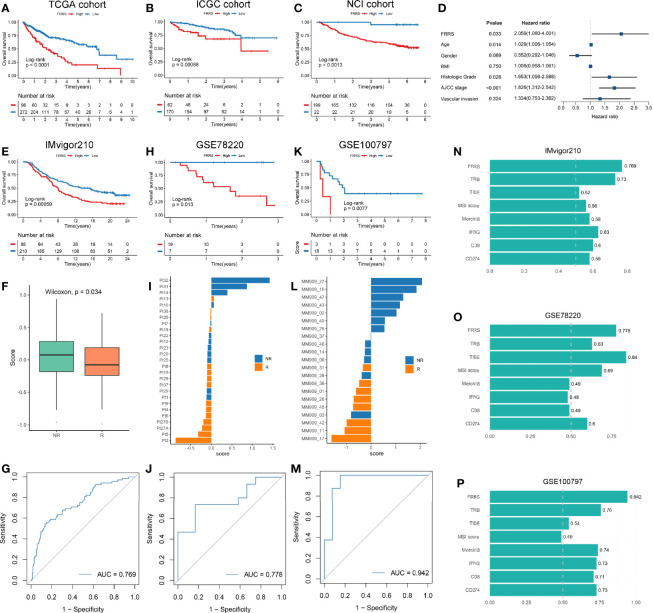
Results: We identified and validated two heterogeneous ferroptosis subtypes: C1 was metabolismlowimmunityhigh subtype and C2 was metabolismhighimmunitylow subtype. Compared to C2, C1 owned worse prognosis, and C1 tended to occur in the patients with clinical characteristics such as younger, female, advanced stage, higher grade, vascular invasion. C1 and C2 were more sensitive to immunotherapy and sorafenib, respectively. The immune escape mechanisms of C1 might be accumulating more immunosuppressive cells, inhibitory cytokines, and immune checkpoints, while C2 was mainly associated with inferior immunogenicity, defecting in antigen presentation, and lacking leukocytes. In addition, C1 was characterized by BAP1 mutation, MYC amplification, and SCD1 methylation, while C2 was characterized by the significant alterations in cell cycle and chromatin remodeling processes. We also constructed and validated a robust and promising signature termed ferroptosis related risk score (FRRS) for assessing prognosis and immunotherapy.

Conclusion: We identified and validated two heterogeneous ferroptosis subtypes and a reliable risk signature which used to assess prognosis and immunotherapy. Our results facilitated the understood of ferroptosis as well as clinical management and precise therapy of HCC.

Keywords: ferroptosis; hepatocellular carcinoma; immunotherapy; molecular subtype; tumor microenvironment.


Conflict of interest statement

The authors declare that the research was conducted in the absence of any commercial or financial relationships that could be construed as a potential conflict of interest.

Figures

Figure 1
Figure 1
The expression, genomic variation and hazard ratios of FRGs in TCGA-LIHC. From left to right panel, the expression difference of FRGs in tumor tissues compared with normal tissues, the mutation and copy number variation frequency of FRGs, the correlation of DNA methylation modifications and expression for FRGs, and univariate Cox regression analysis presented hazard ratios of FRGs. *p < 0.05, **p < 0.01, ***p < 0.001.
Figure 2
Figure 2
(A) The consensus score matrix of all samples when k = 2. A higher consensus score between two samples indicates they are more likely to be grouped into the same cluster in different iterations. (B) The cumulative distribution functions of consensus matrix for each k (indicated by colors). (C) The proportion of ambiguous clustering (PAC) score, a low value of PAC implies a flat middle segment, allowing conjecture of the optimal k (k = 2) by the lowest PAC. (D) Two-dimensional principle component plot by the expression of 74 FRGs in the two subtypes. The orange dots represented C1, and blue dots represented C2. (E) The expression heatmap of 74 FRGs in the two subtypes. (F) The heatmap of immune cells in the two subtypes. (G) The infiltration difference of TME cells between the two subtypes. The asterisks represented the statistical p value (nsP > 0.05; **P < 0.01; ***P < 0.001). (H, I) GSVA enrichment analysis revealed activated Hallmark (H) and KEGG (I) pathways of the two subtypes.
Figure 3
Figure 3
(A, B) Kaplan-Meier analysis for OS (A) and RFS (B) of the two subtypes in the TCGA cohort. (C, D) Kaplan-Meier analysis for OS (C) and RFS (D) of the two subtypes in the NCI cohort. (E) Kaplan-Meier analysis for OS in the ICGC cohorts. (F) The estimated IC50 of sorafenib between the two subtypes in the discovery cohorts. (G) Comparison of ICP molecules expression between the two subtypes. The asterisks represented the statistical p value (***P < 0.001). (H) The TIDE algorithm was used to predict the sensitivity of the two subtypes to immunotherapy in the discovery cohorts. (I) Submap analysis of the two subtypes and 47 pretreated patients with comprehensive immunotherapy annotations in the discovery cohorts. For Submap analysis, a smaller p-value implied a more similarity of paired expression profiles. (J–O) Composition percentage of the two subtypes in clinical characteristics such as age (J), gender (K), BMI (L), AJCC stage (M), grade (N), and vascular invasion (O).
Figure 4
Figure 4
(A) Signature score distributions of five cell subsets between the two subtypes. (B–E) Comparison of MDSC (B), Treg (C), Th17 (D), and fibroblasts (E) between the two subtypes. (F) The relative expression levels of chemokines and their ligands of the two subtypes. The asterisks represented the statistical p value (nsP > 0.05; **P < 0.01; ***P < 0.001).
Figure 5
Figure 5
(A) From left to right: mRNA expression; mutation frequency; amplification frequency; deletion frequency, and expression versus methylation (gene expression correlation with DNA methylation β value) for MHC molecules, co-stimulators and co-inhibitors in the two subtypes. (B–E) Comparison of the two subtypes in four immunogenicity associated indicators such as TMB (B), SNV neoantigens (C), indel neoantigens (D), and MSI score (E). (F–I) Comparison of the two subtypes in focal (F, G) and broad (H, I) CNV burden. (J, K) The distribution of TCR (J) and BCR (K) diversity in the two subtypes.
Figure 6
Figure 6
(A) The waterfall plot of significantly mutation genes in the two subtypes. Each column represented individual patients. The upper barplot showed TMB, the number on the left showed the proportion of samples with mutations. The right barplot indicated the mutation frequency in each gene. (B, C) The three mutation signatures with the highest cosine similarity to COSMIC signatures in C1 (B) and C2 (C). The etiology of each signature and the cosine similarity between the original and the reconstructed mutation signatures were indicated. (D, E) The pie charts showed the proportion of the three mutation signatures contributing to the mutations spectrum of C1 (D) and C2 (E). (F) The copy number variations of the two subtypes. (G–I) The expression difference of three ESGs including TF, CDO1 and SCD between the methylated and unmethylated groups.
Figure 7
Figure 7
(A–C) Kaplan-Meier survival analysis of high FRRS and low FRRS group in TCGA (A), ICGC (B), and NCI (C) cohorts. (D) FRRS and clinical factors were combined for multivariate Cox regression analysis. (E–G) Kaplan-Meier survival analysis of high FRRS and low FRRS groups (E), the distribution of FRRS between response and nonresponse groups (F), and ROC curve of the FRRS signature for predicting immunotherapy response (G) in IMvigor210 cohort. (H–J) Kaplan-Meier survival analysis of high FRRS and low FRRS groups (H), the distribution of FRRS between response and nonresponse groups (I), and ROC curve of the FRRS signature for predicting immunotherapy response (J) in GSE78220 cohort. (K–M) Kaplan-Meier survival analysis of high FRRS and low FRRS groups (K), the distribution of FRRS between response and nonresponse groups (L), and ROC curve of the FRRS signature for predicting immunotherapy response (M) in GSE100797 cohort. (N–P) AUC values of FRRS and seven other biomarkers for predicting the immunotherapy response in IMvigor210 (N), GSE78220 (O), and GSE100797 (P) cohorts.

Similar articles

Cited by

References

    1. Bray F, Ferlay J, Soerjomataram I, Siegel RL, Torre LA, Jemal A. Global cancer statistics 2018: GLOBOCAN estimates of incidence and mortality worldwide for 36 cancers in 185 countries. CA Cancer J Clin (2018) 68:394–424. 10.3322/caac.21492 - DOI - PubMed
    1. Marasco G, Colecchia A, Colli A, Ravaioli F, Casazza G, Bacchi Reggiani ML, et al. . Role of liver and spleen stiffness in predicting the recurrence of hepatocellular carcinoma after resection. J Hepatol (2019) 70:440–48. 10.1016/j.jhep.2018.10.022 - DOI - PubMed
    1. Bruix J, Qin S, Merle P, Granito A, Huang Y-H, Bodoky G, et al. . Regorafenib for patients with hepatocellular carcinoma who progressed on sorafenib treatment (RESORCE): a randomised, double-blind, placebo-controlled, phase 3 trial. Lancet (2017) 389:56–66. 10.1016/S0140-6736(16)32453-9 - DOI - PubMed
    1. Liu Z, Lin Y, Zhang J, Zhang Y, Li Y, Liu Z, et al. . Molecular targeted and immune checkpoint therapy for advanced hepatocellular carcinoma. J Exp Clin Cancer Res (2019) 38:447. 10.1186/s13046-019-1412-8 - DOI - PMC - PubMed
    1. Pons-Tostivint E, Latouche A, Vaflard P, Ricci F, Loirat D, Hescot S, et al. . Comparative Analysis of Durable Responses on Immune Checkpoint Inhibitors Versus Other Systemic Therapies: A Pooled Analysis of Phase III Trials. JCO Precis Oncol (2019) 3:1–10. 10.1200/po.18.00114 - DOI - PubMed

LinkOut - more resources