. 2021 Mar 2:11:595716.
doi: 10.3389/fcimb.2021.595716. eCollection 2021.

Integrative Analysis of Vaginal Microorganisms and Serum Metabolomics in Rats With Estrous Cycle Disorder Induced by Long-Term Heat Exposure Based on 16S rDNA Gene Sequencing and LC/MS-Based Metabolomics

Affiliations

Integrative Analysis of Vaginal Microorganisms and Serum Metabolomics in Rats With Estrous Cycle Disorder Induced by Long-Term Heat Exposure Based on 16S rDNA Gene Sequencing and LC/MS-Based Metabolomics

GaiHong An et al. Front Cell Infect Microbiol. .

Abstract

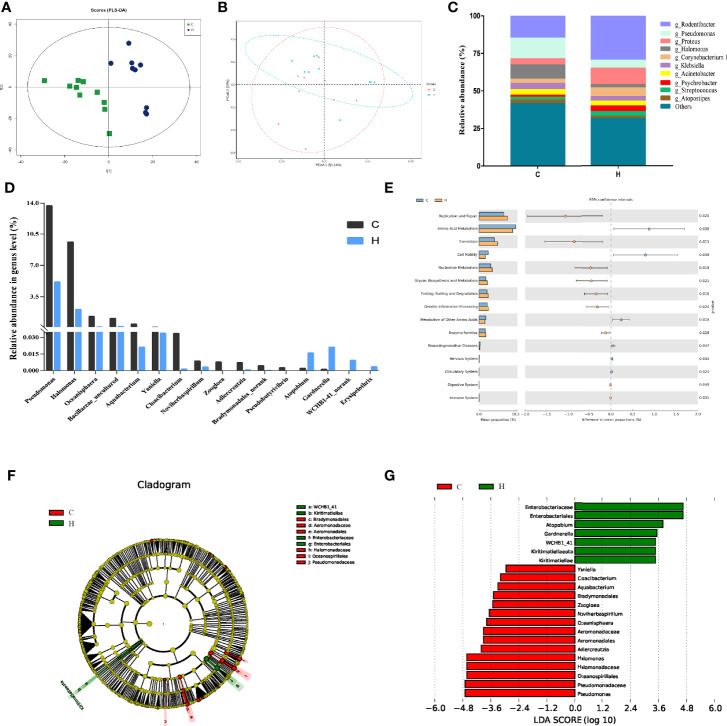
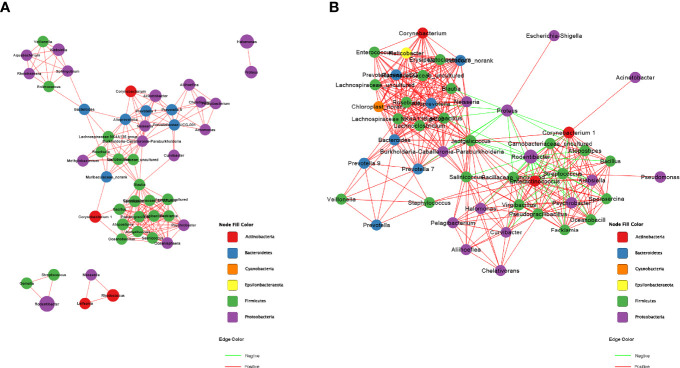
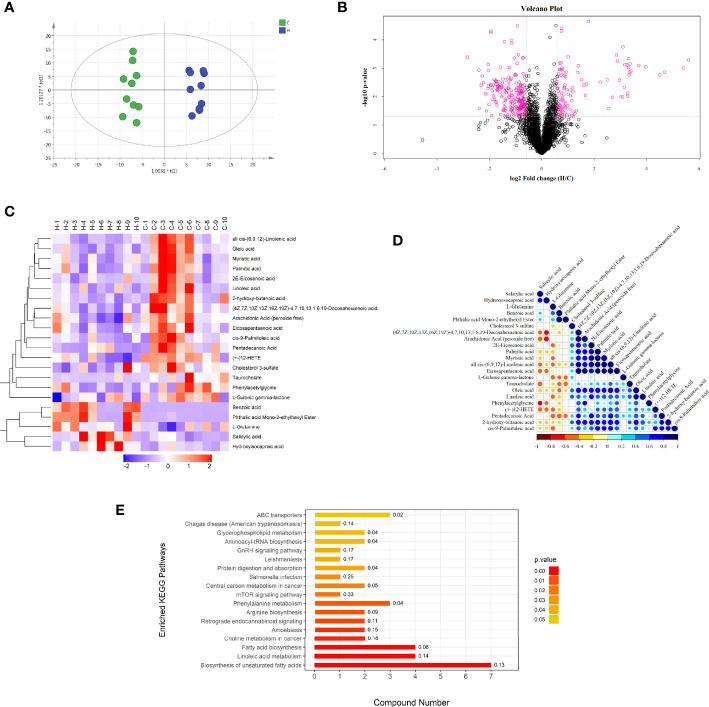
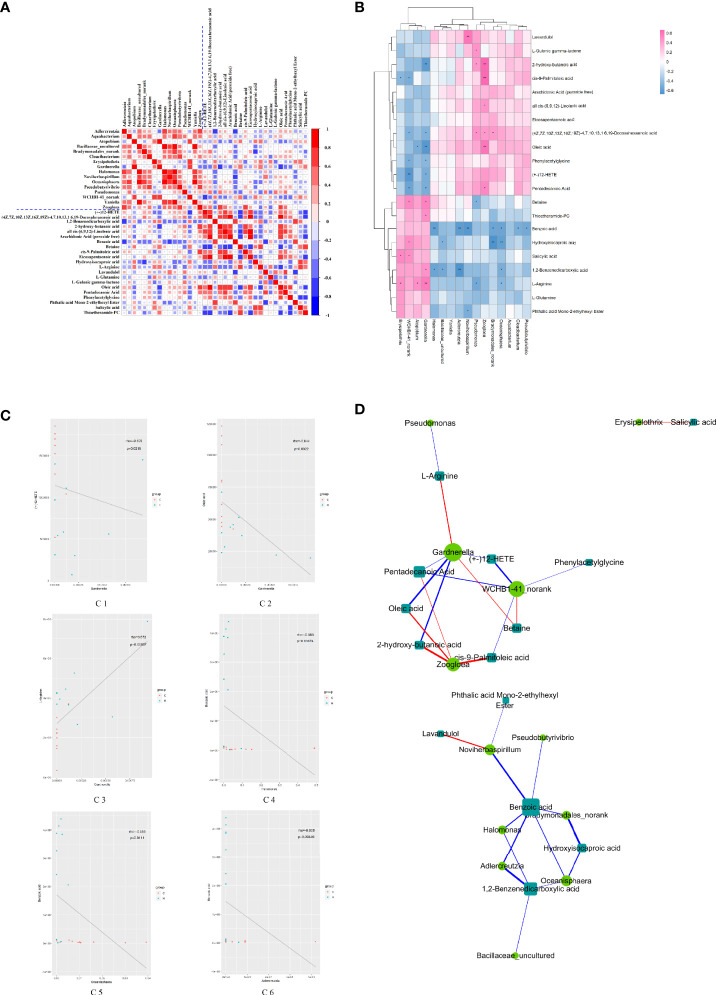
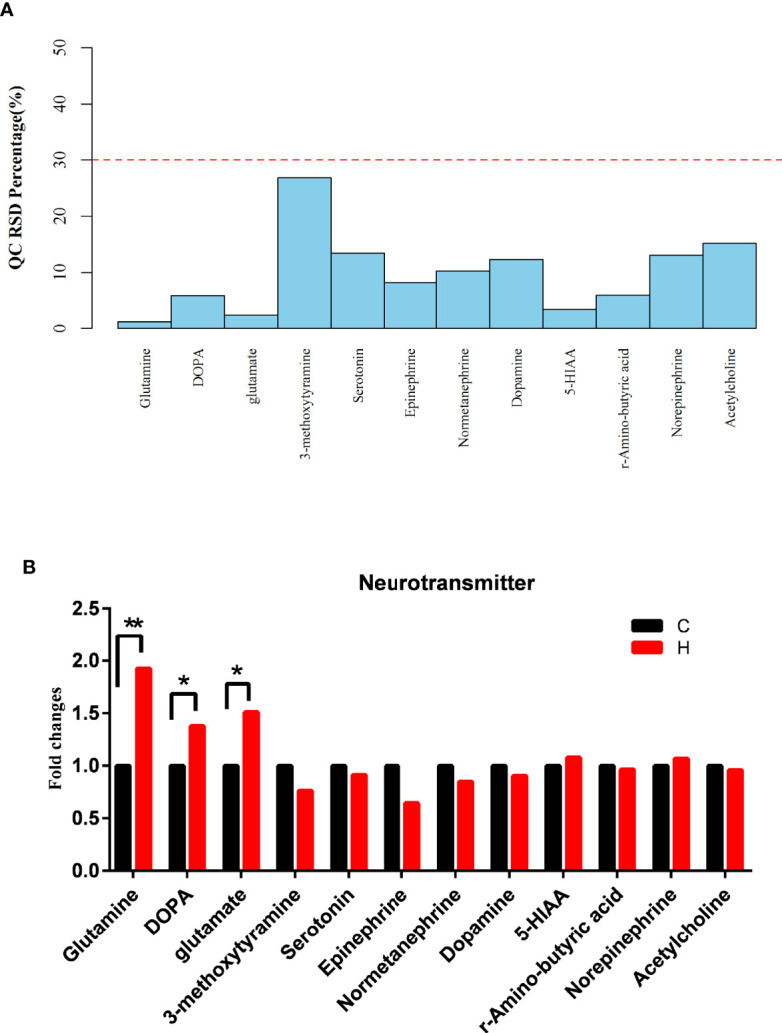
Long term heat exposure (HE) leads to estrous cycle disorder (ECD) in female rats and damages reproductive function. However, the regulation mechanism of vaginal microorganisms and serum metabolomics remains unclear. This study aimed to explore the effects of microbes on the vaginal secretions of rats with ECD and describe the serum metabolomics characteristics and their relationship with vaginal microorganisms. The alterations in the serum levels of neurotransmitters were used to verify the possible regulatory pathways. The relative abundance, composition, and colony interaction network of microorganisms in the vaginal secretions of rats with ECD changed significantly. The metabolomics analysis identified 22 potential biomarkers in the serum including lipid metabolism, amino acid metabolism, and mammalian target of rapamycin and gonadotropin-releasing hormone (GnRH) signaling pathways. Further, 52 pairs of vaginal microbiota-serum metabolites correlations (21 positive and 31 negative) were determined. The abundance of Gardnerella correlated positively with the metabolite L-arginine concentration and negatively with the oleic acid concentration. Further, a negative correlation was found between the abundance of Pseudomonas and the L-arginine concentration and between the metabolite benzoic acid concentration and the abundance of Adlercreutzia. These four bacteria-metabolite pairs had a direct or indirect relationship with the estrous cycle and reproduction. The glutamine, glutamate, and dopamine levels were significantly uncontrolled. The former two were closely related to GnRH signaling pathways involved in the development and regulation of HE-induced ECD in rats. Serum neurotransmitters partly reflected the regulatory effect of vaginal microorganisms on the host of HE-induced ECD, and glutamatergic neurotransmitters might be closely related to the alteration in vaginal microorganisms. These findings might help comprehend the mechanism of HE-induced ECD and propose a new intervention based on vaginal microorganisms.

Keywords: estrous cycle disorder; long-term heat exposure; neurotransmitter; serum metabolomics; vaginal microbiota.


Conflict of interest statement

The authors declare that the research was conducted in the absence of any commercial or financial relationships that could be construed as a potential conflict of interest.

Figures

Figure 1
Figure 1
Vaginal microbial abundance and diversity in rats with HE-induced ECD. (A) The map of OTU abundance via PLS-DA analysis. (B) PCoA plot of weighted UniFrac distance of C and H group samples. The x-axis and the y-axis represent the first principal component and the second principal component respectively, and the percentage represents the contribution to the sample difference. (C) Top 10 most abundant genera in each group. (D) Distribution of vaginal bacteria with a significant difference in each group. (E) Predicted metabolic functions of vaginal microbiota in each group. KEGG pathways are shown in the extended error bar. The P value is shown on the right. (F) Phylogenetic distribution of vaginal microbiota from phyla to genera in each group via LEfSe analysis. (G) Cladogram generated from the LEfSe LDA analysis identifying the bacterial abundance between the two groups (LDA Core ≥ 2).
Figure 2
Figure 2
Correction network analysis of 50 most abundant genera in (A) normal rats and (B) ECD rats. The lines between nodes represent Spearman correction, and color intensity represents correlation coefficient. The red line means positive correlation and the green line means negative correlation. The color of the genus is based on the subordination of the gate, and the size shows the average relative abundance.
Figure 3
Figure 3
Negative ion mode multivariate statistical analysis, heat map, cluster analysis, and metabolic pathway. (A) OPLS-DA score chart of serum metabolite analysis between the C and H groups. t [1] is the predicted principal component to distinguish the variation between groups, and the orthogonal principal component t0 [1] reflects the variation within the group. (B) volcano map of differential metabolites between the C and H groups. The red spots in the map show metabolites with FC >1.5 and P value < 0.05. These metabolites were screened by univariate statistical analysis. (C) Results of hierarchical clustering of metabolites with apparent changes in serum samples. Red and blue represent higher and lower concentrations of metabolites, respectively (FC >1.5 and P value < 0.05). (D) correlation of metabolites with significant differences between the two groups. (E) Results of the KEGG pathway enrichment analysis of differential metabolites (P < 0.05). The X axis represents the number of significantly different metabolites were enriched in this pathway, and the value on the histogram is richFactor.
Figure 4
Figure 4
Relationship between vaginal microorganisms and serum metabolites. (A) Correlation coefficient matrix thermograph illustrating the functional correlation between perturbed vaginal microbiota and altered serum levels of metabolites. With the blue dotted line in the picture as the dividing line, it is divided into four quadrants. The upper left corner shows the correlation between the significantly different Vaginal flora, and the lower right corner shows the correlation between the significantly different metabolites. Both the upper right corner and the lower left corner show the correlation between the significantly different flora and metabolites (mirror image symmetry). The correlation coefficient r is expressed by color, r > 0 means positive correlation (red), and r < 0 means negative correlation (blue). The darker the color, the stronger the correlation. (B) Heat map summarizing the correlation between perturbed vaginal microbiota and altered serum levels of metabolites. *P value < 0.05, **P value < 0.01. (C) Scatter plots showing a statistical correlation between the relative abundance of altered vaginal bacteria and the mass spectrum intensities of some typical serum metabolites. (D1) Between Gardnerella and (+-) 12-HETE, (D2) between Gardnerella and oleic acid, (D3) between Gardnerella and L-arginine, (D4) between Halomonas and benzoic acid, (D5) between Oceanisphaera and benzoic acid, and (D6) between Adlercreulzia and benzoic acid. In the graph, the scattered dots represent the samples, and the colors correspond to different groupings. Rho is the Spearman correlation coefficient between the relative microbiota abundance and the metabolite intensity. The P value is the significant level of the rho. In (A–C), blue represents negative correlation (r < 0), and red represents positive correlation (r > 0); the darker the color, the stronger the correlation. (D) Network diagram of the correlation between vaginal microbiota and serum levels of metabolites. The microbiota and metabolites with absolute correlation coefficient [0.3, 1] were analyzed by the Spearman correlation network. The circle represents the altered bacteria, and the rectangle represents the altered serum levels of metabolites. The thickness of the line is proportional to the absolute value of the correlation coefficient. The node size positively correlates with its degree, that is, the greater the degree, the larger the node size.
Figure 5
Figure 5
Effects of HE on serum neurotransmitters. (A) RSD distribution of QC samples of serum neurotransmitters. (B) Changes in the levels of serum neurotransmitters, as detected by targeted metabolomics analysis. Compared with the C group, **P < 0.01, *P < 0.05. (DOPA represents L-DOPA in the above two graphs).

References

    1. Abdullah L., Evans J. E., Emmerich T., Crynen G., Shackleton B., Keegan A. P., et al. (2017). APOE epsilon4 specific imbalance of arachidonic acid and docosahexaenoic acid in serum phospholipids identifies individuals with preclinical Mild Cognitive Impairment/Alzheimer’s Disease. Aging (Albany NY) 9 (3), 964–985. 10.18632/aging.101203 - DOI - PMC - PubMed
    1. An G., Chen X., Li C., Zhang L., Wei M., Chen J., et al. (2020). Pathophysiological Changes in Female Rats with Estrous Cycle Disorder Induced by Long-Term Heat Stress. BioMed. Res. Int. 2020, 4701563. 10.1155/2020/4701563 - DOI - PMC - PubMed
    1. Arantes S., Candeias F., Lopes O., Lima M., Pereira M., Tinoco T., et al. (2016). Pharmacological and Toxicological Studies of Essential Oil of Lavandula stoechas subsp. luisieri. Planta Med. 82 (14), 1266–1273. 10.1055/s-0042-104418 - DOI - PubMed
    1. Bialon M., Krzysko-Lupicka T., Nowakowska-Bogdan E., Wieczorek P. P. (2019). Chemical Composition of Two Different Lavender Essential Oils and Their Effect on Facial Skin Microbiota. Molecules 24, (18). 10.3390/molecules24183270 - DOI - PMC - PubMed
    1. Borges S., Silva J., Teixeira P. (2014). The role of lactobacilli and probiotics in maintaining vaginal health. Arch. Gynecol. Obstet. 289 (3), 479–489. 10.1007/s00404-013-3064-9 - DOI - PubMed

Publication types

LinkOut - more resources