. 2021 Feb 14;4(1):27-39.
doi: 10.1002/ame2.12151. eCollection 2021 Mar.

Studying host genetic background effects on multimorbidity of intestinal cancer development, type 2 diabetes and obesity in response to oral bacterial infection and high-fat diet using the collaborative cross (CC) lines

Affiliations

Studying host genetic background effects on multimorbidity of intestinal cancer development, type 2 diabetes and obesity in response to oral bacterial infection and high-fat diet using the collaborative cross (CC) lines

Asal Milhem et al. Animal Model Exp Med. .

Abstract

Background: Multimorbidity of intestinal cancer (IC), type 2 diabetes (T2D) and obesity is a complex set of diseases, affected by environmental and genetic risk factors. High-fat diet (HFD) and oral bacterial infection play important roles in the etiology of these diseases through inflammation and various biological mechanisms.

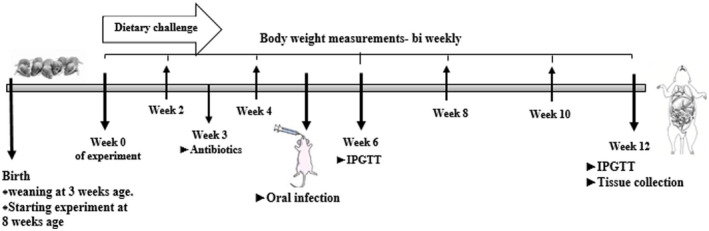
Methods: To study the complexity of this multimorbidity, we used the collaborative cross (CC) mouse genetics reference population. We aimed to study the multimorbidity of IC, T2D, and obesity using CC lines, measuring their responses to HFD and oral bacterial infection. The study used 63 mice of both sexes generated from two CC lines (IL557 and IL711). For 12 weeks, experimental mice were maintained on specific dietary regimes combined with co-infection with oral bacteria Porphyromonas gingivalis and Fusobacterium nucleatum, while control groups were not infected. Body weight (BW) and results of a intraperitoneal glucose tolerance test (IPGTT) were recorded at the end of 12 weeks, after which length and size of the intestines were assessed for polyp counts.

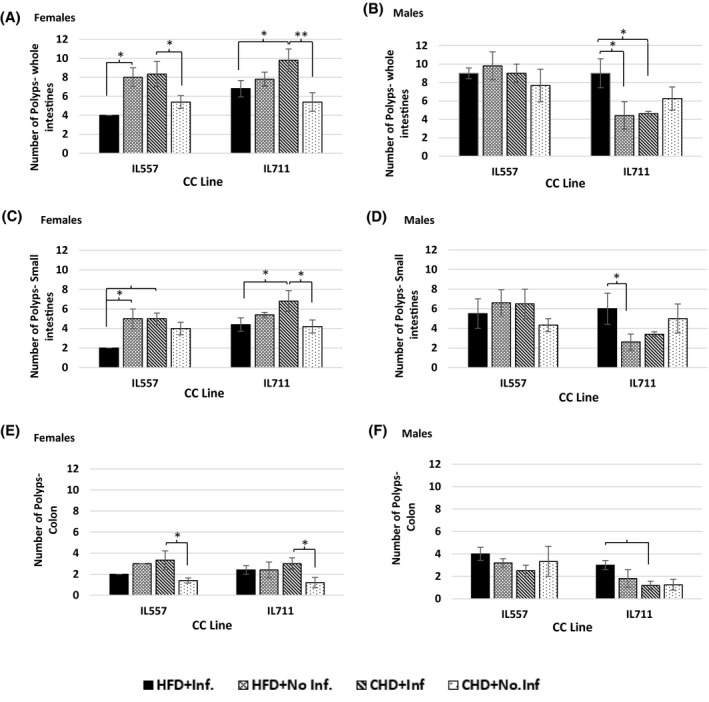
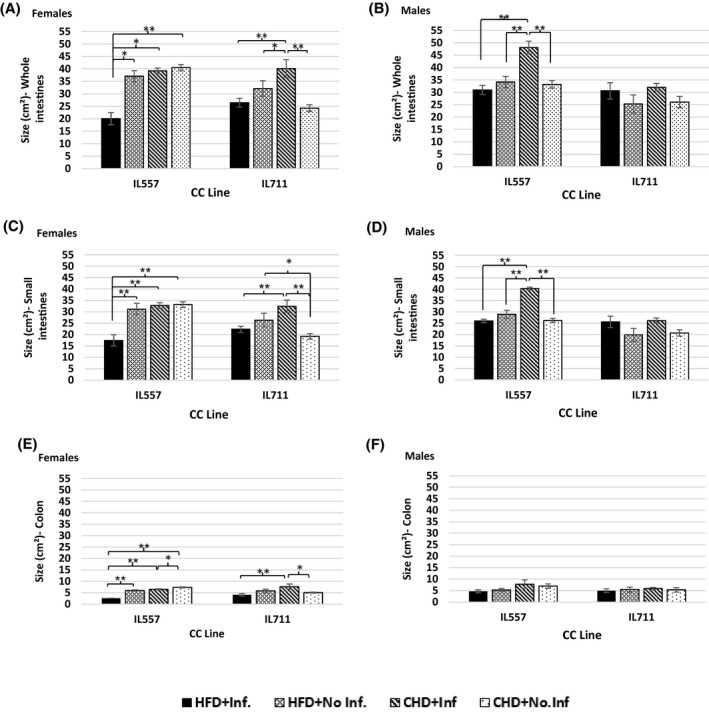
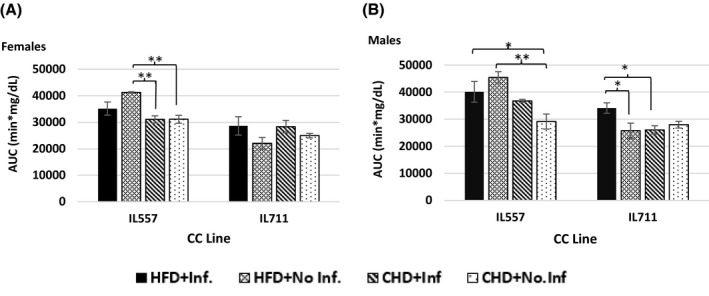
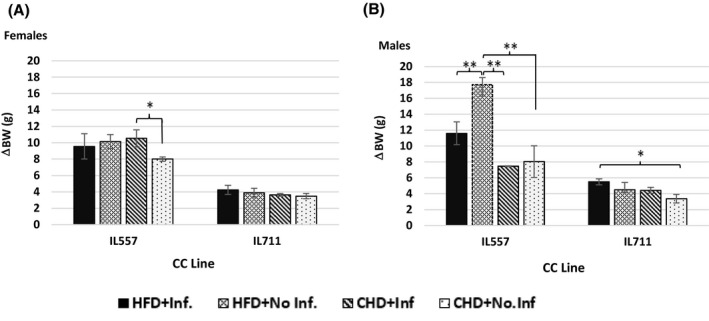
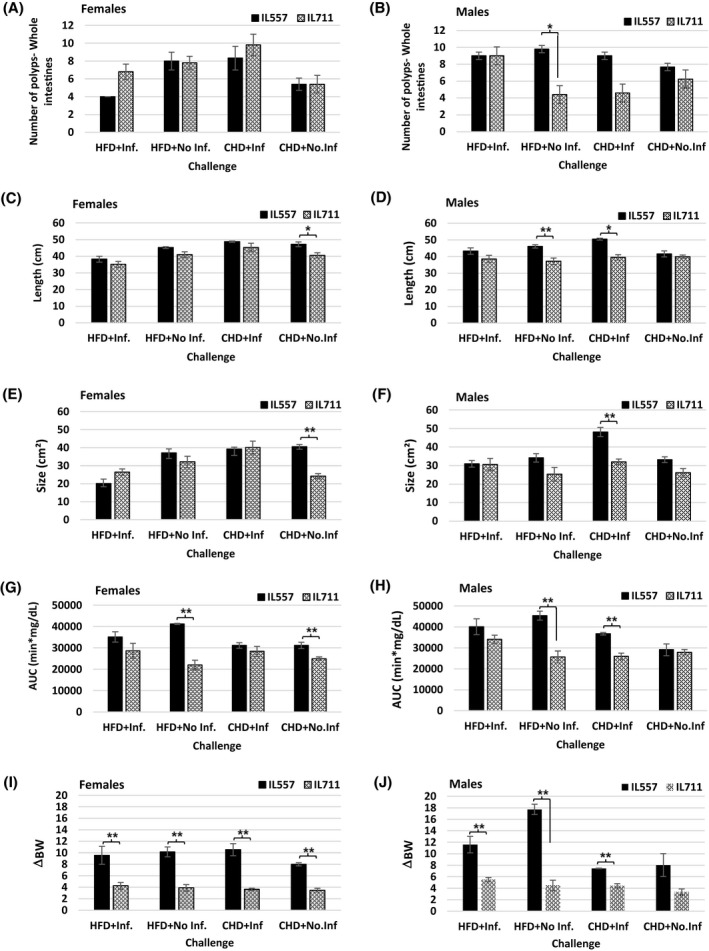
Results: Polyp counts ranged between 2 and 10 per CC line. The combination of HFD and infection significantly reduced (P < .01) the colon polyp size of IL557 females to 2.5 cm2, compared to the other groups. Comparing BW gain, IL557 males on HFD gained 18 g, while the females gained 10 g under the same conditions and showed the highest area under curve (AUC) values of 40 000-45 000 (min mg/dL) in the IPGTT.

Conclusion: The results show that mice from different genetic backgrounds respond differently to a high fat diet and oral infection in terms of polyp development and glucose tolerance, and this effect is gender related.

Keywords: high‐fat diet (42% fat); intestinal cancer; multimorbidity; obesity; oral bacterial infection; type 2 diabetes (T2D).


Conflict of interest statement

The authors have declared no conflicts of interest.

Figures

FIGURE 1
FIGURE 1
Study design scheme showing timescale and experimental procedures. The experiments started when mice were 8 wk old (start point) and continuing until they were 20 wk old, ie 12 wk. At the start time point, BW was recorded and mice were divided into two dietary groups: HFD (*42% fat) or CHD (*11% fat, control group). At week 5 of the experiment (13 wk old), infection was performed perorally with mixed‐oral bacteria for the experimental groups and placebo‐infection without bacteria for control groups. At week 12 of the experiment, glucose tolerance ability was assessed by IPGTT, the mice were sacrificed and tissues were collected for further study including small and large intestines. CHD, chow diet; BW, body weight; HFD, high‐fat diet; IPGTT, intraperitoneal glucose tolerance test. *%, Kcal/Kg from fat (metabolized energy)
FIGURE 2
FIGURE 2
Number of polyps following 12 wk of standard chow diet (CHD) versus high‐fat (42% fat) diet (HFD) challenge and infection challenge in male and female populations. X‐axis, CC lines; Y‐axis, the number of polyps in whole intestines (A and B), small intestines (C and D) and in colon (E and F). * and **indicate significant P values of <.05 and <.01, respectively
FIGURE 3
FIGURE 3
Length of intestines following 12 wk of standard chow diet (CHD) versus high‐fat (42% fat) diet (HFD) challenge and infection challenge in male and female populations. X‐axis, CC lines; Y‐axis, length (cm) of whole intestines (A and B), small intestines (C and D) and colon (E and F). * and **indicate significant P values of <.05 and <.01, respectively
FIGURE 4
FIGURE 4
Size of intestines following 12 wk of standard chow diet (CHD) versus high‐fat (42% fat) diet (HFD) challenge and infection challenge in male and female populations. X‐axis, CC lines; Y‐axis, the size (cm2) of whole intestines (A and B), small intestines (C and D) and colon (E and F). * and **indicate significant P values of <.05 and <.01, respectively
FIGURE 5
FIGURE 5
Blood glucose tolerance presented as area under curve (AUC, min mg/dL) of 180 min of glucose clearance test in male and female populations. Y‐axis, AUC in females (A) and males (B); X‐axis, different CC lines following 12 wk of CHD and HFD (42% fat) challenge, with or without infection challenge. * and **indicate significant P values of <.05 and <.01, respectively
FIGURE 6
FIGURE 6
Change in body weight (g) following 12 wk of HFD versus CHD dietary challenge and infection challenge for females (A) and males (B) of the different CC lines. X‐axis, two different CC lines; Y‐axis, body weight gain (g). Change in body weight (ΔBW) was calculated by subtracting the body weight at the initial time point (week 0) from that at the end time point (week 12), ie ΔBW = BW12 − BW0. * and **indicate significant P values of <.05 and <.01, respectively
FIGURE 7
FIGURE 7
Heatmap of polyp counts, glucose tolerance, body weight gain, and length and size of intestines at week 12 in different two CC lines (IL557 and IL711) in response to a 42% high‐fat diet (HFD) or chow diet (CHD), and with (+Inf.) or without (No‐Inf.) oral bacterial infection challenges in female and male populations. Blue and red colors indicate low and high scores, respectively, for the studied traits
FIGURE 8
FIGURE 8
Comparisons of polyp counts, glucose tolerance, body weight gain, and length and size of intestines at week 12 in male and female mice from the IL557 and IL711 CC lines in response to a 42% high‐fat diet (HFD) or chow diet (CHD), and with (+Inf.) or without (No‐Inf.) oral bacterial infection challenges in female and male populations. Number of recorded polyps in the whole intestines in each experimental group (HFD + Inf., HFD + No‐Inf., CHD + Inf. and CHD + No‐Inf.) in female and male mice from IL557 and IL711 CC lines are presented in (A) and (B), respectively, while length of the intestines in the same groups in female and male mice are presented in (C) and (D), respectively. (E) and (F) present intestines sizes for females and males, respectively, in these two lines. AUC values in female and male mice in these studied groups are presented in (G) and (H), respectively, and body weight gain traits (ΔBW) for female and male mice are presented in (I) and (J), respectively. * and **indicate significant P values of <.05 and <.01, respectively

Similar articles

Cited by

References

    1. Marley AR, Nan H. Epidemiology of colorectal cancer. Int J Mol Epidemiol Genet. 2016;7(3):105‐114. - PMC - PubMed
    1. Marcenes W, Kassebaum NJ, Bernabé E, et al. Global burden of oral conditions in 1990–2010: A systematic analysis. J Dent Res. 2013;92(7):592‐597. - PMC - PubMed
    1. Tuan J, Chen Y‐X. Dietary and lifestyle factors associated with colorectal cancer risk and interactions with microbiota: fiber, red or processed meat and alcoholic drinks. Gastrointestinal Tumors. 2016;3(1):17‐24. - PMC - PubMed
    1. Doerner SK, Reis ES, Leung ES, et al. High‐fat diet‐induced complement activation mediates intestinal inflammation and Neoplasia, independent of obesity. Mol Cancer Res. 2016;14(10):953‐965. - PMC - PubMed
    1. Dai J, Gu J, Huang M, et al. GWAS‐identified colorectal cancer susceptibility loci associated with clinical outcomes. Carcinogenesis. 2012;33(7):1327‐1331. - PMC - PubMed

Publication types

LinkOut - more resources