. 2020 Dec 20;3(1):fcaa148.
doi: 10.1093/braincomms/fcaa148. eCollection 2021.

Acetyl-leucine slows disease progression in lysosomal storage disorders

Affiliations

Acetyl-leucine slows disease progression in lysosomal storage disorders

Ecem Kaya et al. Brain Commun. .

Abstract

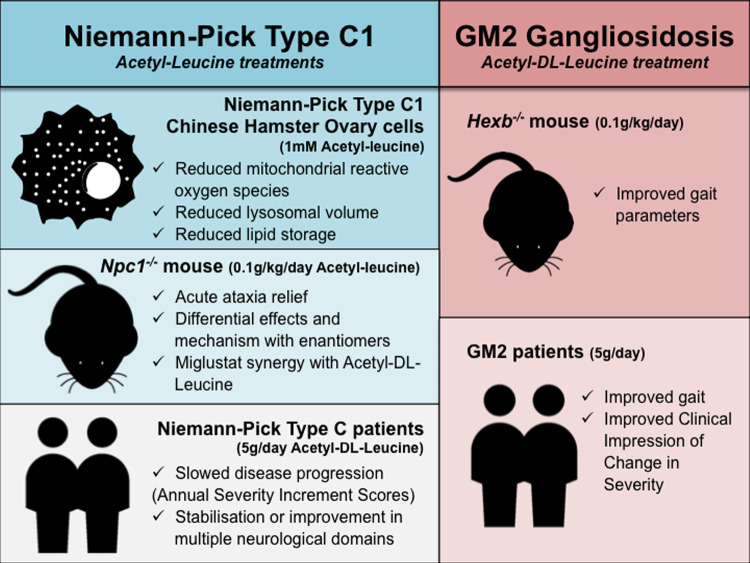
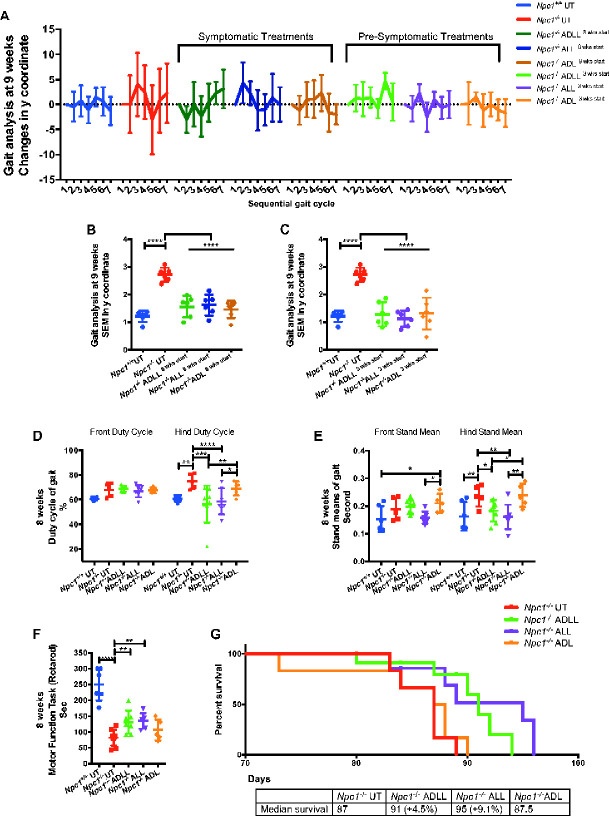
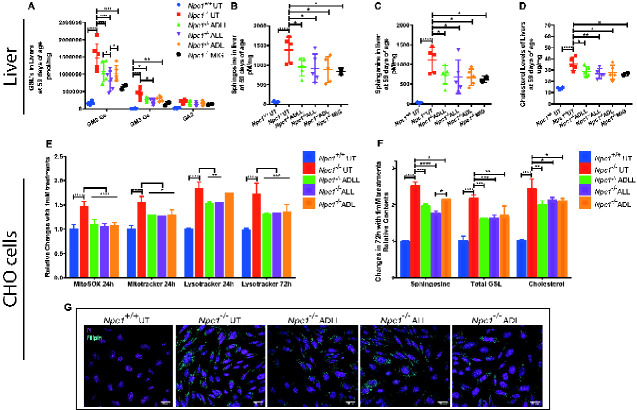
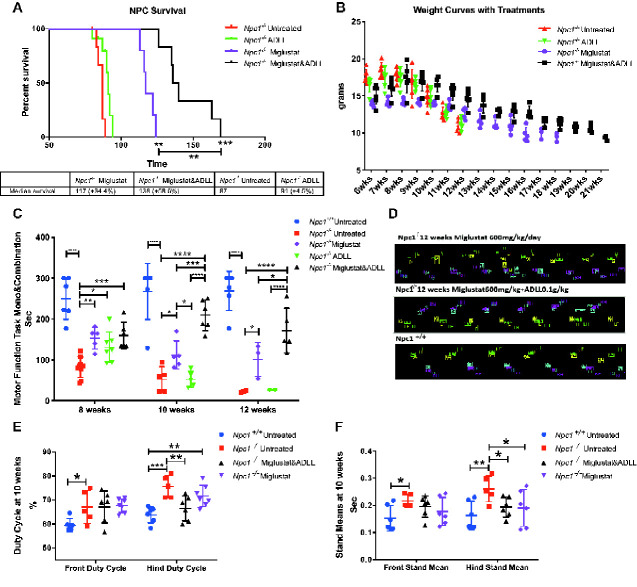
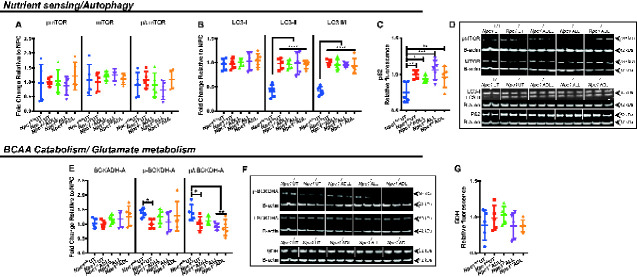
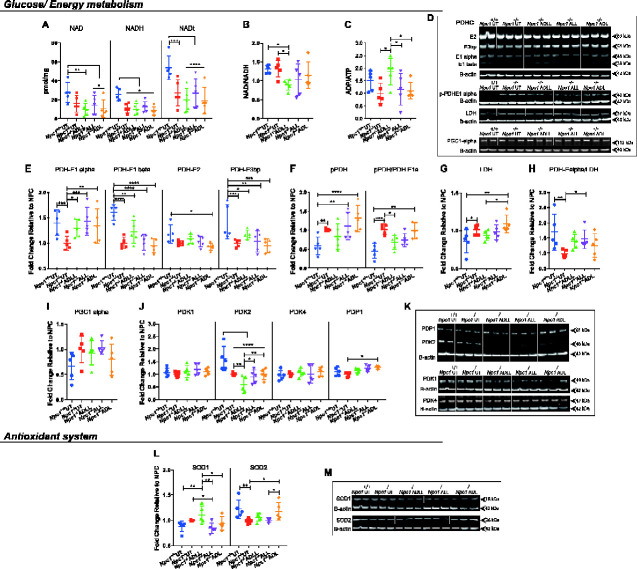
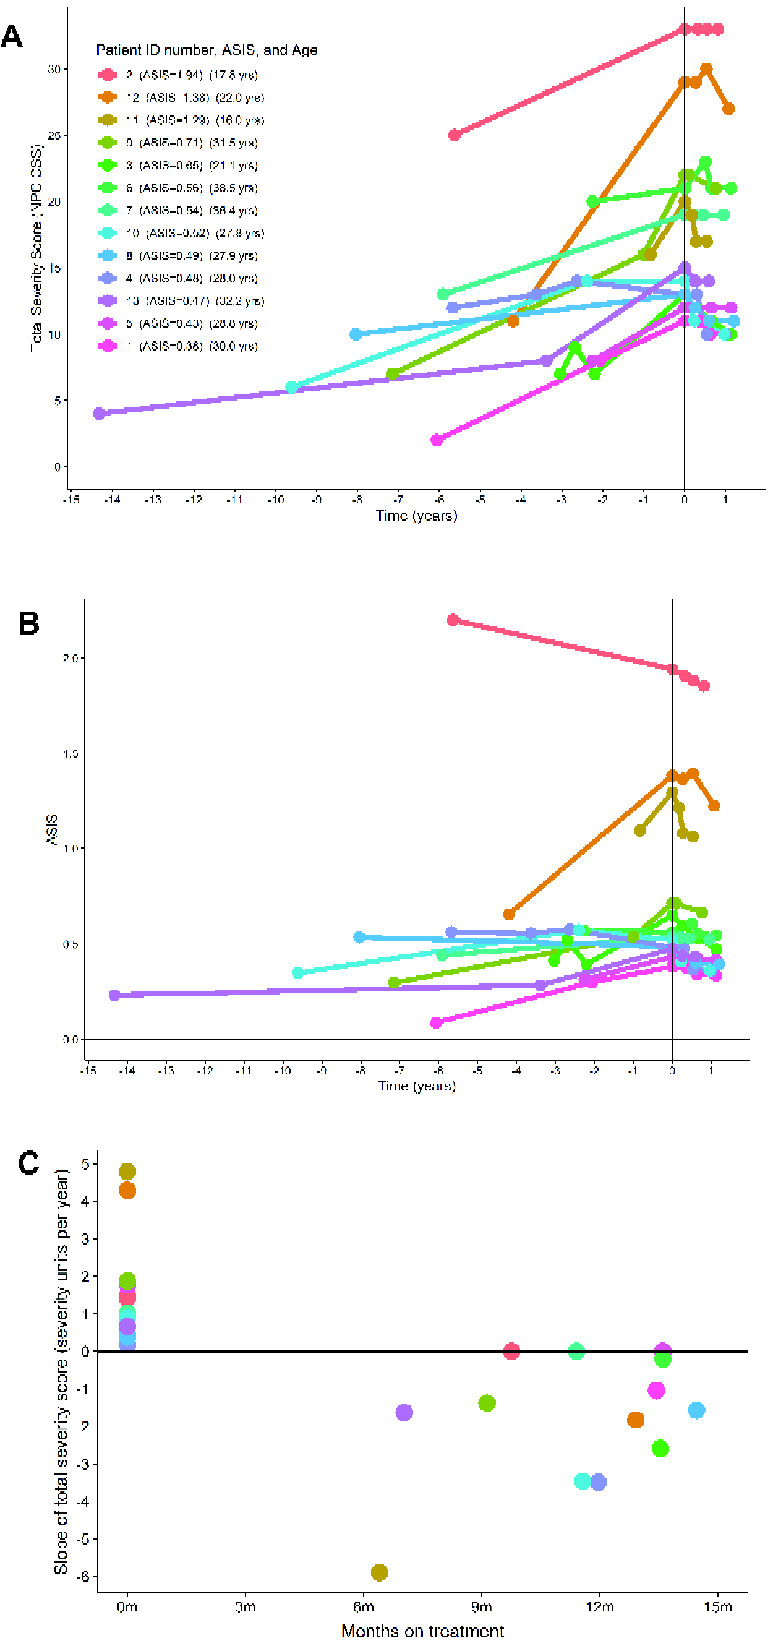
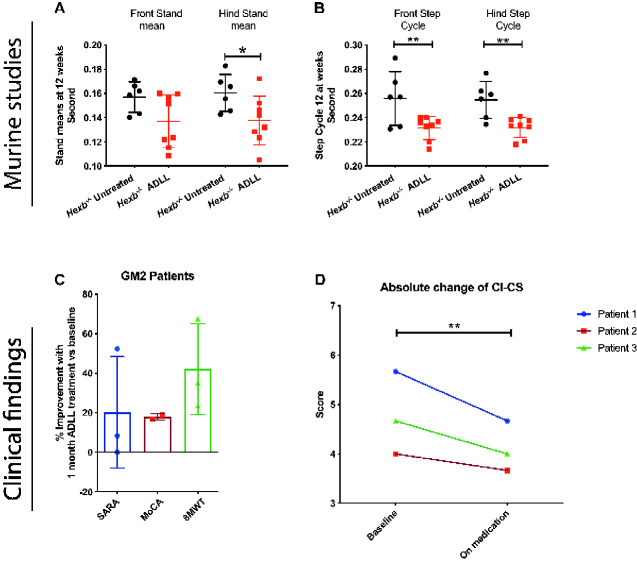
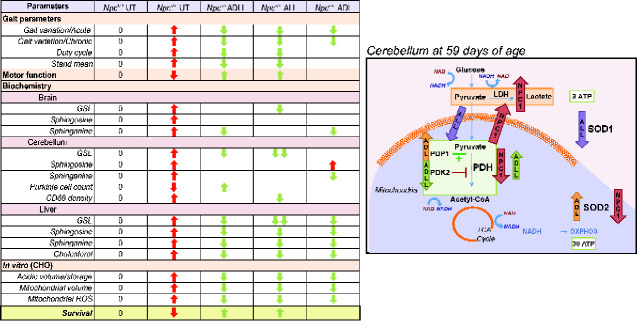
Acetyl-dl-leucine is a derivative of the branched chain amino acid leucine. In observational clinical studies, acetyl-dl-leucine improved symptoms of ataxia, in particular in patients with the lysosomal storage disorder, Niemann-Pick disease type C1. Here, we investigated acetyl-dl-leucine and its enantiomers acetyl-l-leucine and acetyl-d-leucine in symptomatic Npc1-/- mice and observed improvement in ataxia with both individual enantiomers and acetyl-dl-leucine. When acetyl-dl-leucine and acetyl-l-leucine were administered pre-symptomatically to Npc1-/- mice, both treatments delayed disease progression and extended life span, whereas acetyl-d-leucine did not. These data are consistent with acetyl-l-leucine being the neuroprotective enantiomer. Altered glucose and antioxidant metabolism were implicated as one of the potential mechanisms of action of the l-enantiomer in Npc1-/- mice. When the standard of care drug miglustat and acetyl-dl-leucine were used in combination significant synergy resulted. In agreement with these pre-clinical data, when Niemann-Pick disease type C1 patients were evaluated after 12 months of acetyl-dl-leucine treatment, rates of disease progression were slowed, with stabilization or improvement in multiple neurological domains. A beneficial effect of acetyl-dl-leucine on gait was also observed in this study in a mouse model of GM2 gangliosidosis (Sandhoff disease) and in Tay-Sachs and Sandhoff disease patients in individual-cases of off-label-use. Taken together, we have identified an unanticipated neuroprotective effect of acetyl-l-leucine and underlying mechanisms of action in lysosomal storage diseases, supporting its further evaluation in clinical trials in lysosomal disorders.

Keywords: GM2 gangliosidosis; Niemann-Pick disease type C; acetyl-leucine; lysosomal storage diseases; miglustat.


Figures

Graphical Abstract
Graphical Abstract
Figure 1
Figure 1
AL analogues impact on behavioural parameters in NPC1 mice. For wild-type untreated (Npc1+/+ UT), NPC1 untreated (Npc1−/− UT), ADLL (Npc1−/− ADLL), ALL (Npc1−/− ALL), ADL (Npc1−/− ADL) treatments minimum five, maximum seven animals for each group. *P < 0.05, **P < 0.01, ***P < 0.001 and ****P < 0.0001. (A) Symptomatic and pre-symptomatic AL treatment y coordinates displacement of each consecutive foot from a straight-line trajectory (mean ± SD, n = 6). (B) Late stage AL treatment SEMs of y coordinate changes (mean ± SD, n = 6; one-way ANOVA. (C) Early stage AL treatment SEMs of y coordinate changes (mean ± SD, n = 6; one-way ANOVA). (D) Early stage AL treatment front and hind duty cycle measurements, mean ± SD (two-way ANOVA). (E) Early stage AL treatments front and hind stand mean measurements, mean ± SD (two-way ANOVA). Duty Cycle and Stand mean analyses were measured by three-recorded runs per animal and quantitative results were obtained with Noldus CatWalk 10.5 software system. (F) Early stage AL treatment motor performance measurements, mean ± SD (one-way ANOVA). Motor function performance was measured with accelerating Rotarod (1 rpm up to 10 rpm). (G) Life expectancy percentages and median survivals (Gehan–Breslow–Wilcoxon test), n = 6
Figure 2
Figure 2
Effect of AL analogues on biochemical and histopathology in Npc1−/− mice at 59 days of age. For all AL treatments, n = 5 animals per group, for miglustat (positive control) (Npc1−/− MIG), n = 2 or n = 1. *P < 0.05, **P < 0.01, ***P < 0.001 and ****P < 0.0001. (A) GSL profiles in brain, mean ± SD (two-way ANOVA). (B) Sphingosine levels in brain, mean ± SD (one-way ANOVA). (C) Sphinganine levels in brain, mean ± SD (one-way ANOVA). (D) GSLs in cerebellum, mean ± SD (two-way ANOVA). (E) Sphingosine in cerebellum, mean ± SD (one-way ANOVA). (F) Sphinganine in cerebellum, mean ± SD (one-way ANOVA). (G) Cerebellum stained with calbindin-b (Purkinje cells, red) or CD68 (activated microglia, yellow). Scale bar 800 μm. (H) Purkinje cell density (Purkinje cell number normalized by perimeter of each lobule) at 59 days of age relative to NPC1 untreated, mean ± SD (two-way ANOVA). (I) CD68 cell density (number of CD68 positive microglia per area) at 59 days of age, mean ± SD (one-way ANOVA).
Figure 3
Figure 3
Effect of AL analogues on non-neuronal tissues and cells. For all AL treatments, n = 5 animals per group, for miglustat (positive control) (Npc1−/− MIG), n = 2 or n = 1. *P < 0.05, **P < 0.01, ***P < 0.001 and ****P < 0.0001. (A) GSLs in liver, mean ± SD (two-way ANOVA). (B) Sphingosine in liver, mean ± SD (one-way ANOVA). (C) Sphinganine in liver, mean ± SD (one-way ANOVA). (D) Liver cholesterol, mean ± SD (one-way ANOVA). (E) MitoSOX(red) and MitoTracker(Green) and Lysotracker(Green) changes relative to Npc1+/+ with 24 and 72 h 1 mM ALs. CHO cells were double stained with either MitoTracker Green and MitoSOX red, or LysoTracker Green and propidium iodide. Single and live cell populations and FITC and PE fluorescence were determined by analytical flow cytometry. Mean ± SD (two-way ANOVA). (F) Sphingosine, total GSL and free cholesterol levels (72 h) relative to Npc1+/+, mean ± SD (two-way ANOVA). (G) NPC1 CHO cells stained with filipin (cyan, cholesterol) and propidium iodide (magenta, nucleus). Scale bar 20 μm.
Figure 4
Figure 4
Effect of ADLL in combination with miglustat. For wild-type untreated (Npc1+/+ UT), NPC1 untreated (Npc1−/− UT), ADLL (Npc1−/− ADLL), miglustat (Npc1−/− MIG) and combination (Npc1−/− miglustat and ADLL) therapies minimum five animals for each group. *P < 0.05, **P < 0.01, ***P < 0.001 and ****P < 0.0001. (A) Survival curves (percentage of life expectancy) and median survivals (Gehan–Breslow–Wilcoxon test). (B) Body weight curves of experimental groups over the course of their life, mean ± SD. (C) Motor performance measurements (Rotarod) at 8, 10 and 12 weeks of age, mean ± SD (two-way ANOVA). Animals that did not perform the task were excluded from the experiment. (D) Representative image of footprints of miglustat and miglustat/ADLL combination therapy relative to wild-type. (E) Duty cycle measurements of front and hind paws at 10 weeks of age, mean ± SD (two-way ANOVA). (F) Stand mean measurements at of front and hind paws 10 weeks of age, mean ± SD (two-way ANOVA)
Figure 5
Figure 5
Effects of AL analogues on expression of proteins involved in nutrient sensing, autophagy, branched chain amino acid catabolism and glutamate metabolism in cerebellum at 59 days of age. Wild-type untreated (Npc1+/+ UT), NPC1 untreated (Npc1−/− UT), ADLL (Npc1−/− ADLL), ALL (Npc1−/− ALL), ADL (Npc1−/− ADL) treatments, n = 5 for each group. *P < 0.05, **P < 0.01, ***P < 0.001 and ****P < 0.0001. (A) mTOR, Phospho-mTOR expression and phospho-mTOR and mTOR ratio, mean ± SD (two-way ANOVA). (B) LC3-I, LC3-II expression, LC3-II and LC3-I ratios, mean ± SD (two-way ANOVA). (C) p62 levels, mean ± SD (one-way ANOVA). (D) Western blots images of phospho-mTOR, mTOR, LC3 and p62 and their beta-actin loading controls. (E) BCKDHA, pPBCKDHA, p/t BCKDHA expression, mean ± SD, (2-way ANOVA). (F) BCKDHA, pBCKDHA, and glutamate dehydrogenase western blot images with beta-actin loading controls. (G) Glutamate dehydrogenase expression, mean ± SD (one-way ANOVA)
Figure 6
Figure 6
Effects of AL analogues on expression of proteins involved in energy metabolism and the antioxidant system in cerebellum at 59 days of age. Wild-type untreated (Npc1+/+ UT), NPC1 untreated (Npc1−/− UT), ADLL (Npc1−/− ADLL), ALL (Npc1−/− ALL), ADL (Npc1−/− ADL) treatments, n = 5 for each group. *P < 0.05, **P < 0.01, ***P < 0.001 and ****P < 0.0001. (A) NAD, NADH, total NAD (NADt) measurements, mean ± SD (two-way ANOVA). (B) NADH/NADH ratios, mean ± SD (one-way ANOVA). (C) ADP/ATP ratios mean ± SD (one-way ANOVA). (D) Western blot images of PDHC, pPDH, LDH, peroxisome proliferator-activated receptor-gamma coactivator 1-alpha and beta-actin loading controls. (E) PDHC protein expressions, mean ± SD (two-way ANOVA). (F) pPDH expressions and pPDH/PDHE1 alpha ratios, mean ± SD (two-way ANOVA). (G) LDH expression, mean ± SD (one-way ANOVA). (H) PDHE1 alpha/LDH ratios, mean ± SD (one-way ANOVA). (I) PGC 1 alpha expression, mean ± SD (one-way ANOVA). (J) PDK 1–2–4 and PDP1 expression, mean ± SD (two-way ANOVA). (K) Western blot images of PDKs and PDP1 along with their beta-actin loading controls. (L) SOD1 and SOD2 expression, mean ± SD (two-way ANOVA). (M) Western blot images of SOD1 and SOD2 along with beta-actin loading controls
Figure 7
Figure 7
Clinical data from 13 adult NPC1 patients. For demographics, see Materials and methods. (A) Total clinical severity scores [maximum score 50, with higher values equating to increasing levels of disability (Yanjanin et al., 2010)]. Data were plotted prior to initiation of treatment with Tanganil™ (ADLL), incorporating available retrospective data. (B) Clinical data computed as annual severity increment scores (Cortina-Borja et al., 2018) (P < 0.001 in annual severity increment score). (C) Slope of total severity score (severity units per year) before and after ADLL treatment. Each individual participant in this observational study is colour coded.
Figure 8
Figure 8
Effects of ADLL on behavioural and biochemical parameters in 12-week-old Sandhoff disease mice and GM2 patients. Sandhoff untreated (Hexb−/− UT), ADLL (Hexb−/− ADLL). Six to eight animals per group. (A) Front-hind stand mean measurements of Hexb−/− UT and Hexb−/− ADLL, mean ± SD, *P = 0.0323, two-way ANOVA. (B) Front-hind step cycle measurements of Hexb−/− UT and Hexb−/− ADLL, mean ± SD, **P < 0.0063, two-way ANOVA. (C) Percent improvement in clinical scores in three patients with GM2 gangliosidosis on baseline and after 1 month on medication with ADLL. Scale for Assessment and Rating of Ataxia Montreal Cognitive Assessment and 8-meter-walking-test were assessed. Third patient was excluded from Montreal Cognitive Assessment because the test is not approved for children. See also Videos 1 and 2. (D) Unbiased Clinical Impression of Change in Severity scores of GM2 patient videos. Clinical Impression of Change in Severity Skala; 1 = normal, not at all ill; 2 = borderline ill; 3 = mildly ill; 4 = moderately ill; 5 = markedly ill; 6 = severely ill; 7 = among the most extremely ill patients. Paired t-test, P = 0.0039. For individual scoring data see Table 2.
Figure 9
Figure 9
Summary table. Summary table of the effect of AL treatments on investigated pathologies in vivo, ex vivo and in vitro, along with the proposed mechanism of AL treatments in the cerebellum. Red arrows indicate the pathologies in NPC1 relative to its wild-type counterparts. Green arrows indicate the significant changes in response to AL treatment.

References

    1. Boland B, Smith DA, Mooney D, Jung SS, Walsh DM, Platt FM.. Macroautophagy is not directly involved in the metabolism of amyloid precursor protein. J Biol Chem 2010; 285: 37415–26. - PMC - PubMed
    1. Bremova T, Malinova V, Amraoui Y, Mengel E, Reinke J, Kolnikova M, et al. Acetyl-DL-leucine in Niemann-Pick type C: a case series. Neurology 2015; 85: 1368–75. - PubMed
    1. Bremova-ErtlT, , PlattF, , Strupp M. Sandhoff disease: improvement of gait by acetyl-DL-leucine: A case report. Neuropediatrics 2020; 32892336 - PubMed
    1. Chida J, Yamane K, Takei T, Kido H.. An efficient extraction method for quantitation of adenosine triphosphate in mammalian tissues and cells. Anal Chim Acta 2012; 727: 8–12. - PubMed
    1. Churchill GC, Strupp M, Galione A, Platt FM.. Unexpected differences in the pharmacokinetics of N-acetyl-DL-leucine enantiomers after oral dosing and their clinical relevance. PLoS One 2020; 15: e0229585. - PMC - PubMed

LinkOut - more resources