. 2021 Jan;2(1):66-82.
doi: 10.1038/s43018-020-00148-7. Epub 2020 Dec 14.

Targeting immunosuppressive macrophages overcomes PARP inhibitor resistance in BRCA1-associated triple-negative breast cancer

Affiliations

Targeting immunosuppressive macrophages overcomes PARP inhibitor resistance in BRCA1-associated triple-negative breast cancer

Anita K Mehta et al. Nat Cancer. 2021 Jan.

Abstract

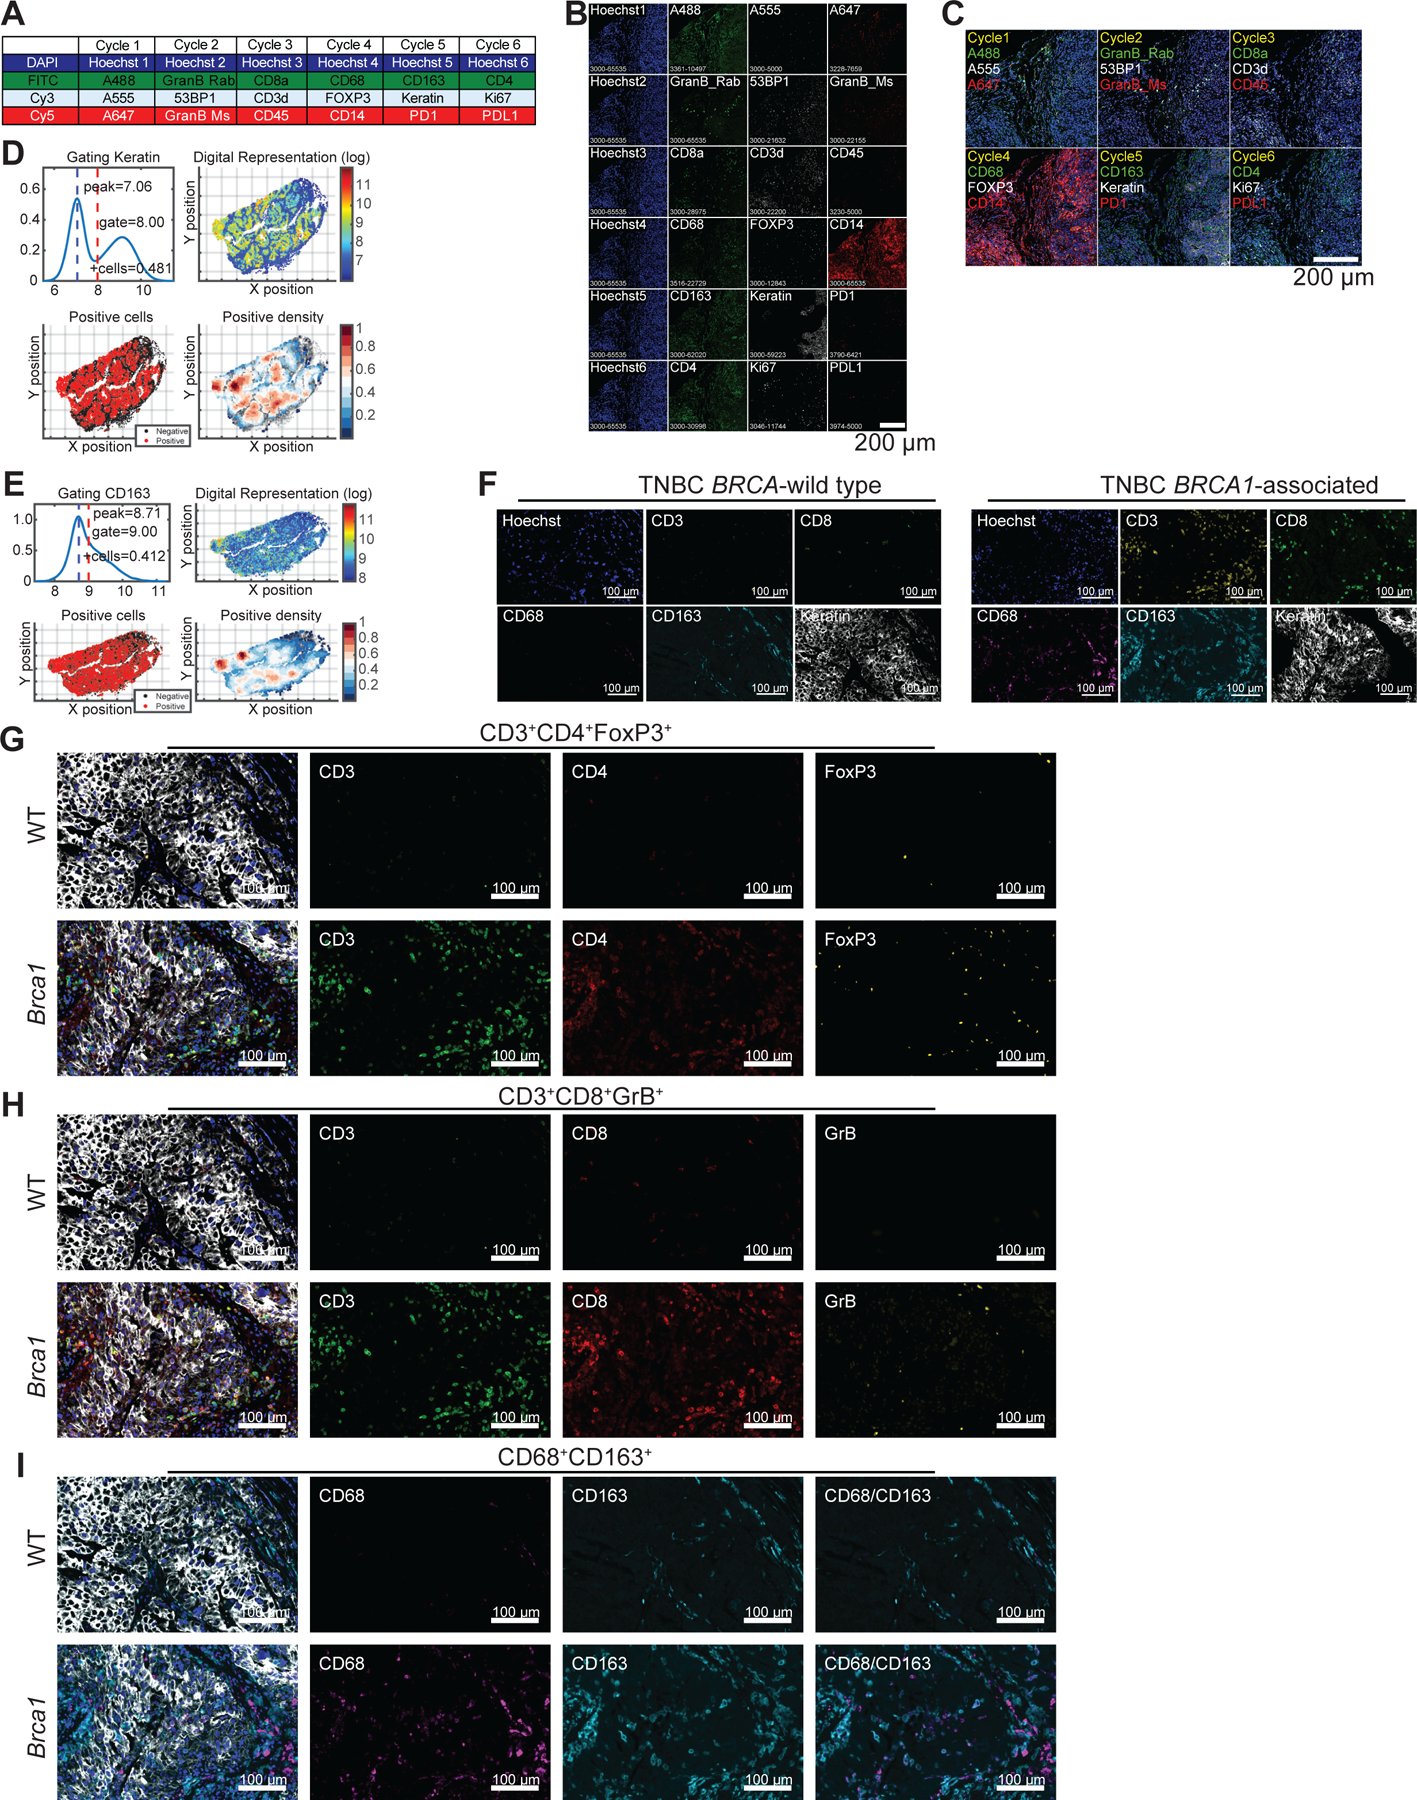
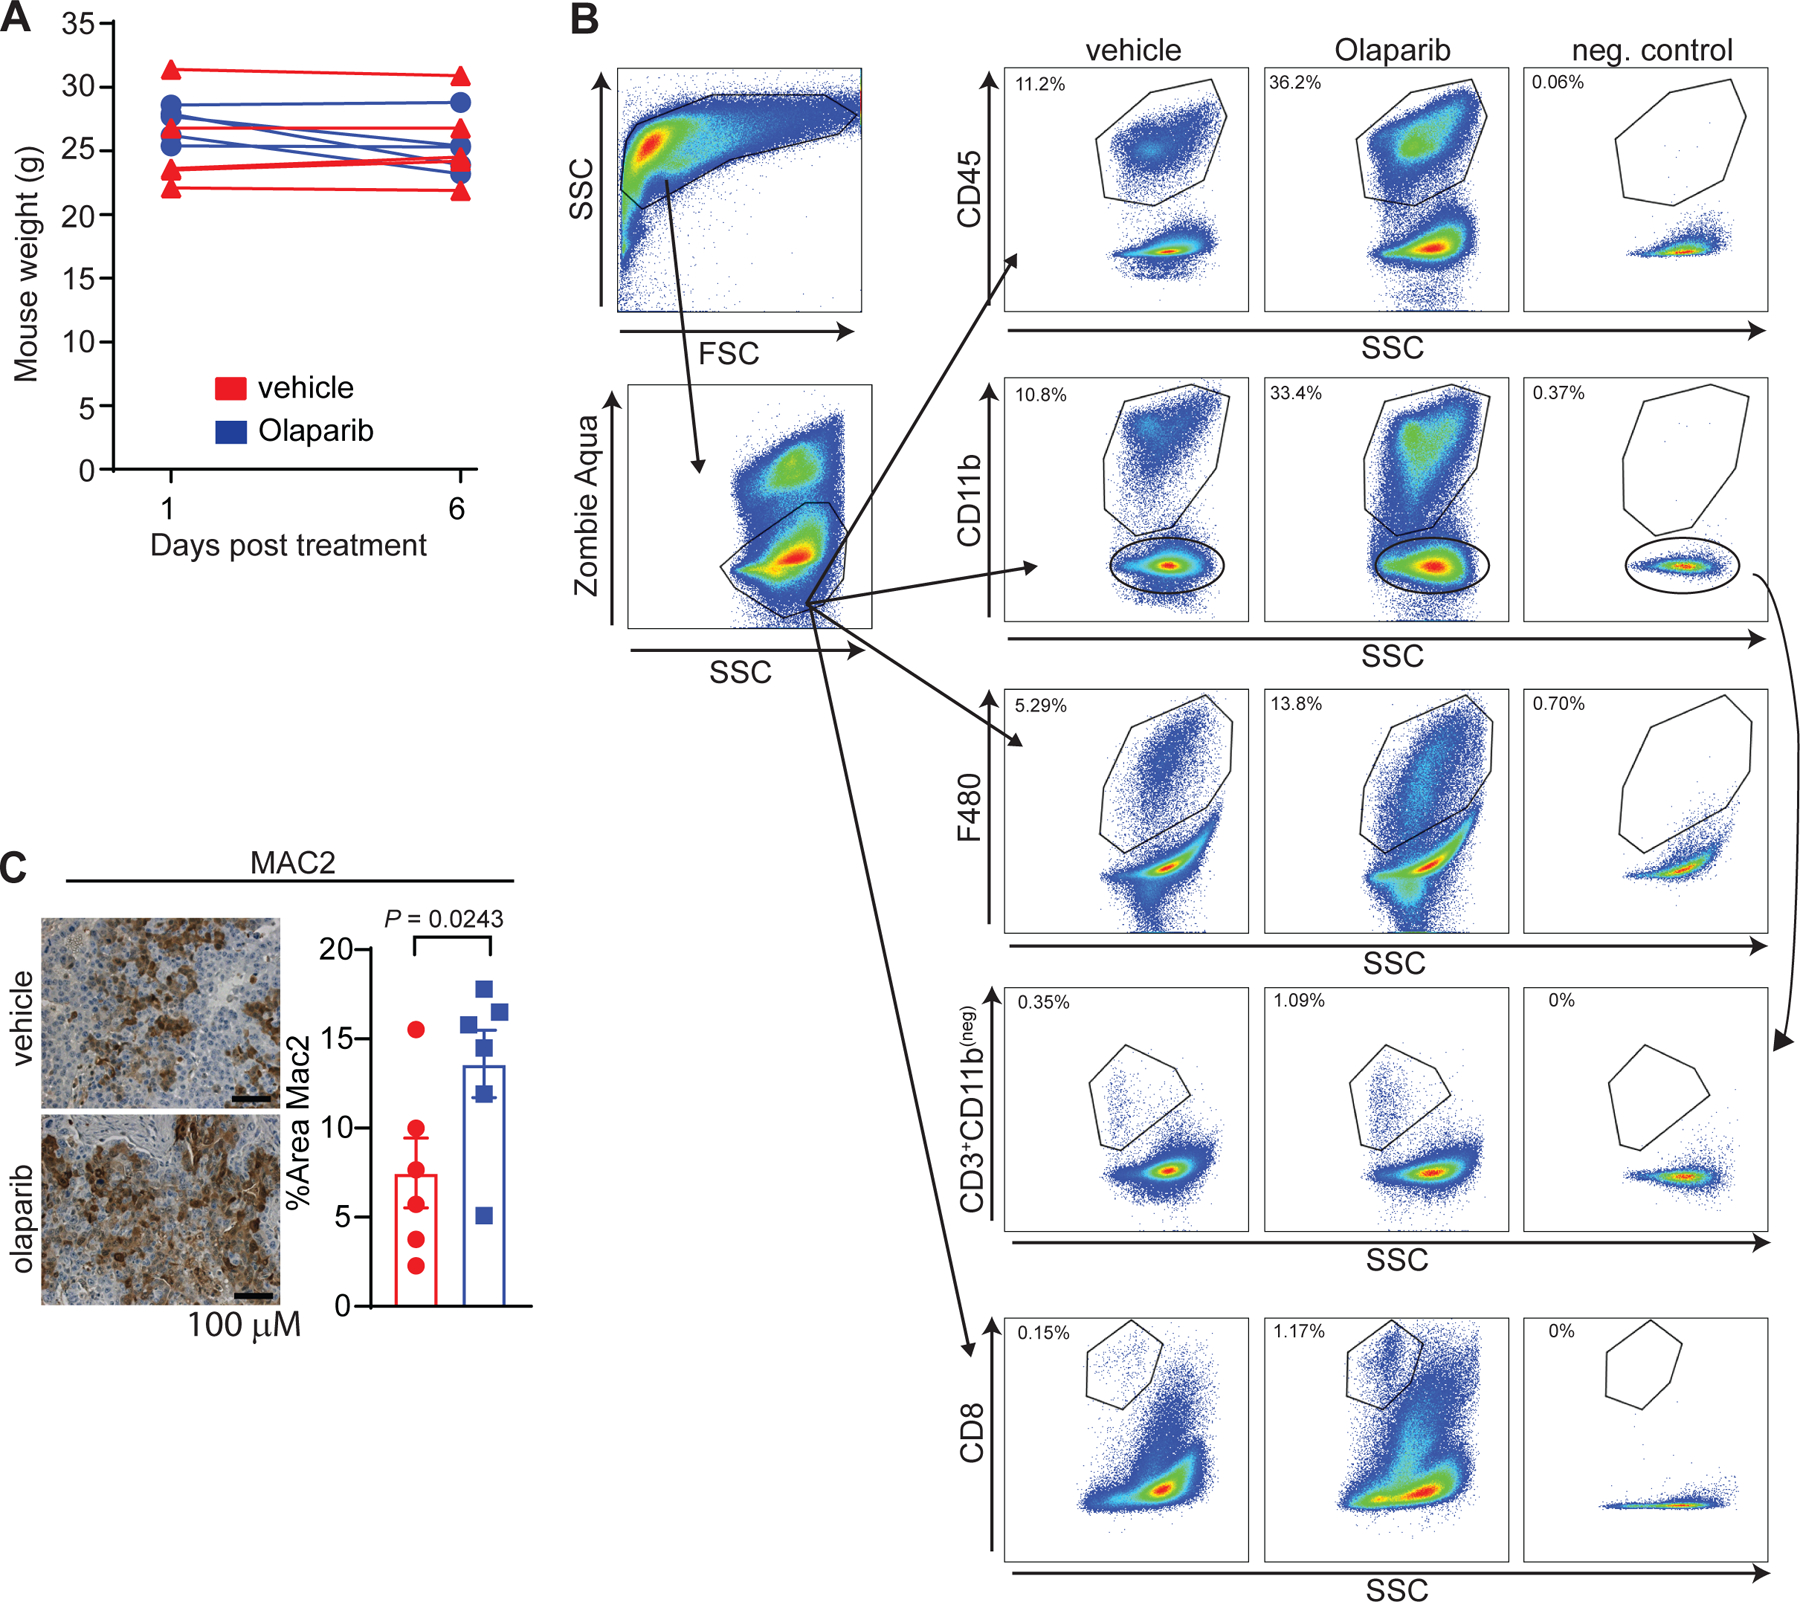
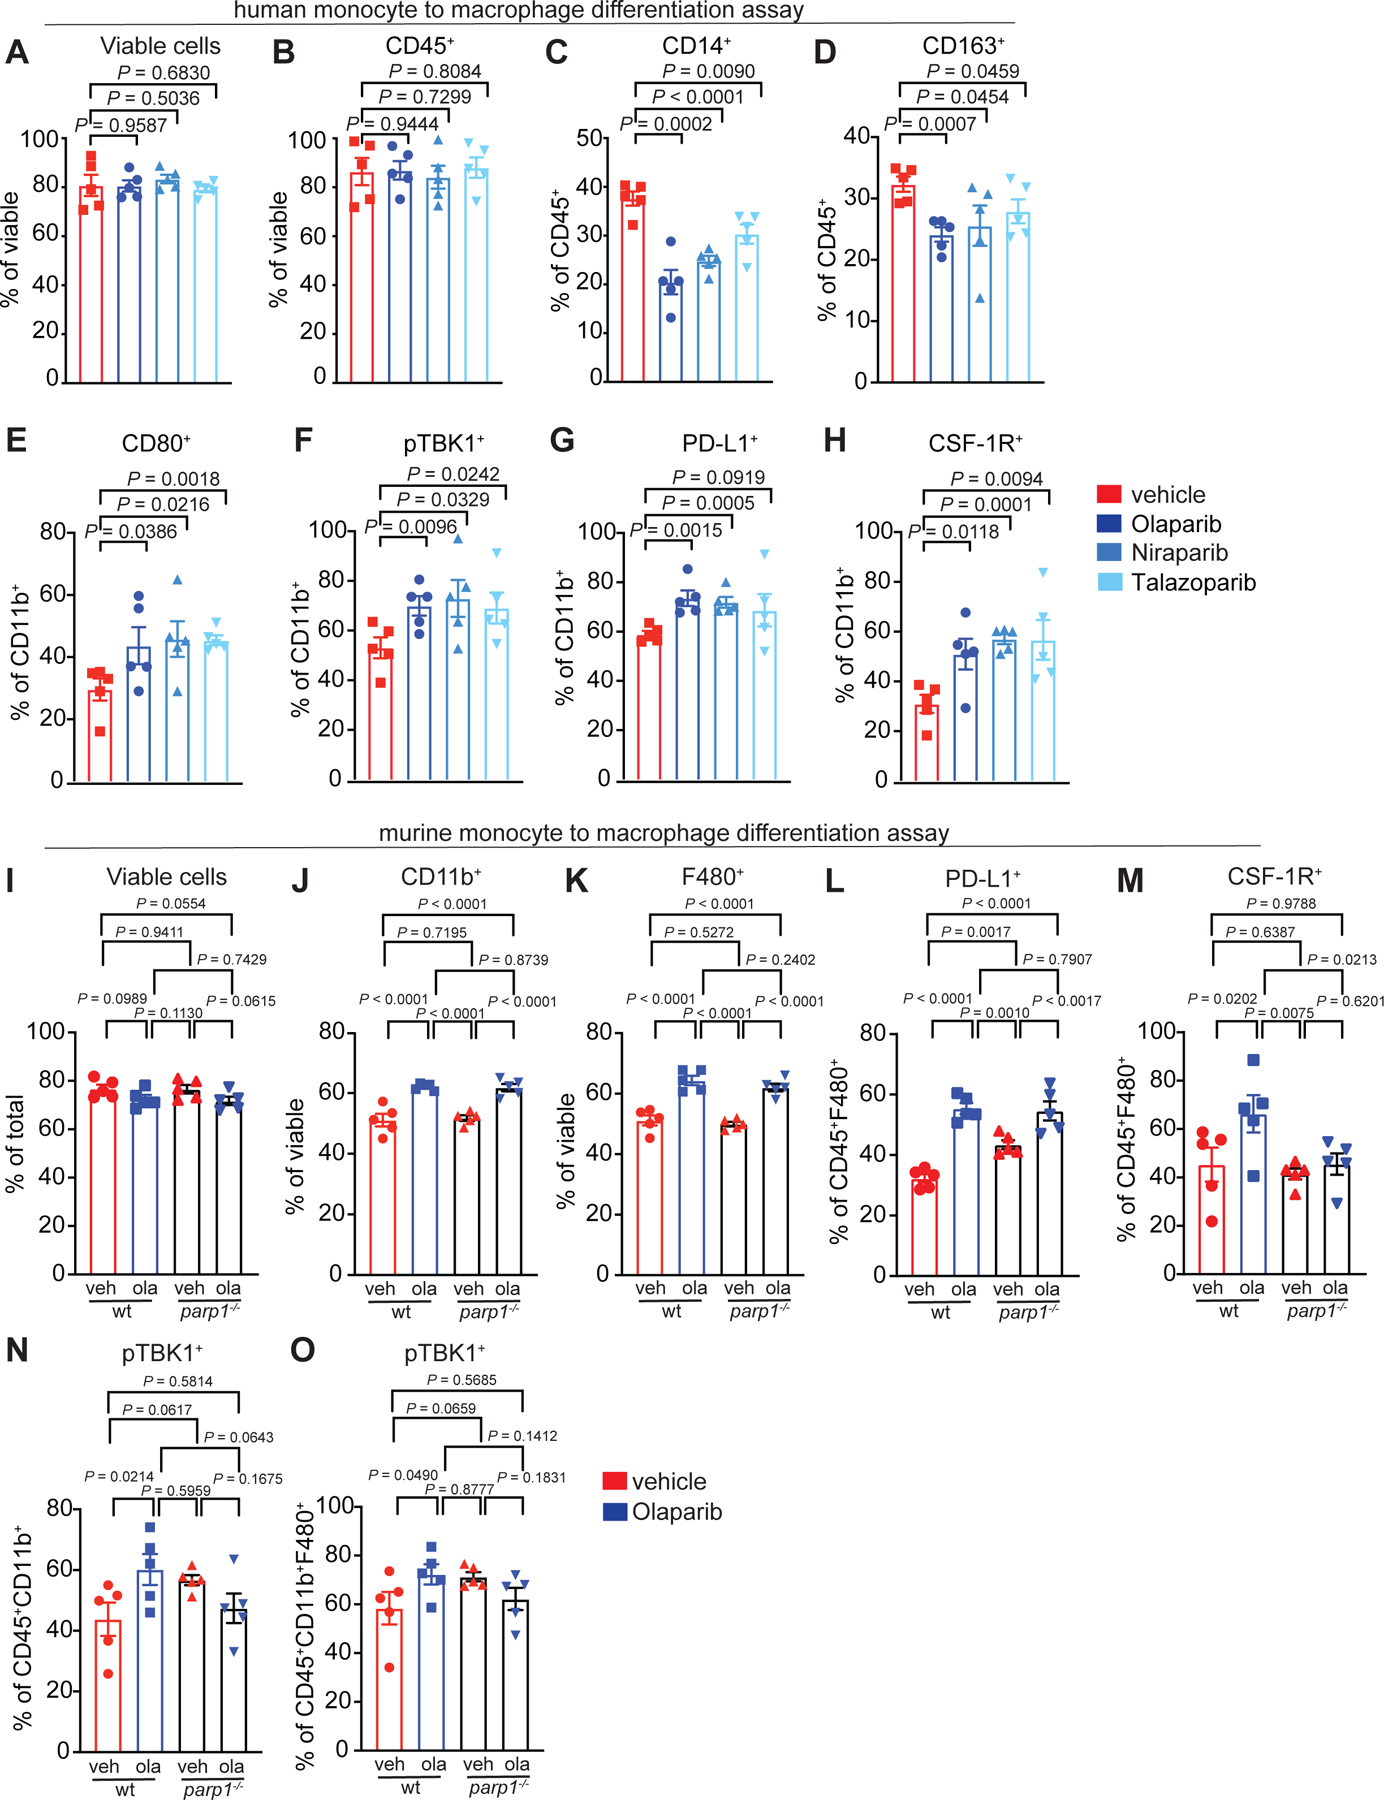
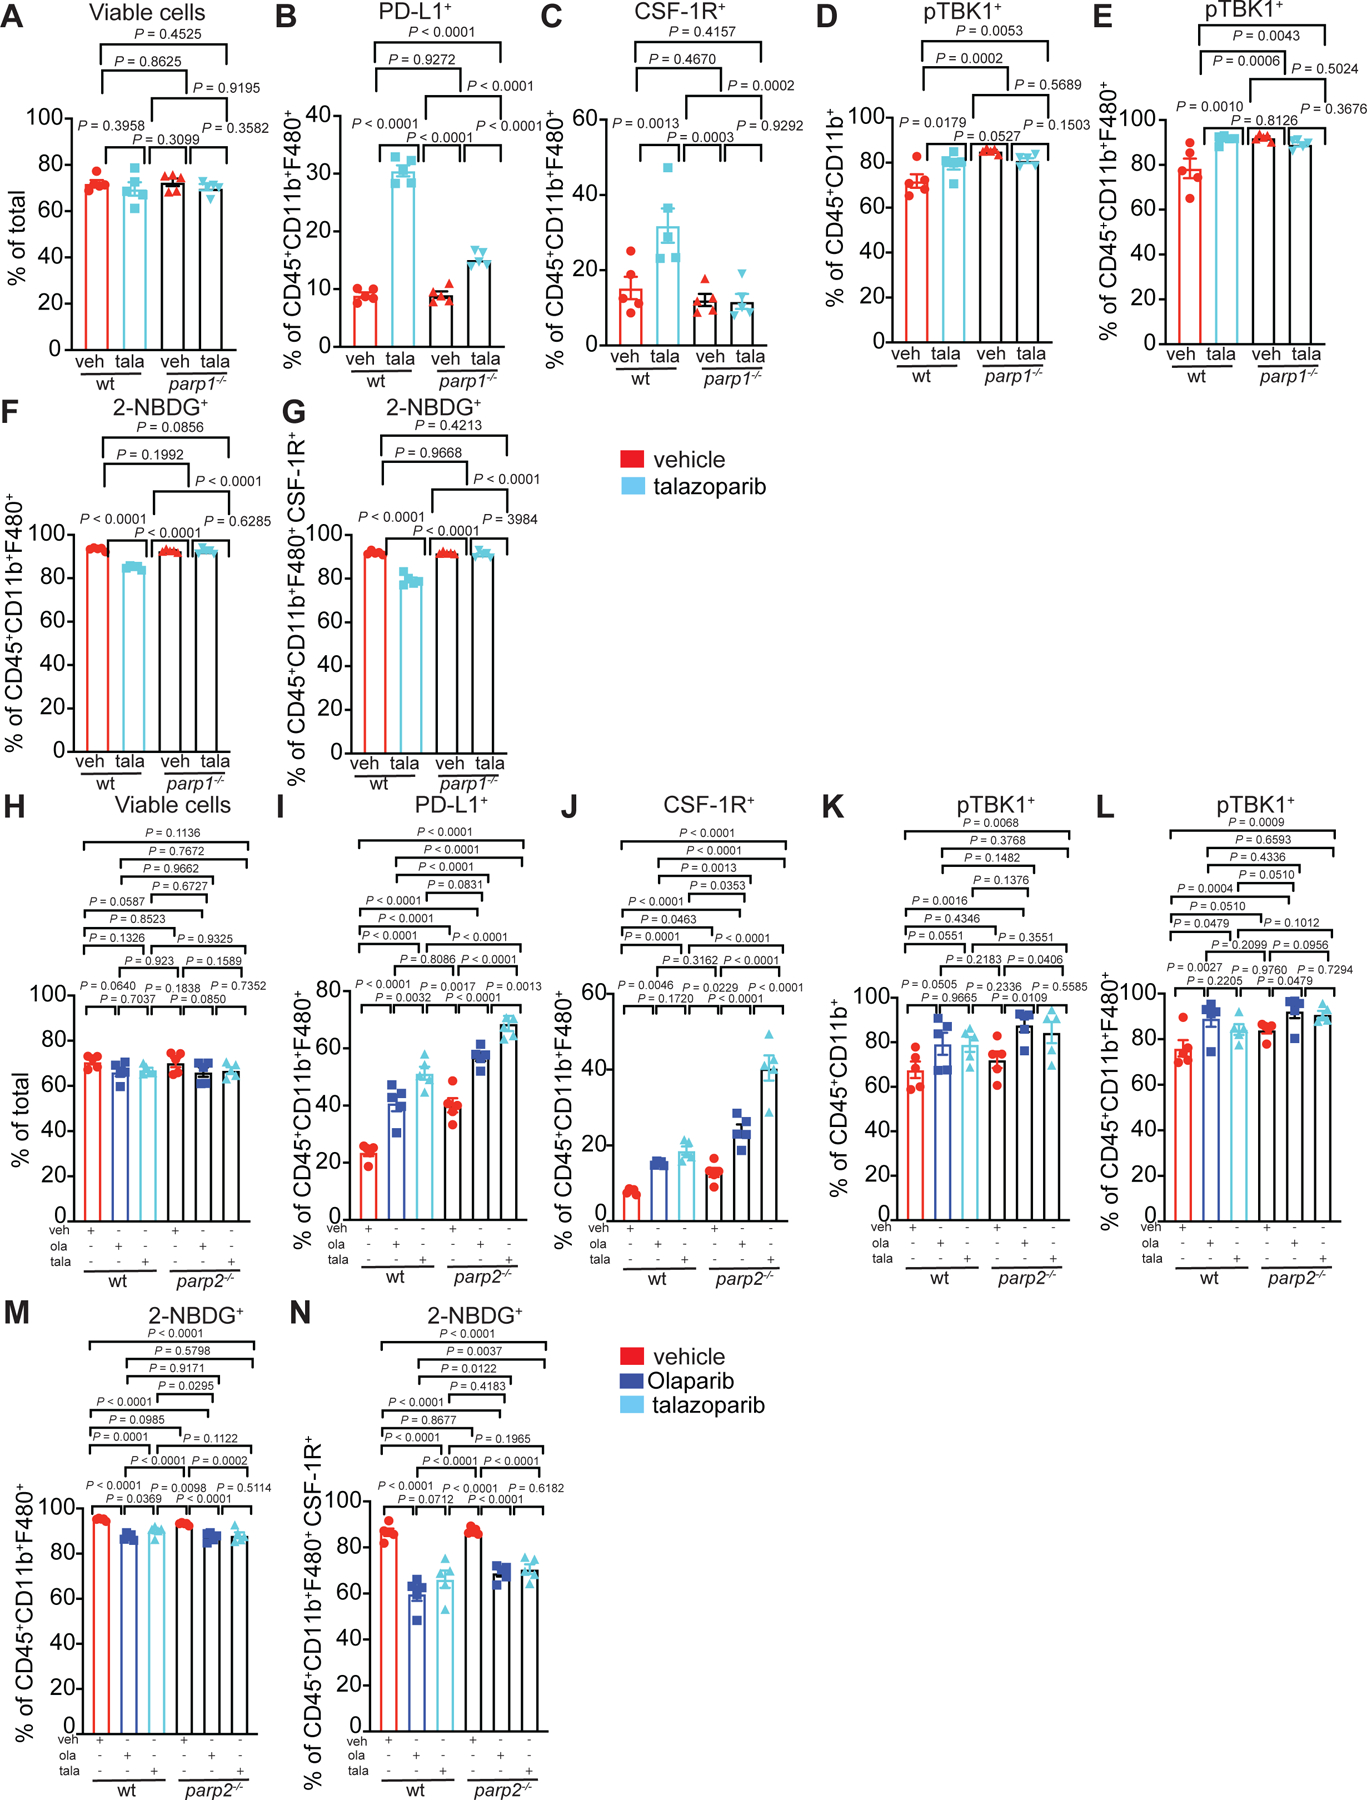
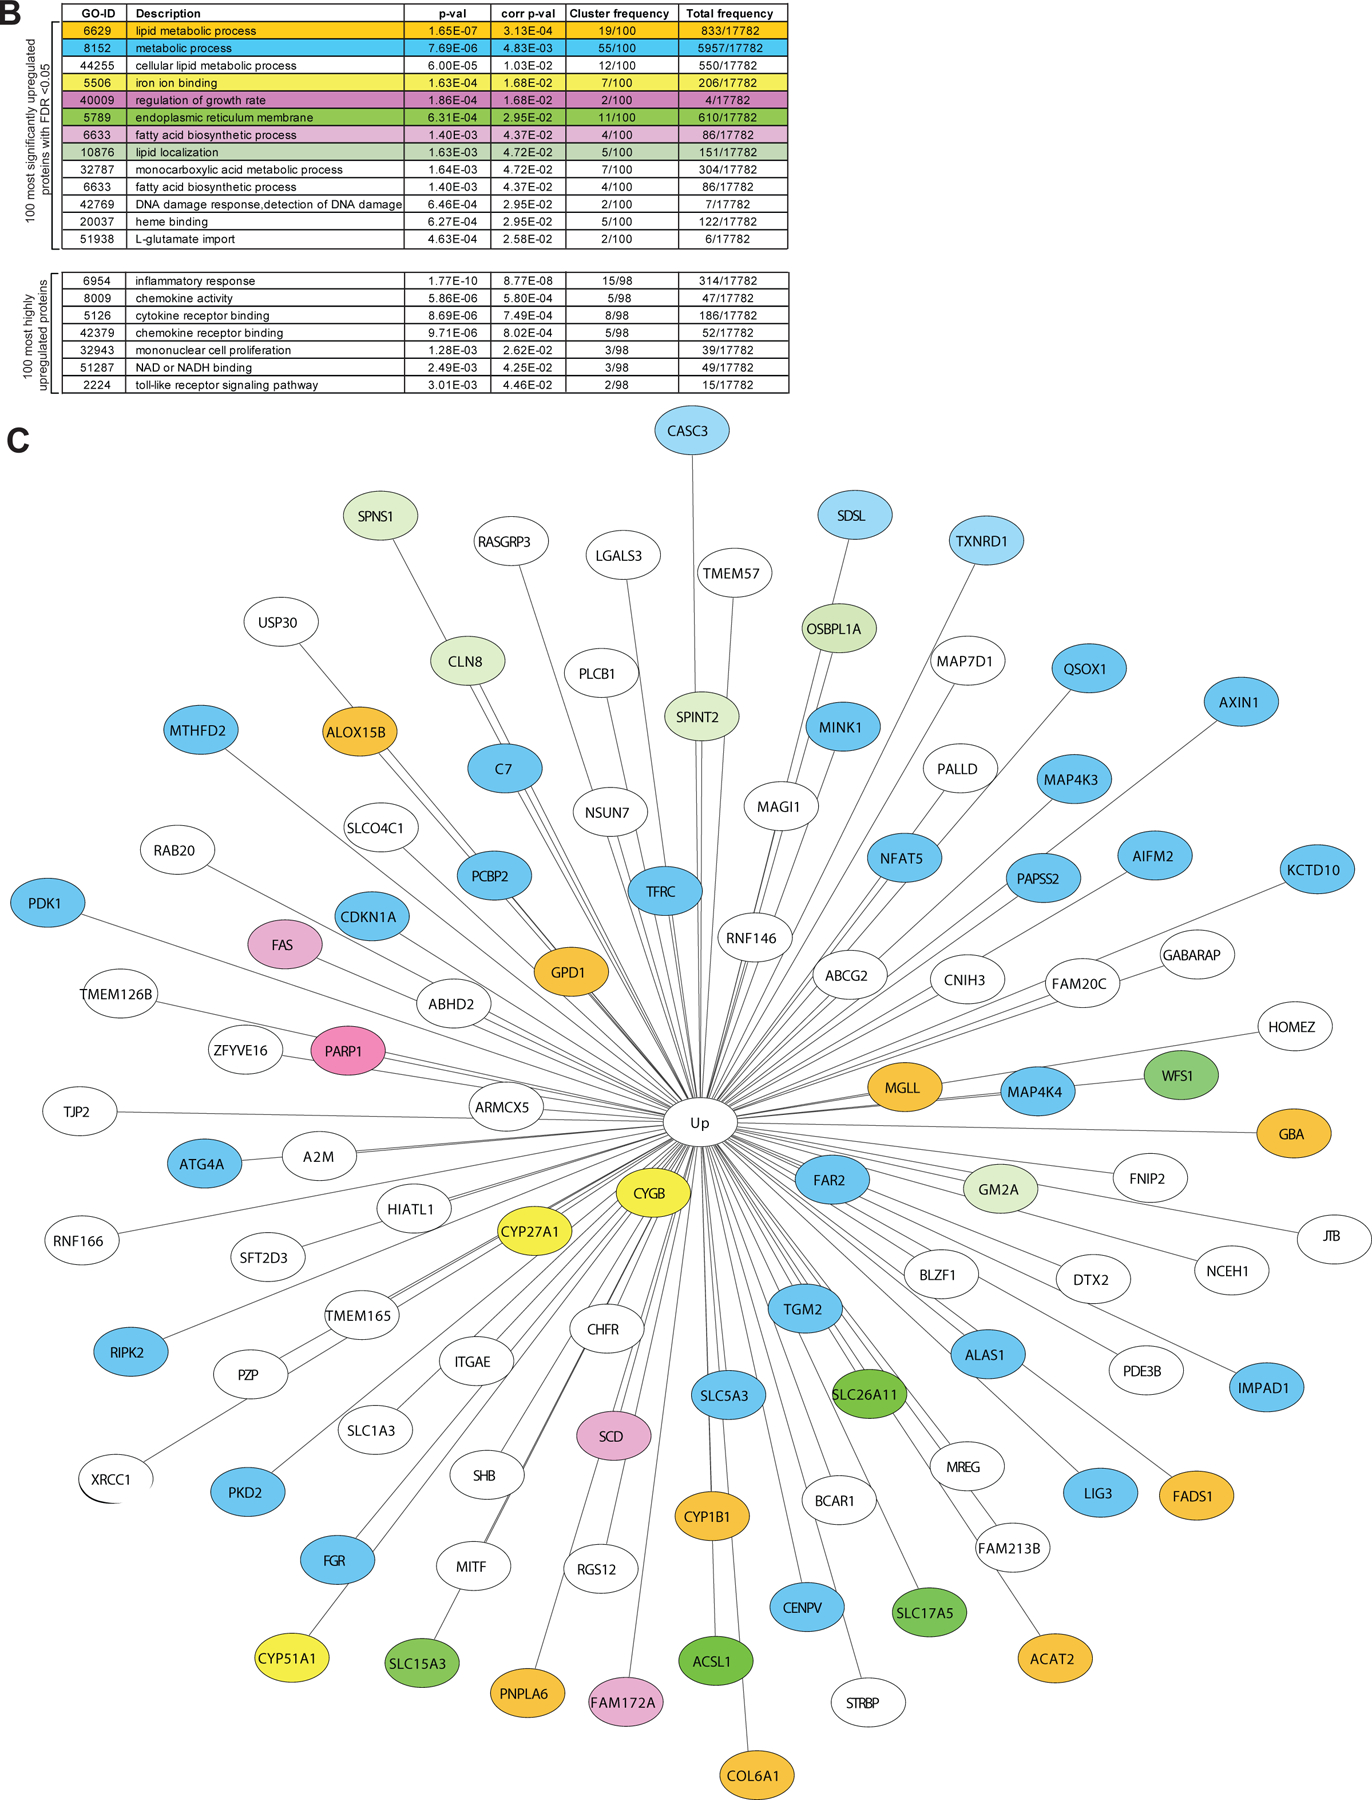
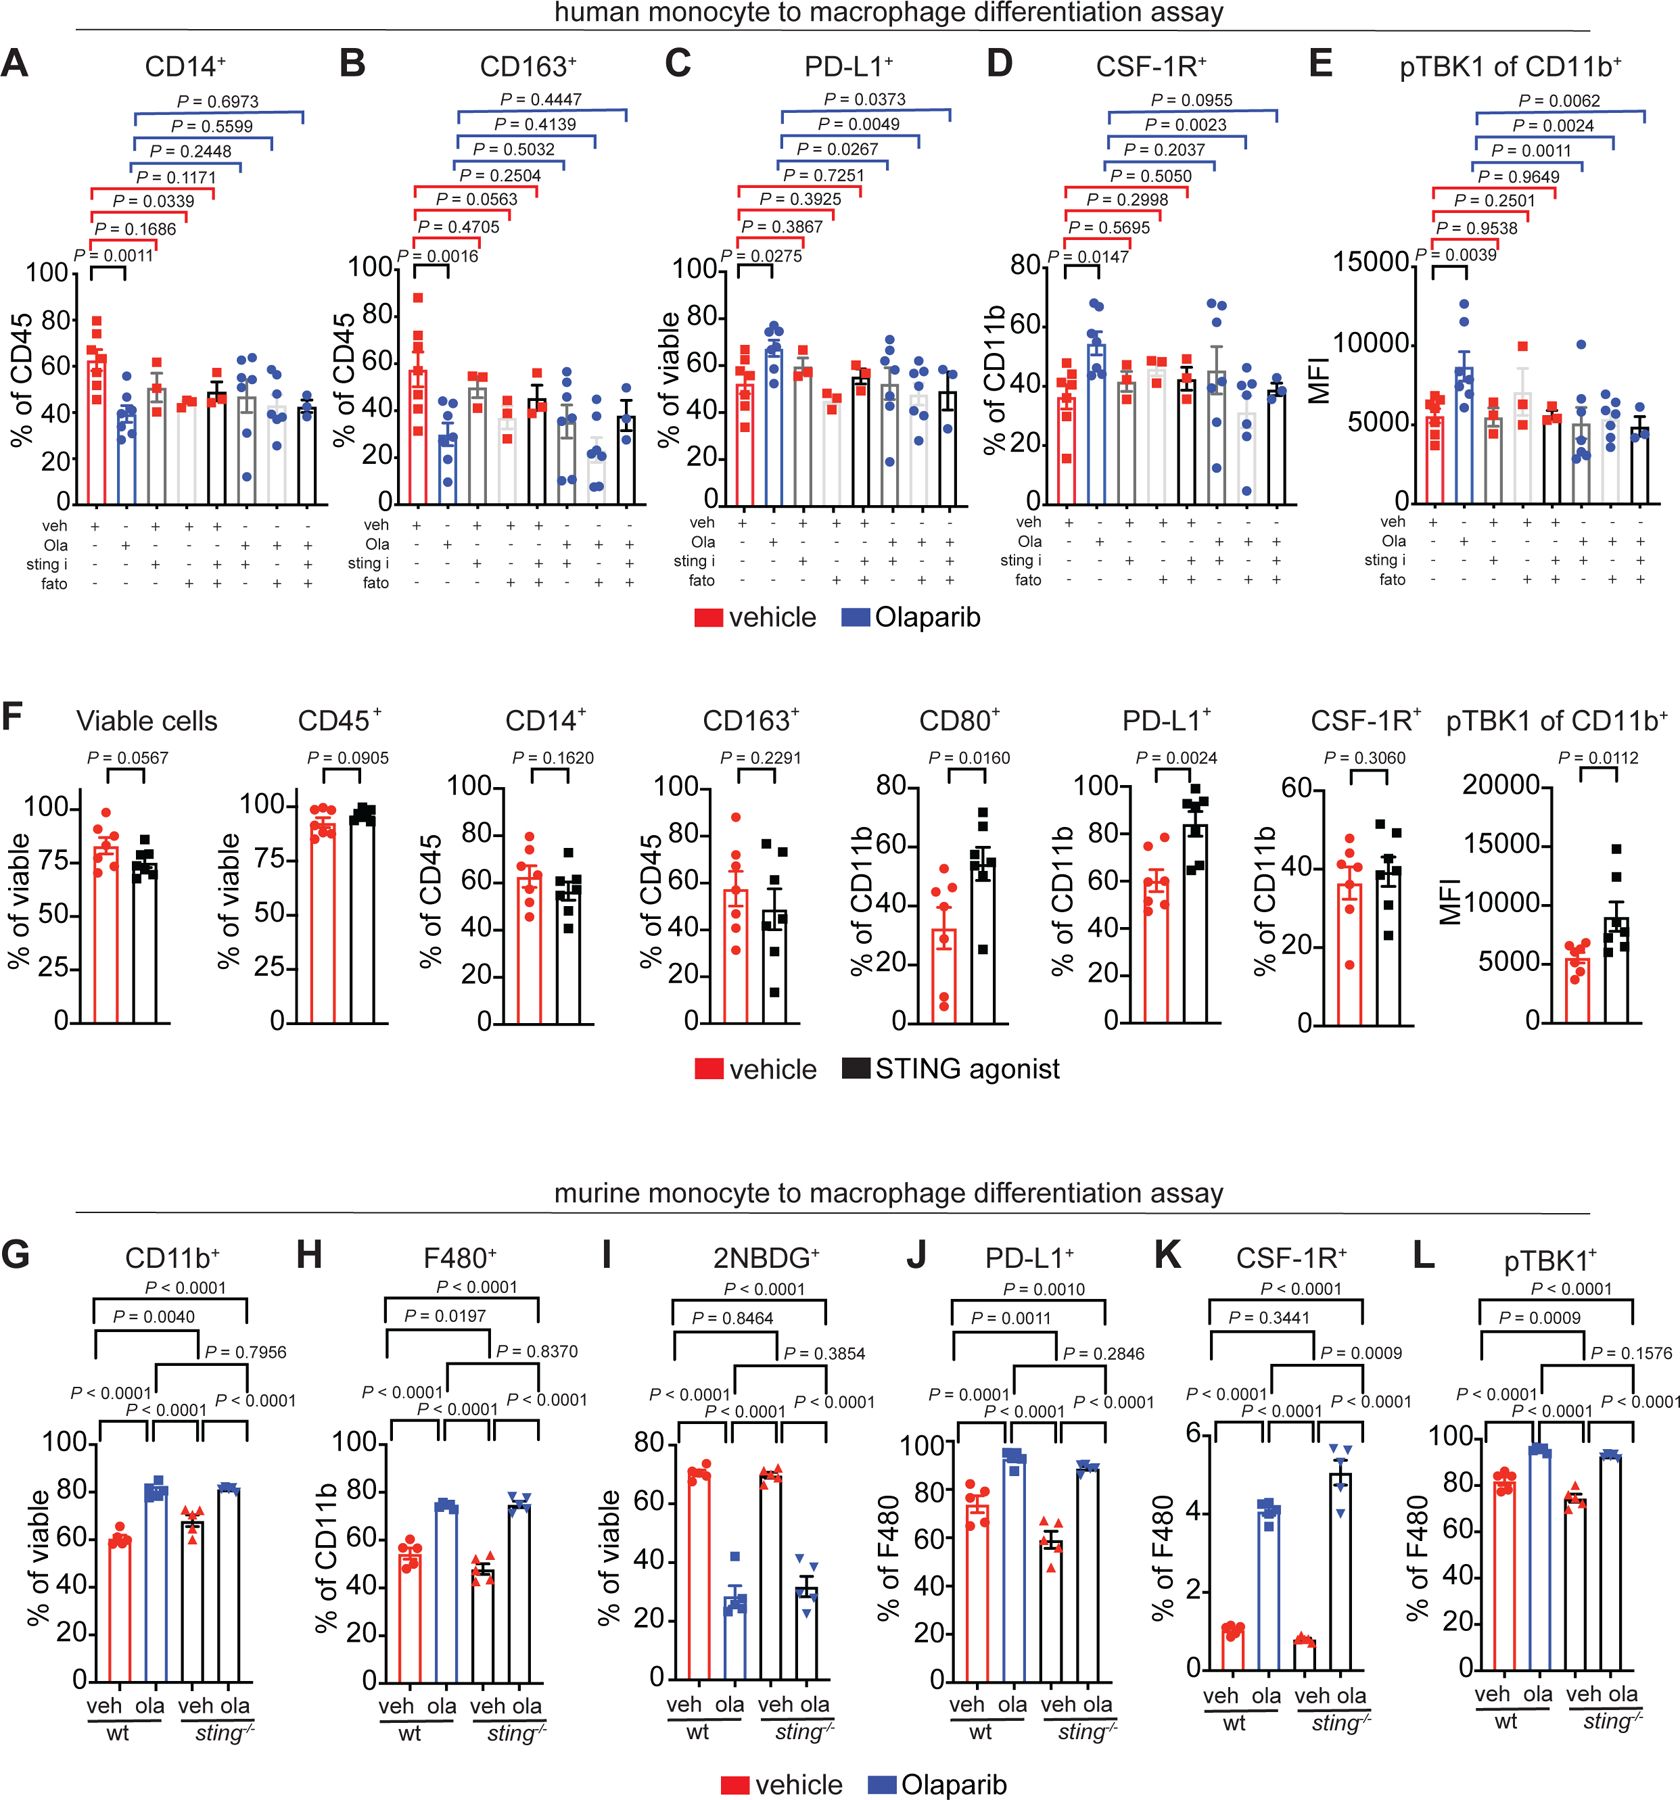
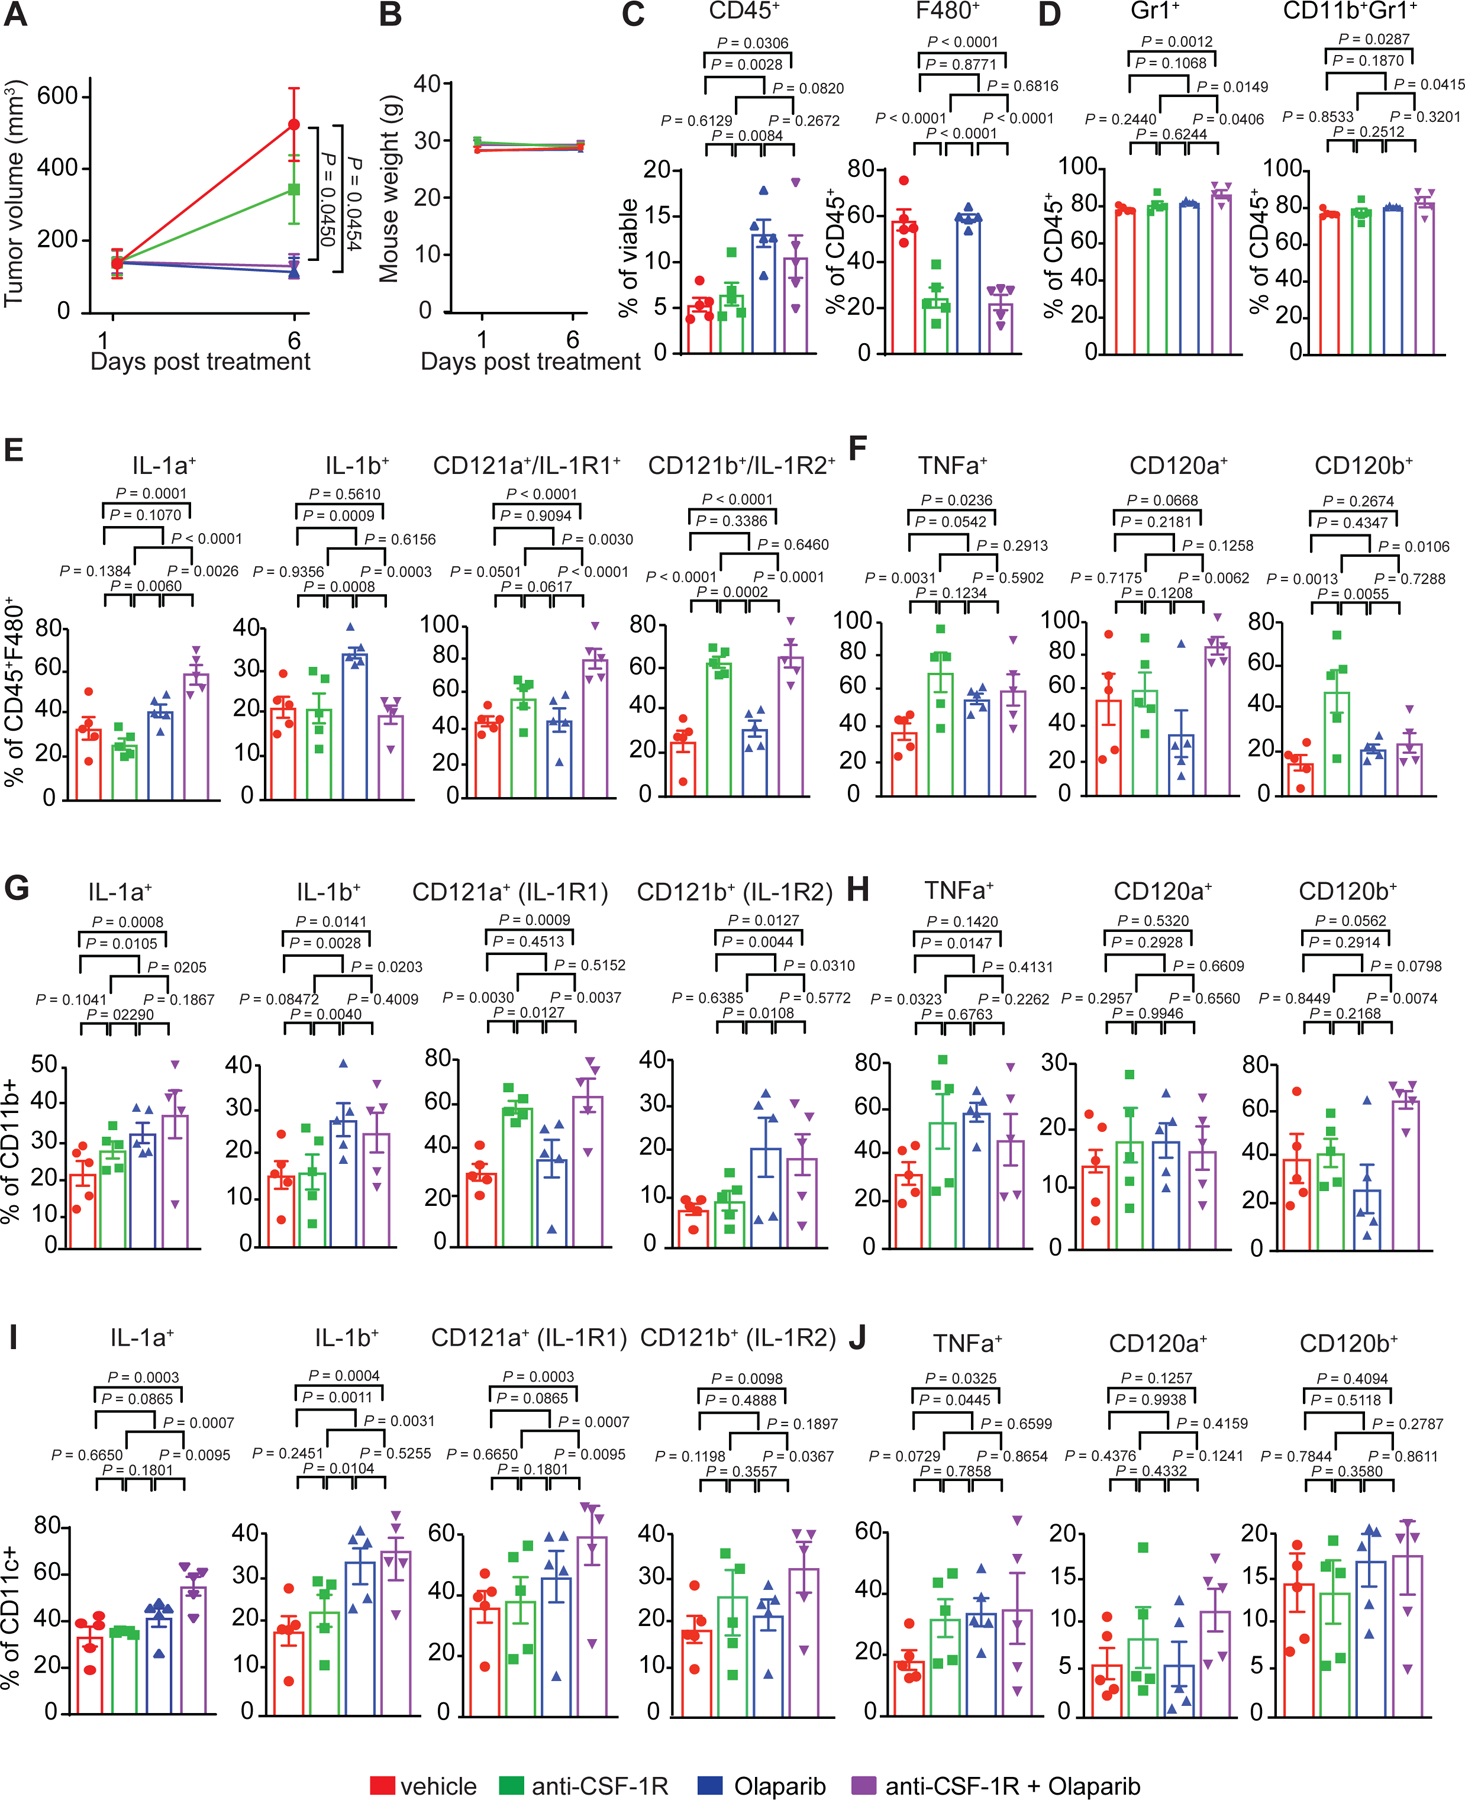
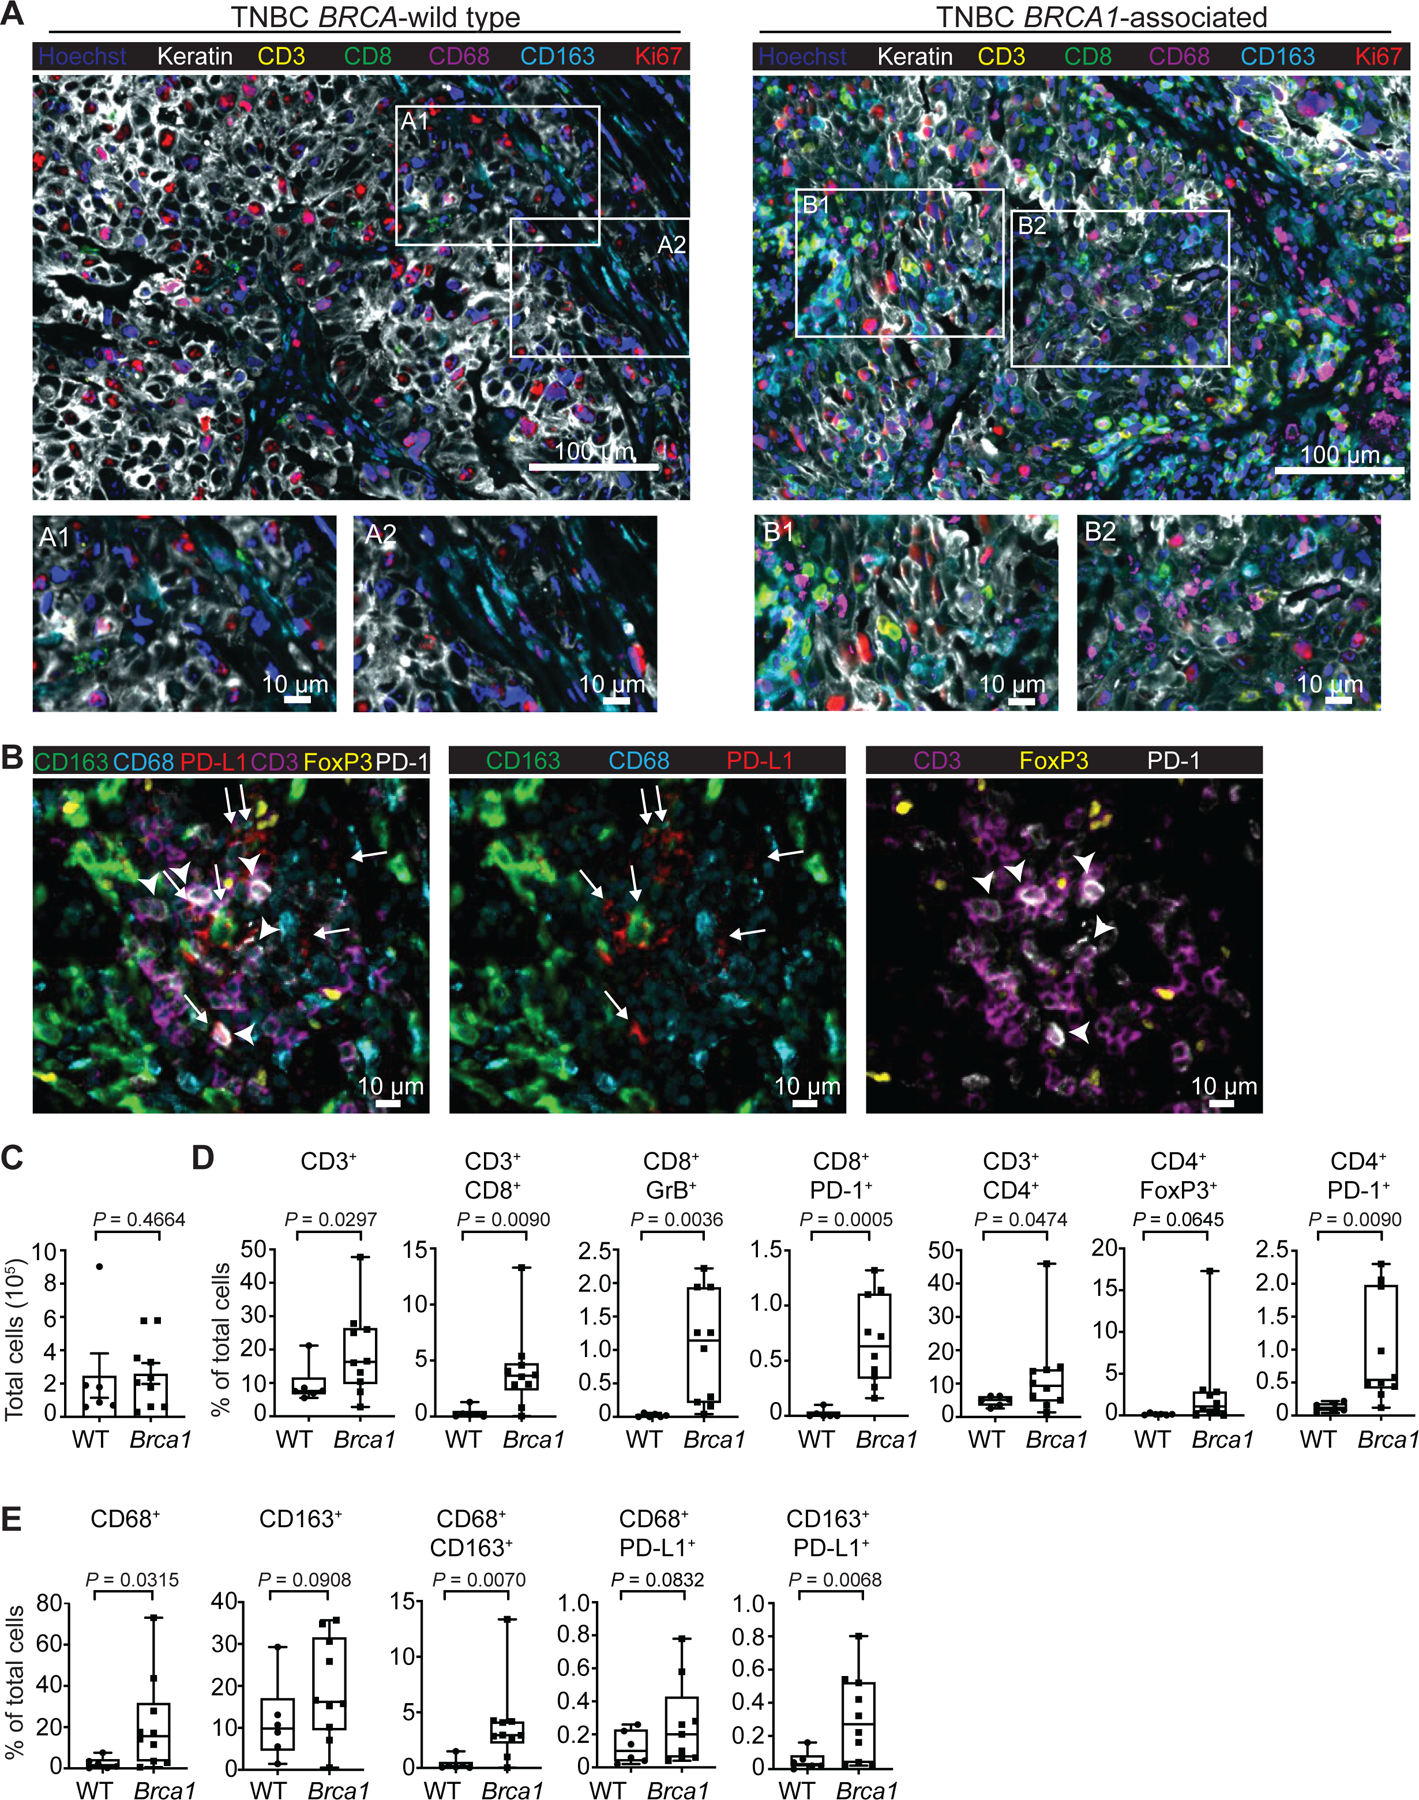
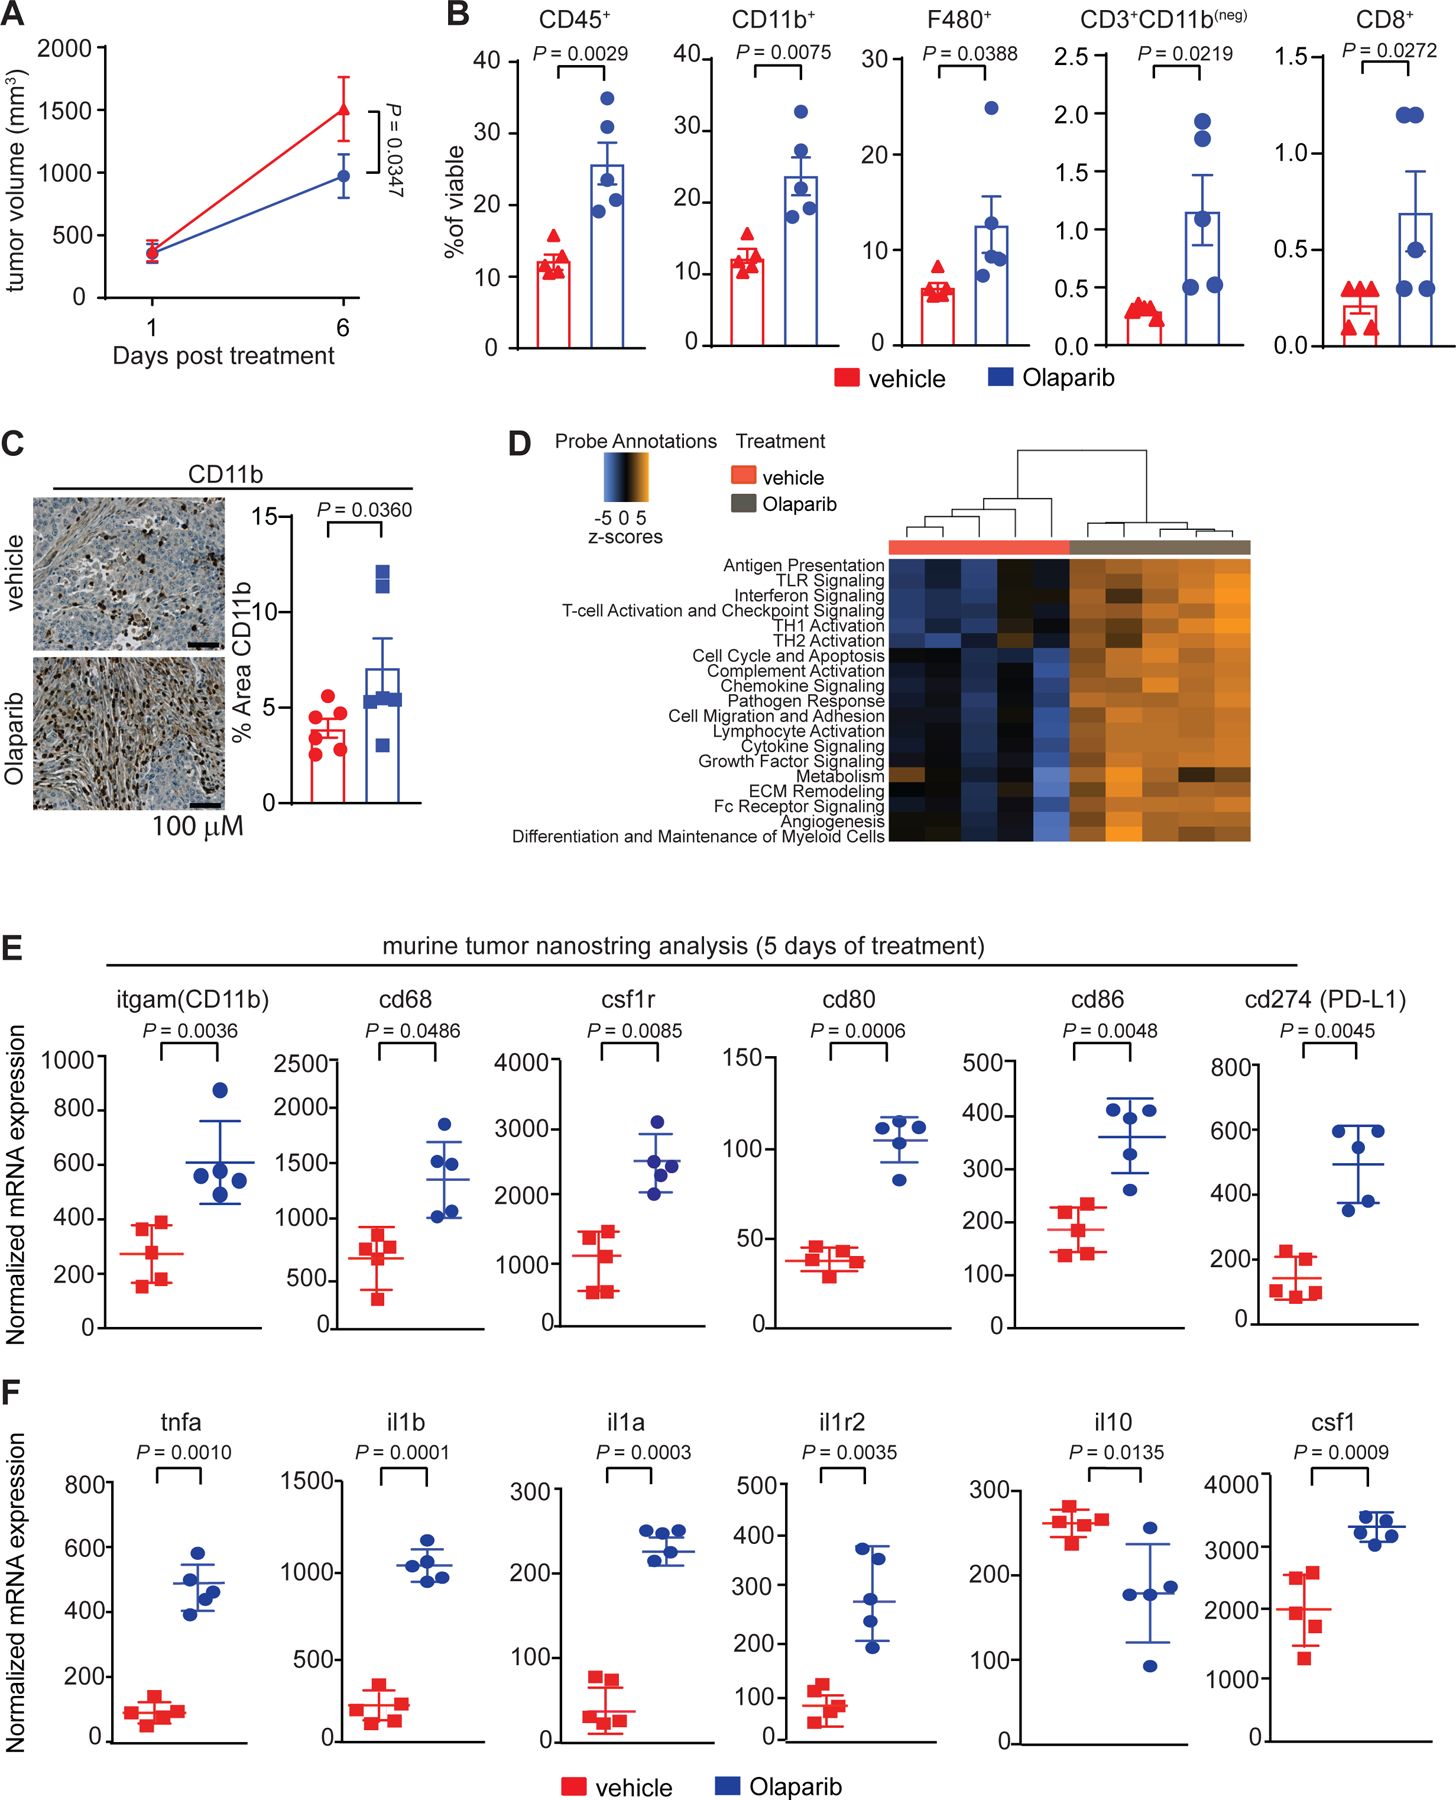
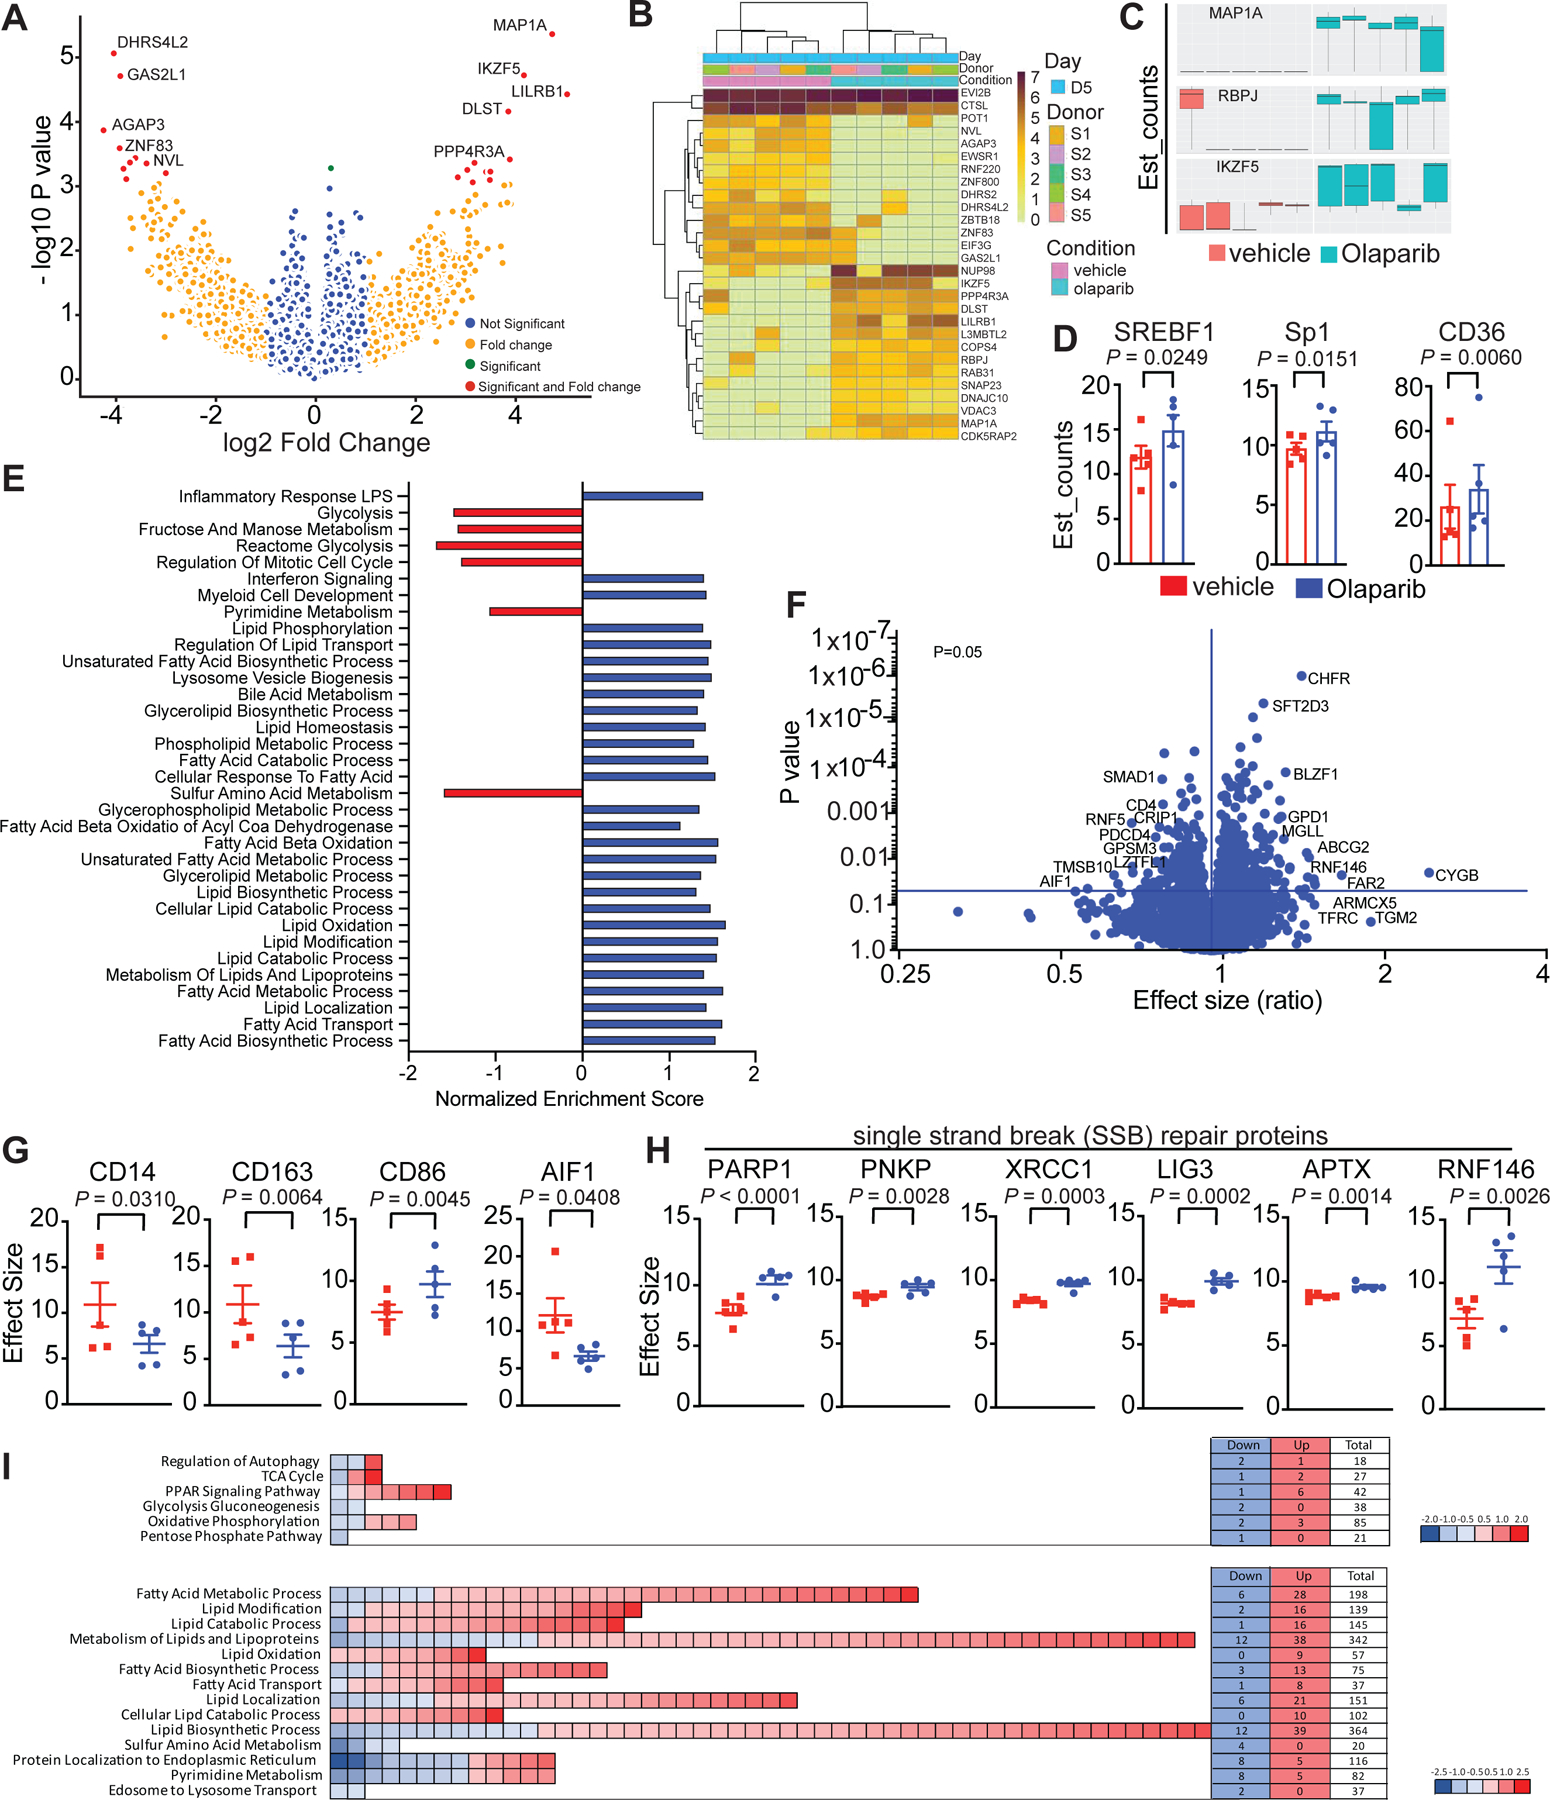
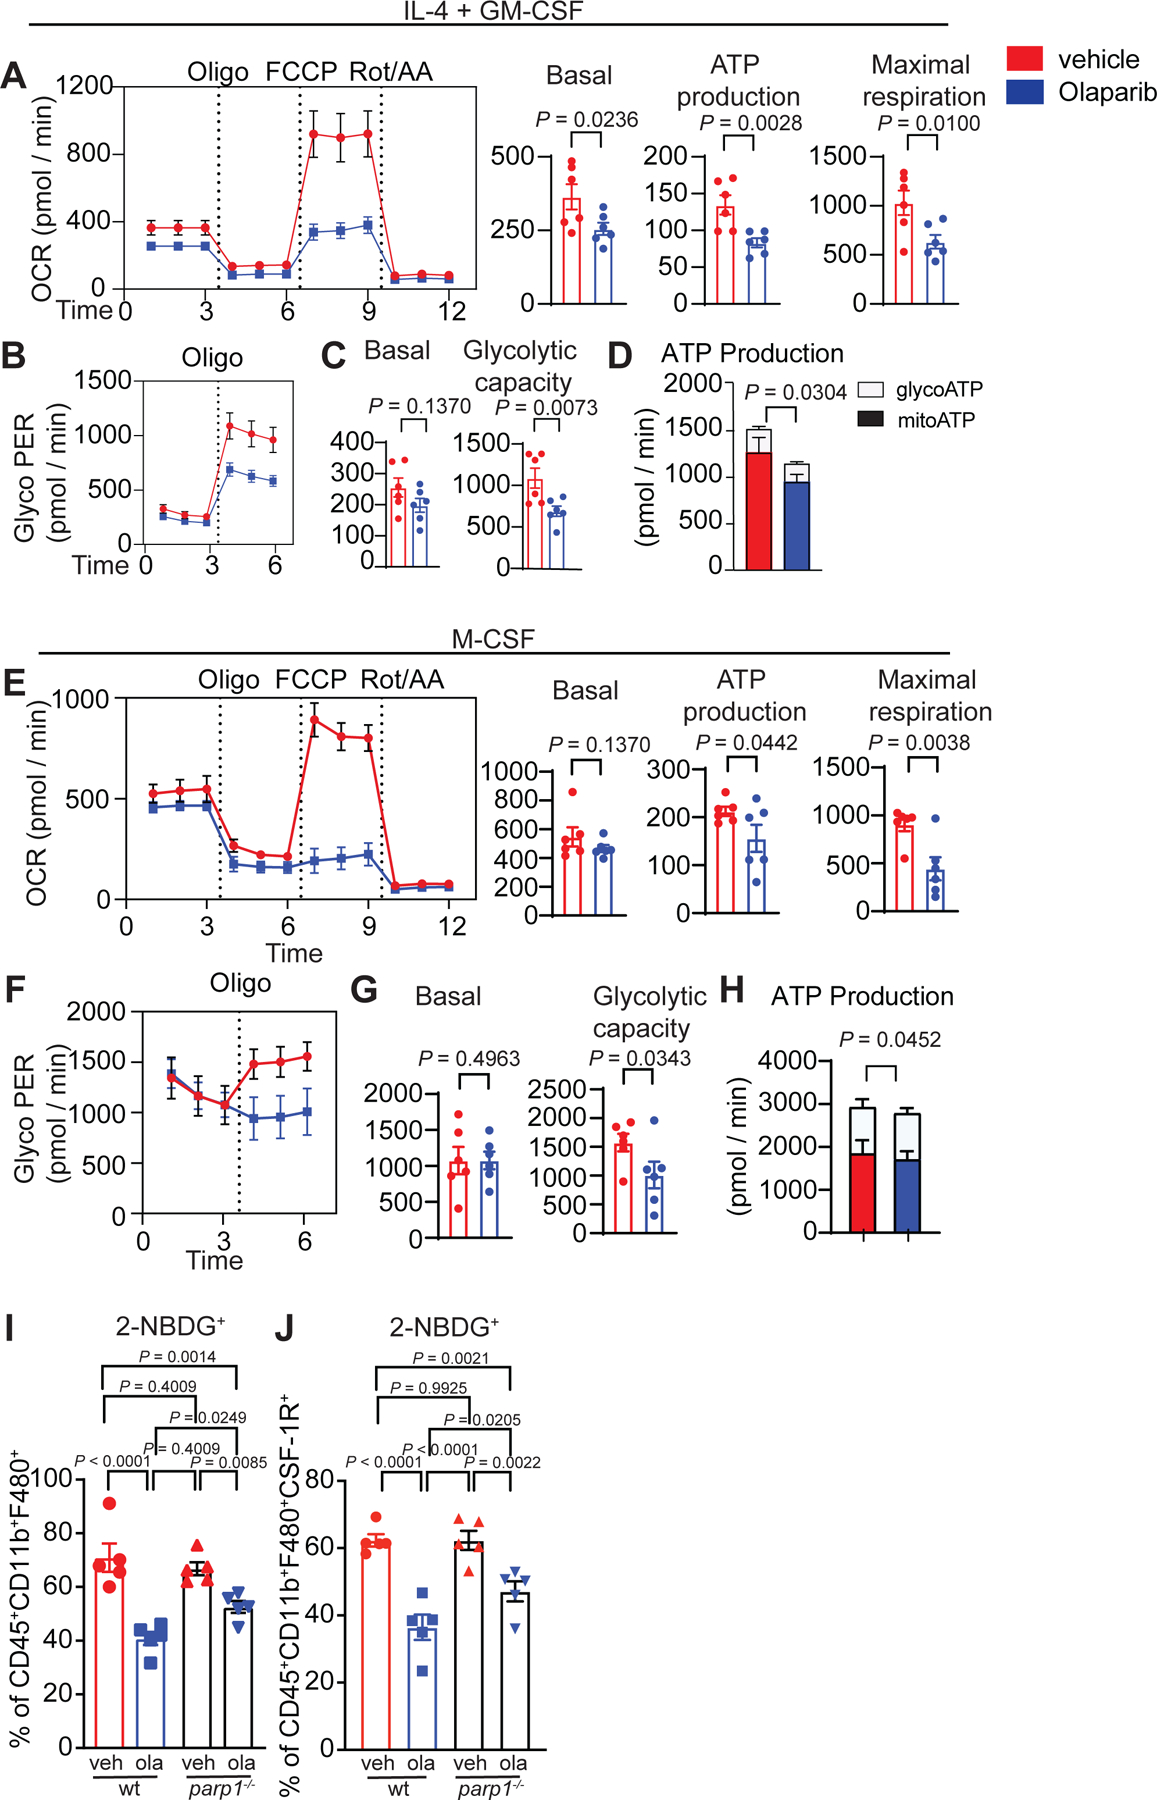
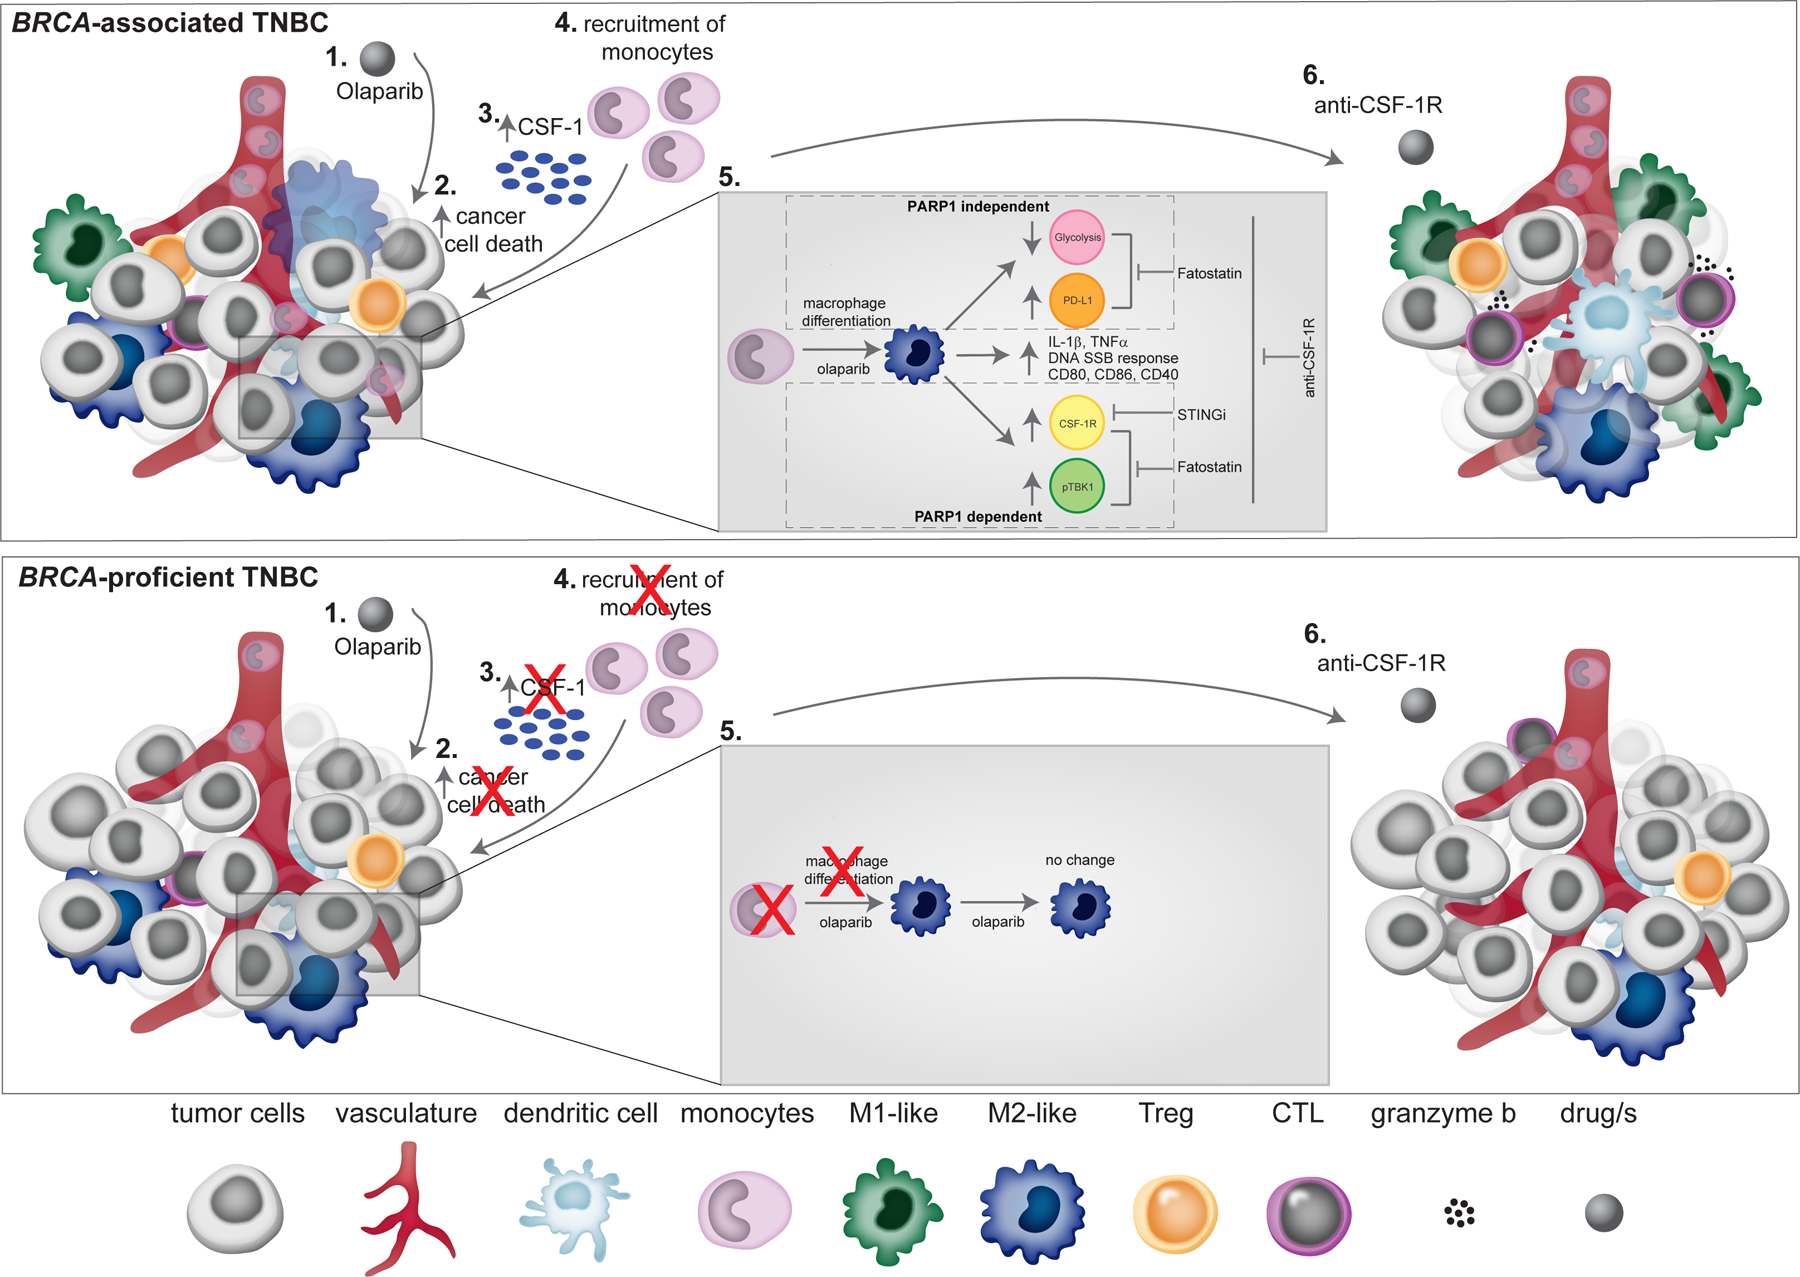
Despite objective responses to PARP inhibition and improvements in progression-free survival compared to standard chemotherapy in patients with BRCA-associated triple-negative breast cancer (TNBC), benefits are transitory. Using high dimensional single-cell profiling of human TNBC, here we demonstrate that macrophages are the predominant infiltrating immune cell type in BRCA-associated TNBC. Through multi-omics profiling we show that PARP inhibitors enhance both anti- and pro-tumor features of macrophages through glucose and lipid metabolic reprogramming driven by the sterol regulatory element-binding protein 1 (SREBP-1) pathway. Combined PARP inhibitor therapy with CSF-1R blocking antibodies significantly enhanced innate and adaptive anti-tumor immunity and extends survival in BRCA-deficient tumors in vivo and is mediated by CD8+ T-cells. Collectively, our results uncover macrophage-mediated immune suppression as a liability of PARP inhibitor treatment and demonstrate combined PARP inhibition and macrophage targeting therapy induces a durable reprogramming of the tumor microenvironment, thus constituting a promising therapeutic strategy for TNBC.


Conflict of interest statement

Competing Interests Statement J.L.G. is a consultant for Glaxo-Smith Kline (GSK), Codagenix, Verseau, Kymera and Array BioPharma and receives sponsored research support from GSK, Array BioPharma and Eli Lilly. G.I.S. has served on advisory boards for Pfizer, Eli Lilly, G1 Therapeutics, Roche, Merck KGaA/EMD-Serono, Sierra Oncology, Bicycle Therapeutics, Fusion Pharmaceuticals, Cybrexa Therapeutics, Astex, Almac, Ipsen, Bayer, Angiex, Daiichi Sankyo, Seattle Genetics, Boehringer Ingelheim, ImmunoMet, Asana, Artios, Atrin, Concarlo Holdings, Syros and Zentalis, and has received sponsored research support from Merck, Eli Lilly, Merck/EMD Serono and Sierra Oncology. Clinical trial support from Pfizer and Array Biopharma has been provided to Dana-Farber Cancer Institute for the conduct of investigator-initiated studies led by G.I.S. He holds a patent entitled, “Dosage regimen for sapacitabine and seliciclib,” also issued to Cyclacel Pharmaceuticals, and a pending patent, entitled, “Compositions and Methods for Predicting Response and Resistance to CDK4/6 Inhibition,” together with Liam Cornell. E.A.M is on the SAB for Astra-Zeneca/Medimmune, Celgene, Genentech, Genomic Health, Merck, Peregrine Pharmaceuticals, SELLAS Lifescience, and Tapimmune and has clinical trial support to her former institution (MDACC) from Astra-Zeneca/Medimmune, EMD-Serono, Galena Biopharma and Genentech as well as Genentech support to a SU2C grant, as well as sponsored Research Support to the laboratory from GSK and Eli Lilly. S.R. receives research funding from Merck, Bristol-Myers Squibb, Gilead and Affimed, and on the scientific advisory board for Immunitas. S.S is a consultant for Rarecyte, Inc. N.T. receives research support from Astra-Zeneca. PKS serves on the SAB or BOD of Glencoe Software, Applied Biomath and RareCyte Inc. and has equity in these companies; he is a member of the NanoString SAB and is also co-founder of Glencoe Software, which contributes to and supports the open-source OME/OMERO image informatics software used in this paper. D.D. consults for Novartis and is on the advisory board for Oncology Analytics, Inc. S.J. receives consulting fees from Venn Therapeutics.

Figures

Extended Figure 1.
Extended Figure 1.
BRCA1-associated TNBC are highly infiltrated with T-cells and macrophages
Extended Figure 2.
Extended Figure 2.
PARP inhibition modulates the tumor microenvironment and increases intratumoral macrophages in BRCA1-deficient TNBC
Extended Figure 3.
Extended Figure 3.
PARP inhibition modulates the tumor microenvironment and increases intratumoral macrophages in BRCA1-deficient TNBC.
Extended Figure 4.
Extended Figure 4.
PARP inhibition modulates the phenotype of differentiating macrophages.
Extended Figure 5.
Extended Figure 5.
Role of PARP1 in differentiating macrophages.
Extended Figure 6:
Extended Figure 6:
The role of PARP1 and PARP2 in PARP inhibitor treated differentiating macrophages.
Extended Figure 7.
Extended Figure 7.
PARP inhibition modulates the metabolic phenotype of differentiating macrophages
Extended Figure 8.
Extended Figure 8.
Role of the STING and SREBP1 pathways on the Olaparib-induced macrophage phenotype.
Extended Figure 9.
Extended Figure 9.
Nanostring validation by flow cytometry
Extended Figure 10.
Extended Figure 10.
Olaparib-treated macrophages suppress T-cell function, which is overcome with anti-CSF-1R therapy in BRCA1-deficient TNBC.
Figure 1.
Figure 1.. BRCA-mutated TNBC are highly infiltrated with T-cells and macrophages.
CyCIF was performed on BRCA wild type (WT; n=6) and BRCA1-associated (n=10) triple negative breast cancer tumors from consented patients. a, Nuclei were stained with DAPI (blue), and tumor cells were identified using a Keratin antibody (white). The T-cell compartment was identified using CD3 (yellow) and CD8 (green) antibodies. Macrophages were identified by CD68 (magenta) and CD163 (cyan) antibodies. Proliferating cells are shown by Ki67 (red). Images were taken at 20x magnification and representative images from all patients are shown. Scale bars are shown at either 100 or 10 μm. Insets A1 and A2 show BRCA-WT tumors with few immune cells. Insets B1 and B2 show BRCA1-associated TNBC with abundant immune cells representing both macrophages and T-cells. b, BRCA1-associated TNBC tumor showing PD-L1+ macrophages (white arrow) and PD-1+ T-cells (white arrowhead) adjacent to each other. There are no keratin positive tumor cells in this field (data not shown). c-e, Quantitation was performed and graphs indicate the minimum, the maximum and the sample median. c, Total number of cells analyzed per tumor section. d, Respective cell populations as a percent of total cells in the tumor are shown. Significant increases in CD3+, CD3+CD8+, CD8+GrB+, CD8+PD-1+, CD3+CD4+, and CD4+PD-1+ populations in the BRCA1-associated compared to BRCA-WT tumors were observed. e, Significant increases in CD68+, CD68+CD163+, and CD163+PD-L1+ macrophages were observed in the BRCA1-associated compared to BRCA-WT tumors. Statistical analysis was performed using Welch’s unpaired one-way t-test. Exact p values indicated in each panel for each comparison. Error bars represent standard error of the mean (±SEM).
Figure 2.
Figure 2.. PARP inhibition modulates the tumor microenvironment and increases intratumoral macrophages in BRCA1-deficient TNBC.
Mice bearing BRCA-deficient TNBC tumors were treated with either vehicle or 50 mg kg−1 of Olaparib. a, Olaparib significantly decreased the total tumor burden after 5 days of treatment. Statistical analysis was performed using two-way ANOVA with multiple comparison and error bar represents ±SEM with n=5 mice per group. b, Olaparib significantly increased the proportion of leukocytes (CD45+), myeloid cells (CD11b+), macrophages (F480+), T-cells (CD3+CD11b(neg)) and CD8+ T-cells, of the total live cells. Statistical analysis was performed using one-tailed unpaired t-test and error bar represents ±SEM with n=5 mice per group. c, Immunohistochemistry for myeloid cells (CD11b+). Images were taken at 20x and representative image of the n=6 mice are shown. Statistical analysis was performed using one-tailed unpaired t-test and error bar represents ±SEM with n=6 mice per group. d-f, RNA was extracted from tumors of mice treated for 5 days with vehicle or Olaparib and NanoString was performed using the myeloid panel V2. d, Pathway scores that are statistically significant (P < 0.05) are shown. e, Gene expression changes associated with Olaparib treatment are shown. Significant increases in the transcripts associated with myeloid cells are shown: (itgam; CD11b), macrophages (cd68), colony stimulating factor 1 receptor (csf1r), co-stimulatory molecules (cd80, cd86), and PD-L1 (cd274). f, Olaparib significantly increased gene expression of pro-inflammatory cytokines (tnfa, il1b, il1a) and their receptors (il1r2) and decreased the anti-inflammatory cytokine (il10) transcript levels. Colony stimulating factor 1 (csf1) was also increased following Olaparib therapy. Normalized data from the NanoString advanced analysis was used and Statistical analysis was performed using unpaired two-tailed t-test. Error bars represent ±SEM with n=5 mice per group. Exact p values indicated in each panel for each comparison.
Figure 3.
Figure 3.. PARP inhibition modulates macrophage phenotype.
a-g, Mice bearing BRCA-deficient TNBC tumors were treated with either vehicle or 50 mg kg−1 of Olaparib. Tumors were harvested and immunophenotyping was performed by flow cytometry. a, Following Olaparib therapy, there was an increase in macrophages (CD45+F480+) that express co-stimulatory (CD80) and activation (CD40) markers. b, The CD80+CD86+ and CD40+ populations were significantly increased in both the CD206 positive and negative macrophage populations. c, The anti-tumor to pro-tumor macrophage ratio was increased after Olaparib treatment. d, pTBK1 was increased in macrophages (F480+) and mature macrophages (F480+MHCII+) in tumors of Olaparib-treated mice. e, The proportion of PD-L1+ macrophages (PD-L1+F480+) and tumor cells (CD45(neg)) increased following Olaparib treatment, as did CSF-1R expression on macrophages (F480+CSF-1R+ (f)) including an increase in the double positive population of (PD-L1+CSF-1R+) (g). Error bars represent standard error of mean (±SEM). Statistical analyses were performed using two tailed t-test with n=5 mice per group. h-p, CD14+ cells were isolated from healthy human donors and differentiated to mature myeloid cells with either IL-4 plus GM-CSF (h-n) or M-CSF (o,p) in the presence or absence of Olaparib for 5 days, and analysis was performed by flow cytometry. Shown are changes in h, CD14+ cells, i, CD163, j, CD80 and CD86 on different myeloid populations. The same flow plots are used for k and l; highlighted quadrants in each figure are plotted. m-n, Olaparib increased the expression of pTBK1 and PD-L1 on CD11b+ myeloid cells. o-p, M-CSF differentiated macrophages treated with Olaparib increased expression of CSF-1R and CD206+. Error bars represent standard error of mean (±SEM). Statistical analyses were performed using two tailed t-test with n=4 healthy human donors. Exact p values indicated in each panel for each comparison.
Figure 4.
Figure 4.. PARP inhibition modulates the metabolic phenotype of differentiating macrophages.
CD14+ cells from healthy human donors were isolated and differentiated to immature myeloid cells with GM-CSF + IL-4 in presence or absence of Olaparib for 5 days. a-f, RNA sequencing was performed. a, Transcriptomic data is represented as a volcano plot, showing the five most significantly upregulated or downregulated genes after Olaparib treatment and b, in a heatmap showing the most significantly upregulated (dark brown) or downregulated (light yellow) genes after Olaparib treatment. c, Box plots represents most significantly upregulated genes in donor dependent manner, all 5 donors are shown, the minimum, the maximum, the sample median are shown. Statistical analysis for transcriptomics analysis is described in the methods section. d, Genes associated with lipid metabolism are shown. Statistical analyses were performed using one-tailed t-test. Error bars represent standard error of the mean (±SEM) with n=5 healthy human donors per group. e, RNA sequencing revealed significantly enriched gene sets in Olaparib treated donors. Exact p values indicated in each panel for each comparison. f-i, Proteomics was performed and f, a volcano plot is shown, on the x-axis is the effect size (ratio) and on the y-axis is the p-value. The most significantly upregulated and downregulated proteins with a false discovery rate (FDR<0.05) are shown. g-h, Olaparib induced changes are shown. Error bars represent standard error of mean (±SEM). Statistical analyses were performed using one-tailed t-test. Exact p values indicated in each panel for each comparison. i, The number of genes associated with glucose and lipid metabolism are shown.
Figure 5.
Figure 5.. PARP inhibition modulates the glycolytic capacity of macrophages.
CD14+ cells from healthy human donors were isolated and differentiated to immature myeloid cells with GM-CSF + IL-4 (a-d) or M-CSF (e-h) in presence or absence of Olaparib for 5 days. Myeloid cells were collected, and extracellular flux measurements by Seahorse was performed on n=6 healthy human donors. a,e, Olaparib decreases the oxygen consumption rate of myeloid cells. b, f, Glyco PER, a proxy for the rate of lactate production measured in vehicle and Olaparib treated human myeloid cells under basal condition and after 1 μM oligomycin. c-d,g-h, Metabolic parameters obtained from the Glyco PER profiling. Error bars represent standard error of mean (±SEM). Statistical analyses were performed using one-tailed t-test. Statistical analysis for transcriptomics analysis is described in the methods section. Exact p values indicated in each panel for each comparison. i-j, Bone marrow from wild-type (wt) and parp1−/− mice were isolated and differentiated to mature myeloid cells with IL-4 plus GM-CSF in the presence or absence of Olaparib for 5 days. Both wt and parp1−/− differentiated myeloid cells treated with Olaparib exhibited reduced glucose uptake independent of PARP1. Statistical analysis was performed using One-way ANOVA with Uncorrected Fisher’s LSD. Error bars represent standard error of the mean (±SEM) with n=5 mice per group. Exact p values indicated in each panel for each comparison.
Figure 6.
Figure 6.. Anti-CSF-1R therapy enhances PARP inhibitor therapy in BRCA1-deficient TNBC.
Mice bearing BRCA-deficient TNBC tumors were treated with either vehicle, anti-CSF-1R, Olaparib, or anti-CSF-1R plus Olaparib for the indicated time. Mice were treated daily with Olaparib (50 mg kg−1, IP) and twice a week with anti-CSF-1R (1.2 mg/mouse). a-c, Mice were treated for 35 days and tumor volumes were recorded at indicated time points. The combination of anti-CSF-1R plus Olaparib significantly increased overall survival compared to single agent treatment. The number of mice are shown, with median survival. Statistical analysis was performed using Gehan-Breslow-Wilcoxon test. c, Four out of 5 mice treated with anti-CSF-1R plus Olaparib remained tumor free out to day 63, whereas the Olaparib treated mice had relapsed. Error bars represent standard error of mean (±SEM). Statistical analyses were performed using two-tailed t-test with n=5 mice per group. d-e, Mice were treated for five days and tumors were harvested and immunophenotyping was performed by flow cytometry and changes in macrophages are shown. Statistical analyses were performed using one-way ANOVA with n=5 mice per group. f-g. K14-Cre Brca1f/fTrp53f/f parental and BRCA1 restored isogenic tumors were treated for 5 days, (f) n=5 mice per group except Olaparib group where there were n=6 mice per group; and (g, left) n=3 tumors per group and (g, right) n=4 tumors per group. f, Flow cytometry revealed decreased recruitment of macrophages into BRCA1-restored tumors. g, qRT-PCR analysis of brca1 and csf1 of murine K14-Cre Brca1f/fTrp53f/f parental and BRCA1-restored cells. K14 cells were treated with 5 μM of Olaparib for 72 hours. h-i, Nude mice were inoculated with MDA-MB-436 parental or BRCA1-restored tumor cells,(h) n=5 mice per group and (i, left) n=3 tumors per group and (i, right) n=4 tumors per group. h, Tumor volume. i, qRT-PCR analysis of brca1 and csf1. Error bars represent standard error of mean (±SEM). Statistical analyses were performed using two-way ANOVA. j, Olaparib-resistant tumors were implanted into immunocompetent animals as described and mice were treated with vehicle, anti-CSF-1R, Olaparib, or anti-CSF-1R plus Olaparib for the indicated time. Statistical analysis was performed using Gehan-Breslow-Wilcoxon test. Mice in the anti-CSF-1R plus Olaparib treatment group exhibited decreased tumor volume at day 31. Statistical analyses were performed using unpaired two-tailed t-test. Error bars represent standard error of mean (±SEM) with n=4–6 mice per group, as shown. k, Mice bearing 4T1 tumors were treated as indicated and tumor volume was collected out to day 21. Statistics were performed using a 2-way ANOVA with Turkey test with n=7 mice in the Veh and anti-CSF-1R groups and n=8 in the Olaparib and Olaparib plus anti-CSF-1R groups. l-t, Mice bearing EMT6 tumors were treated as indicated. l, Overall survival (left) and tumor burden (right) was plotted, number of mice per group are shown. m-t, Mice bearing EMT6 tumors were treated for 5 days and tumors were harvested for flow cytometry. Statistical analysis was performed using one-way ANOVA with Uncorrected Fisher’s LSD. Error bars represent standard error of the mean (±SEM) with (n=4–5) mice per group. Exact p values indicated in each panel for each comparison.
Figure 7.
Figure 7.. Olaparib-treated macrophages suppress T-cell function, which is overcome with anti-CSF-1R therapy in BRCA1-deficient TNBC.
a-c, OT-1 T cells cultured in supernatants collected from media with vehicle (red) or Olaparib (blue), and media collected from human macrophages treated with vehicle (black, donors 1–3), or human macrophages treated with Olaparib (light blue, donors 1–3) were assessed for a, IFN-g expression using FACS analysis and b, glycolytic or c, mitochondrial ATP production using Seahorse Bioanalysis. Error bars represent standard error of mean (±SEM). Statistical analyses were performed using paired t-test or one-way ANOVA as indicated on graphs. d-j, Mice bearing BRCA-deficient TNBC tumors were treated with either vehicle, anti-CSF-1R, Olaparib, or anti-CSF-1R plus Olaparib for the indicated time. Mice were treated daily with Olaparib (50 mg kg−1, IP) and twice with anti-CSF-1R (1.2 mg/mouse). d-f, Mice were treated for 5 days and tumors were collected for flow cytometry to analyze T-cell populations. Error bars represent standard error of mean (±SEM). Statistical analyses were performed comparing each group using one-tailed t-test. g, Overall survival is shown for all treatment groups indicated. The median survival is shown in brackets with (n=6–14 mice/group). Survival analysis was done using percent survival with Gehan-Breslow-Wilcoxon test in Graph Pad prism and p-values. h-j, Seven-day treated mice were injected IP with a fluorescent labeled glucose analogue, 2-NBDG 30 minutes before tumors were harvested and glucose uptake was measured by flow cytometry. k-l, Mice were treated with fatostatin to inhibit lipid metabolism. k, Tumor volumes at day 14 (k) and 105 (l) are shown. Statistical analysis was performed using One-way ANOVA with Uncorrected Fisher’s LSD for subfigures h, j and unpaired one-tailed t-test for subfigures i, k-l. Error bars represent standard error of the mean (±SEM) with n=3–6 mice per group. Exact p values indicated in each panel for each comparison.
Figure 8.
Figure 8.. Anti-CSF-1R therapy overcomes PARP inhibitor-induced immune-suppressive macrophages and activates an anti-tumor immune response in BRCA-associated TNBC.
Schematic overview of PARP inhibitor-induced changes of tumor macrophages in BRCA-associated and proficient TNBC. In BRCA-associated TNBC: (1) Olaparib treatment induces cancer cell death (2), which leads to increased expression of CSF-1(3), leading to recruitment of monocyte to the tumor (4). (5) Olaparib enhances the differentiation of monocytes to macrophages and decreases glycolytic capacity and increase in PD-L1 expression in macrophages that is PARP1-independent. Olaparib increases the expression level of CSF-1R and pTBK1 in macrophages that is PARP1-dependent. Olaparib also induces expression of pro-inflammatory cytokines (IL-1β and TNF-α), DNA SSB repair response, and expression of co-stimulatory/activation molecules (CD86, CD80 and CD40) on macrophages. Fatostatin reverses the immune-suppressive phenotypic changes on macrophages caused by Olaparib. (6) Addition of anti-CSF-1R to Olaparib leads to an increase in M1-like macrophages and CTLs, which leads to tumor reduction. In the setting of BRCA-proficient TNBC, Olaparib does not induce cancer cell death and therefore there is attenuated tumor cell CSF-1 expression and no recruitment of monocytes to the tumor.

References

    1. Robson ME, Tung N, Conte P, Im SA, Senkus E, Xu B, Masuda N, Delaloge S, Li W, Armstrong A, Wu W, Goessl C, Runswick S & Domchek SM OlympiAD final overall survival and tolerability results: Olaparib versus chemotherapy treatment of physician’s choice in patients with a germline BRCA mutation and HER2-negative metastatic breast cancer. Ann Oncol 30, 558–566, doi:10.1093/annonc/mdz012 (2019). - DOI - PMC - PubMed
    1. O’Donovan PJ & Livingston DM BRCA1 and BRCA2: breast/ovarian cancer susceptibility gene products and participants in DNA double-strand break repair. Carcinogenesis 31, 961–967, doi:10.1093/carcin/bgq069 (2010). - DOI - PubMed
    1. Tung N, Lin NU, Kidd J, Allen BA, Singh N, Wenstrup RJ, Hartman AR, Winer EP & Garber JE Frequency of Germline Mutations in 25 Cancer Susceptibility Genes in a Sequential Series of Patients With Breast Cancer. J Clin Oncol 34, 1460–1468, doi:10.1200/jco.2015.65.0747 (2016). - DOI - PMC - PubMed
    1. Litton JK, Rugo HS, Ettl J, Hurvitz SA, Goncalves A, Lee KH, Fehrenbacher L, Yerushalmi R, Mina LA, Martin M, Roche H, Im YH, Quek RGW, Markova D, Tudor IC, Hannah AL, Eiermann W & Blum JL Talazoparib in Patients with Advanced Breast Cancer and a Germline BRCA Mutation. N Engl J Med 379, 753–763, doi:10.1056/NEJMoa1802905 (2018). - DOI - PMC - PubMed
    1. Robson M, Im SA, Senkus E, Xu B, Domchek SM, Masuda N, Delaloge S, Li W, Tung N, Armstrong A, Wu W, Goessl C, Runswick S & Conte P Olaparib for Metastatic Breast Cancer in Patients with a Germline BRCA Mutation. N Engl J Med 377, 523–533, doi:10.1056/NEJMoa1706450 (2017). - DOI - PubMed

Publication types

MeSH terms

Substances