Review
. 2021 Mar 18;12(1):37.
doi: 10.1186/s13244-021-00979-7.

Incidental findings in and around the prostate on prostate MRI: a pictorial review

Affiliations
Review

Incidental findings in and around the prostate on prostate MRI: a pictorial review

Janki Trivedi et al. Insights Imaging. .

Abstract

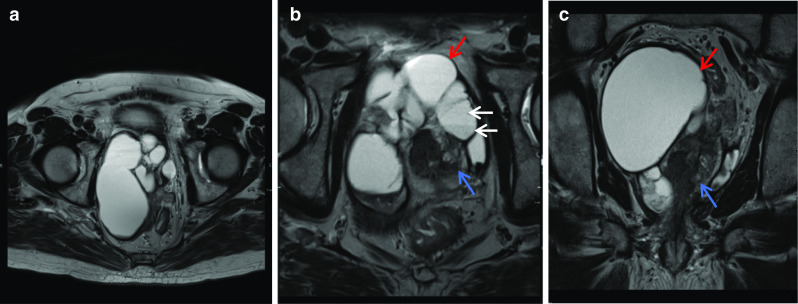
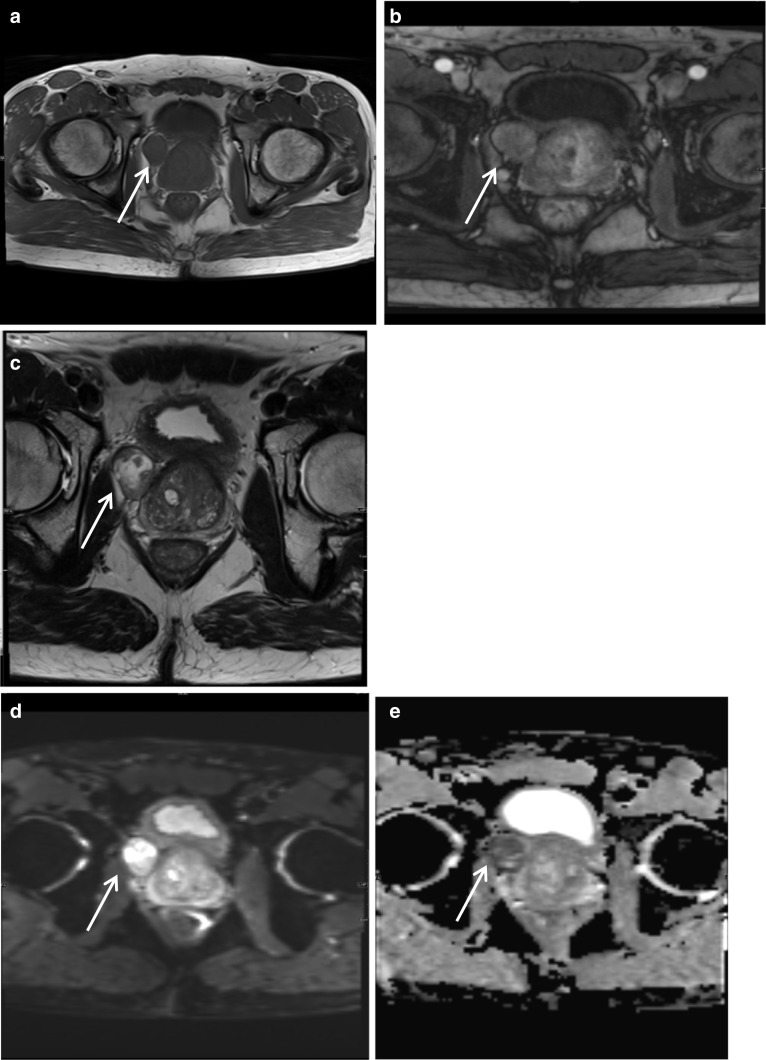
Prostate MRI has seen rapid growth in use in recent years as an advanced diagnostic modality to detect focal areas of clinically significant prostate cancer, to identify an area for targeted biopsy and to guide management and surveillance. The increase in use has also led to increased diagnosis of incidental lesions arising from structures around the prostate. These incidental findings may be related to the genitourinary system or non- genitourinary system and may have a benign aetiology which needs no additional follow-up, or it may require surveillance and management. The field of view in a multiparametric prostate MRI includes other pelvic organs, neurovascular bundles, bowel, lymph nodes and bones. Being familiar with standard MRI characteristics and a sound knowledge of anatomy of the prostate and surrounding structures can help in distinguishing normal anatomy from pathology. Given that patients undertaking a prostate MRI are usually a cohort with increased anxiety from their known or suspicion of prostate cancer, it is important that radiologists are familiar with these common incidental findings to minimise anxiety to the patient, have a well-informed discussion with the referring clinician and reduce costs associated with unnecessary further testing and follow-up of benign incidental findings. Additionally, being able to diagnose more serious incidental pathologies early can be life-saving and potentially significantly alter patient management.

Keywords: Findings; Incidental; MpMRI; Periprostatic.


Conflict of interest statement

The authors declare that they have no competing interests.

Figures

Fig. 1
Fig. 1
Haematospermia (a) Axial T1W image shows intrinsic T1 hyperintensity within the right seminal vesicle (red arrow). b Axial T2W image shows corresponding T2 hypointensity in this region in keeping with blood products (blue arrow). c Coronal T2W and (d) axial T2W images in a different patient show rounded low T2 signal intensity lesions, in the right seminal vesicle in (c) and bilaterally in (d) but larger in the right seminal vesicle, in keeping with stones (white arrows)
Fig. 2
Fig. 2
Prostate calcification Axial T2W image shows well-defined low T2 signal lesions in the right posterolateral prostate in keeping with prostate calcification (white arrow)
Fig. 3
Fig. 3
Prostatic utricle cyst (a) Axial T2W image shows a high T2 signal pear-shaped cystic lesion (red arrow) in the midline posterior to the prostate (white arrow), and on the sagittal image (b), it can be seen that it does not extend above the base of the prostate in keeping with a utricle cyst
Fig. 4
Fig. 4
Mullerian duct cysts Axial a T1W and (b) T2W images and Sagittal (c) STIR images show a cystic structure with a fluid–fluid level from high signal intensity simple fluid and low signal intensity fluid from haemorrhage. It extends beyond the base of prostate. d Axial and (e) sagittal T2W images show another case with a midline cystic structure (white arrows) with homogeneous high T2 signal which is bulbous at the superior aspect with an inverted droplet morphology inferiorly. The base of the lesion does extend above the level of the base of the prostate gland which is shown by the red arrow. These are in keeping with Mullerian duct cysts
Fig. 5
Fig. 5
Cowper’s gland duct cyst a Axial, (b) coronal and (c) sagittal T2 weighted images show a midline ovoid high T2 signal lesion at the penile base (white arrow) in keeping with a Cowper’s gland duct cyst. The prostate is seen superior to the lesion (red arrow)
Fig. 6
Fig. 6
Periprostatic haematoma post-biopsy a Axial T1W and (b) T2W images demonstrate a right posterolateral periprostatic haematoma (white arrow) post-biopsy which is high signal on both sequences with a fluid–fluid level
Fig. 7
Fig. 7
Prostate abscess a, b Axial T2W images show left lateral bladder wall thickening (red arrow) and heterogeneous but predominantly low T2 signal in the left prostate (white arrow), respectively. c Post-contrast, the lesion demonstrates strong peripheral contrast enhancement and on DWI/ ADC in d, e, respectively, the central element of the left prostate lesion shows restricted diffusion with a very low ADC value
Fig. 8
Fig. 8
Periprostatic dermoid cyst a Coronal T1W image shows a large well-circumscribed mass in the pelvis (white arrows) which is mildly T1 hyperintense to muscle, shows mild fat saturation on (b) axial T1 fat saturation sequence. c Axial T2W image shows the lesion is high T2 signal compared to muscle. It causes significant mass effect on the bladder (red arrow) displacing it anteriorly and exerts mass effect on the prostate and seminal vesicles. d Post-contrast T1 shows no significant enhancement. The lesion shows strong diffusion restriction with (e) high DWI and (f) low ADC. No evidence of calcification, fluid–fluid level or suspicious enhancing nodular soft tissue thickening was identified
Fig. 9
Fig. 9
Cystic prostate adenocarcinoma ac Axial T2W images demonstrate multiple large high T2 signal lesions in keeping with cysts (red arrow) surrounding the prostate (blue arrows) with small fluid-fluid levels (white arrows) likely due to internal haemorrhage
Fig. 10
Fig. 10
Periprostatic leiomyoma a Axial and (b) Coronal T2W images demonstrate a right periprostatic mass (white arrow) which indents the right apex from below displacing it superiorly and to the left with mild distortion of the prostatic urethra. Relative to muscle, it is slightly T2 hyperintense with some intrinsic high T2 signal foci. c Axial T1W image shows the lesion is isointense to prostate and in (d) the lesion shows mild heterogeneous contrast enhancement. On DWI/ ADC, e, f respectively, the lesion showed some diffusion restriction
Fig. 11
Fig. 11
Periprostatic leiomyosarcoma a, b Axial T1W pre- and post-contrast images, respectively, show a rounded lesion arising from the right anterolateral prostate (white arrow) which is T1 isointense to prostate and shows uniform contrast enhancement. c Is a T2W image showing the lesion is predominantly T2 hyperintense lesion with no convincing invasion of the prostatic capsule. On (d) DWI and (e) ADC, respectively, the lesion shows restricted diffusion
Fig. 12
Fig. 12
Solitary fibrous tumour A well-circumscribed homogeneous lesion (red arrow) arising from the left posterolateral prostate wall is seen in (a) sagittal and (b) axial T2W images as isointense to prostate (white arrow) and hyperintense to gluteus muscle (blue arrow). c DWI and (d) ADC images demonstrate diffusion restriction in the lesion. In e and f the lesion is iso- to mildly T1 hyperintense to prostate and shows uniform contrast enhancement. This was biopsy-proven solitary fibrous tumour
Fig. 13
Fig. 13
Lipoma a Axial and b coronal T2W images demonstrate a lipomatous mass within the right adductor compartment (white arrows) which is high T2 signal with a heterogeneous solid component at the anterior aspect (red arrow) which on biopsy represented a region of fat necrosis. c Axial T1 and (d) axial T1 fat sat post-contrast sequences show an ovoid lesion in the left gluteus maximus which is high T1 signal and suppresses on the fat sat sequence in keeping with a lipoma
Fig. 14
Fig. 14
Liposarcoma a Coronal and (b) axial T1-weighted images show a heterogeneous mass (white arrow) which is T1 iso- to hyperintense to prostate (red arrow) arising from the right of the prostate gland which does not fully supress on (c) T1 fat saturation with heterogeneous contrast enhancement in the non-fat elements. d, e DWI and ADC sequences, respectively, show diffusion restriction in the lesion. Surgical resection confirmed liposarcoma
Fig. 15
Fig. 15
Parachordoma a Axial T1-weighted, (b) axial T2-weighted and (c) sagittal T2-weighted images show a lobulated mass within the left gluteus maximus (white arrow). The prostate is labelled by the red arrow. The lesion is iso- to mildly hyperintense to muscle on T1 and hyperintense to muscle on T2 and shows internal fluid–fluid levels in keeping with haemorrhage and cystic change. The lesion did not show diffusion restriction. Surgical resection confirmed myoepithelial carcinoma or parachordoma
Fig. 16
Fig. 16
Sagittal T2W image shows large high T2 signal lesion in the right scrotum in keeping with a hydrocele (red arrow), thickened bladder wall which is low T2 signal is in keeping with a trabeculated bladder wall with debris (black arrow). Low T2 signal lesions seen in the prostate (white arrow) represent prostate calcifications as discussed previously in Fig. 2
Fig. 17
Fig. 17
UPS of the spermatic cord a Coronal T1 fat sat post-contrast and b axial T2 fat sat images show a large heterogeneously enhancing high T1 and T2 signal mass within the left inguinal canal and scrotum (red arrow). c Axial DWI and d ADC images demonstrate a predominantly solid mass with restricted diffusion in keeping with necrosis or cystic change within
Fig. 18
Fig. 18
Spermatic cord lymphoma a Axial T1W image shows a mass within the right inguinal canal (white arrow) which is inseparable from the spermatic cord and is mildly hyperintense to gluteus muscle and shows heterogeneous post-contrast enhancement on (b) T1 fat saturation and (c) T2 fat saturation sequences. In d and e axial DWI/ ADC, the right inguinal mass shows restricted diffusion. This was surgically excised and proven to be spermatic cord lymphoma
Fig. 19
Fig. 19
Urothelial carcinoma a Axial T1W image shows a slightly T1 hypointense lesion (white arrow) compared to the gluteus maximus muscle in the left vesicoureteric junction. b Axial T2W image in the same patient shows the left VUJ filling defect which is T2 hyperintense to bladder wall and gluteal muscle. c Is an axial T2W image of a different patient showing an intermediate signal intensity polypoid lesion on the left posterior bladder wall (white arrow). d Is an axial T2W image of yet another patient with a history of urothelial carcinoma showing multiple ill-defined, T2 hyperintense to gluteus muscle, nodules in the perineum and extending to the ventral aspect of the penis in keeping with metastases (white arrow)
Fig. 20
Fig. 20
Axial T2W images demonstrate a moderately high T2 signal mass in the right inguinal region (white arrow) which was contiguous with small bowel on serial images and in keeping with a right-sided small bowel containing inguinal hernia. The prostate is labeled by the black arrow
Fig. 21
Fig. 21
Ascites a Sagittal and b coronal T2-weighted images demonstrate high T2 signal free fluid (white arrows) of similar intensity to the urinary bladder in keeping with ascites. The fluid is seen posterior and superior to the prostate (blue arrow) at the base of the bladder. a Also shows a 4 mm nodule (red arrow) in the anterior inferior aspect of the free fluid
Fig. 22
Fig. 22
GIST Well-circumscribed submucosal 5 cm heterogeneous mass (white arrow) arising from the right posterolateral wall of the lower rectum is (a) predominantly T2 hyperintense relative to rectal wall with (b) and (c) sagittal and axial T1 fat saturation post-contrast sequences showing vivid contrast enhancement. The mass is seen posterior to the prostate in B (red arrow). Biopsy confirmed spindle-type histologically low-grade GIST
Fig. 23
Fig. 23
Rectal villous adenoma a Axial and (b) sagittal T2W images show a large lobulated polypoid mass within the lower rectum at 2 cm from anal verge (white arrow). The mass shows thick T2 hyperintense layer along the surface with heterogeneous intermediate to high-signal intensity within the lesion. c Colonoscopy and polypectomy confirmed villous/ tubulovillous adenoma (black arrow) with low-grade dysplasia
Fig. 24
Fig. 24
Rectal adenocarcinoma Axial, sagittal and coronal T2-weighted images showing a semi-annular mass (red arrow), posterior to the prostate and within the rectum which is T2 hyperintense to gluteal muscle and extending from 3 to 1 o’clock causing significant luminal narrowing. Colonoscopy and biopsy proved rectal adenocarcinoma
Fig. 25
Fig. 25
Periprostatic venous varix a Axial T2W image shows a flow void (white arrow) to the right of the prostate gland (red arrow) and (b) dynamic post-contrast axial T1W image shows dynamic enhancement confirming a right-sided periprostatic venous varix
Fig. 26
Fig. 26
Lymphadenopathy in a patient with multiple myeloma a Axial DWI and (b) ADC images showing diffusion restriction in a rounded lesion to the left of the urinary bladder anteriorly (white arrows) in keeping with nodal metastasis in left external iliac lymph nodes. Diffusion restriction also in the acetabulum bilaterally (red arrows) in keeping with marrow infiltration. c Axial T2W images demonstrate the left external iliac lymph node is iso- to hyperintense relative to surrounding fat which is seen in nodal metastasis

References

    1. Sarkar S, Das S. A review of imaging methods for prostate cancer detection. Biomed Eng Comput Biol. 2016;7(Suppl 1):1–15. doi: 10.4137/BECB.S34255. - DOI - PMC - PubMed
    1. Razek AA, Elhanbly S, Eldeak A. Transrectal ultrasound in patients with hematospermia. J Ultrasound. 2010;13(1):28–33. doi: 10.1016/j.jus.2009.09.005. - DOI - PMC - PubMed
    1. Neto JA, Parente DB. Mulitparametric magnetic resonance imaging of the prostate. Magn Reson Imaging Clin N Am. 2013;21:409–426. doi: 10.1016/j.mric.2013.01.004. - DOI - PubMed
    1. American College of Radiology. Prostate Imaging—Reporting and Data System. 2019. Version 2.1. PI-RADS
    1. Shin T, Smyth TB, Ukimura O, et al. Diagnostic accuracy of a five-point Likert scoring system for magnetic resonance imaging (MRI) evaluated according to results of MRI/ultrasonography image-fusion targeted biopsy of the prostate. BJU Int. 2018;121:77–83. doi: 10.1111/bju.13972. - DOI - PMC - PubMed

LinkOut - more resources