. 2021 Dec;54(12):8256-8282.
doi: 10.1111/ejn.15190. Epub 2021 May 4.

Mobile brain/body imaging of landmark-based navigation with high-density EEG

Affiliations

Mobile brain/body imaging of landmark-based navigation with high-density EEG

Alexandre Delaux et al. Eur J Neurosci. 2021 Dec.

Abstract

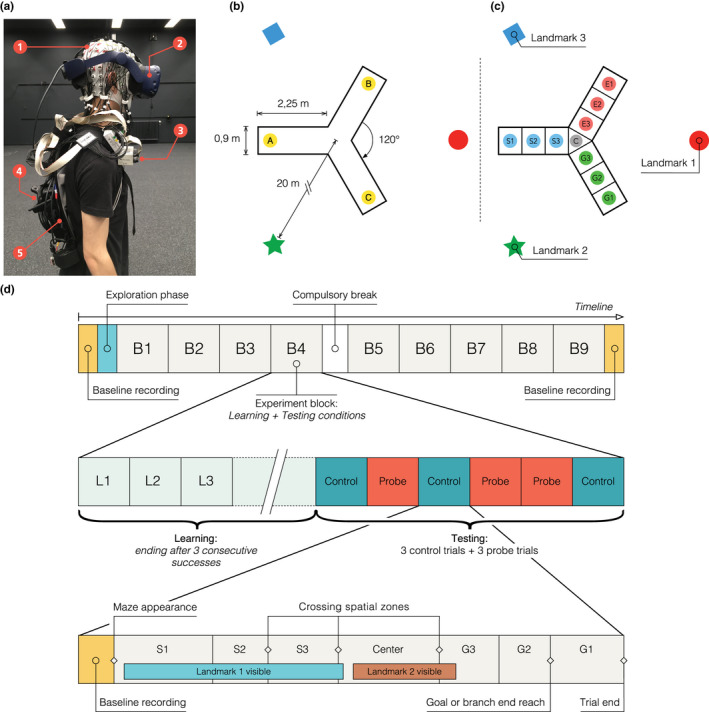
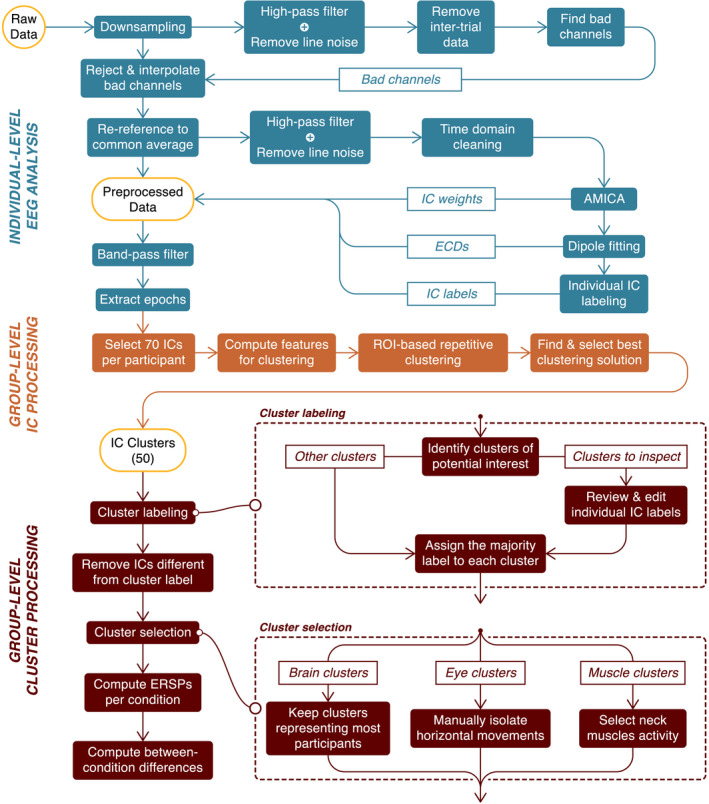
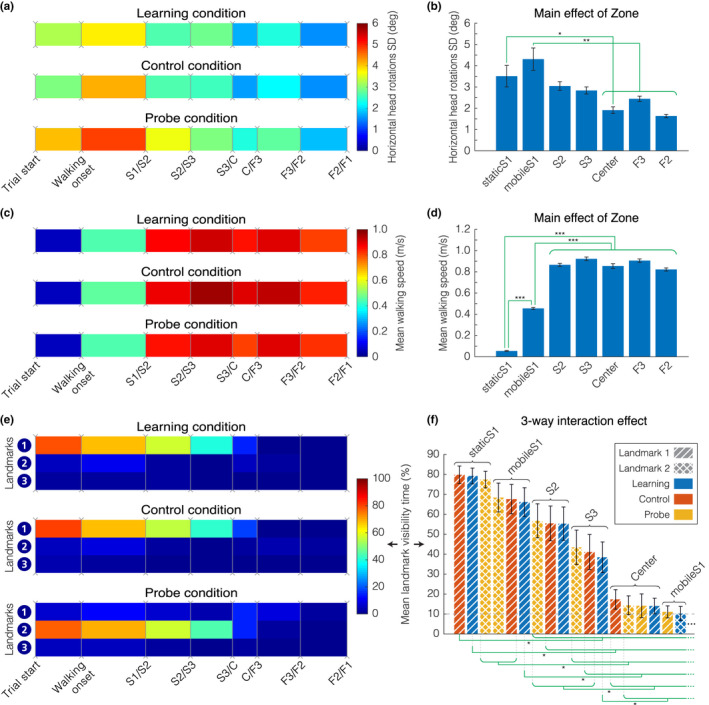
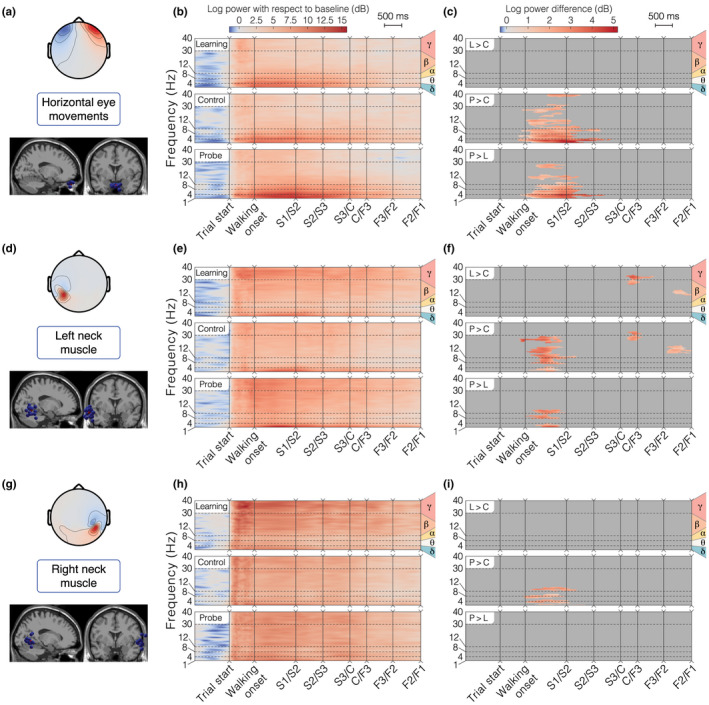
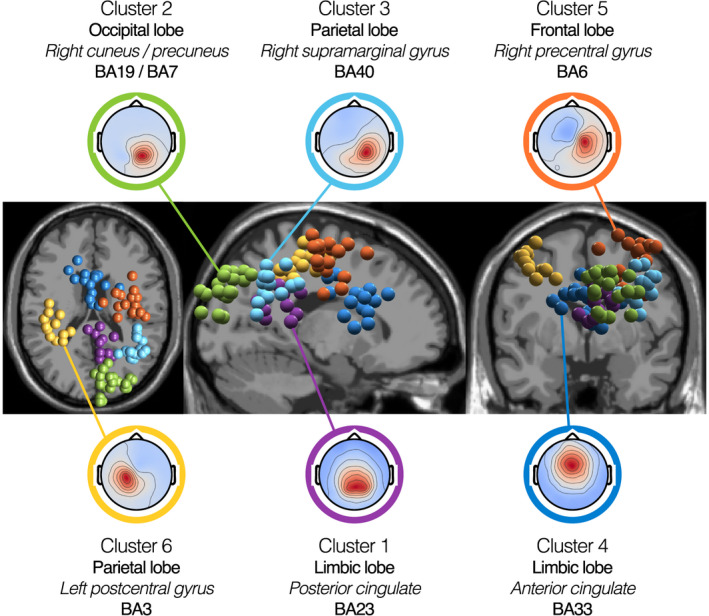
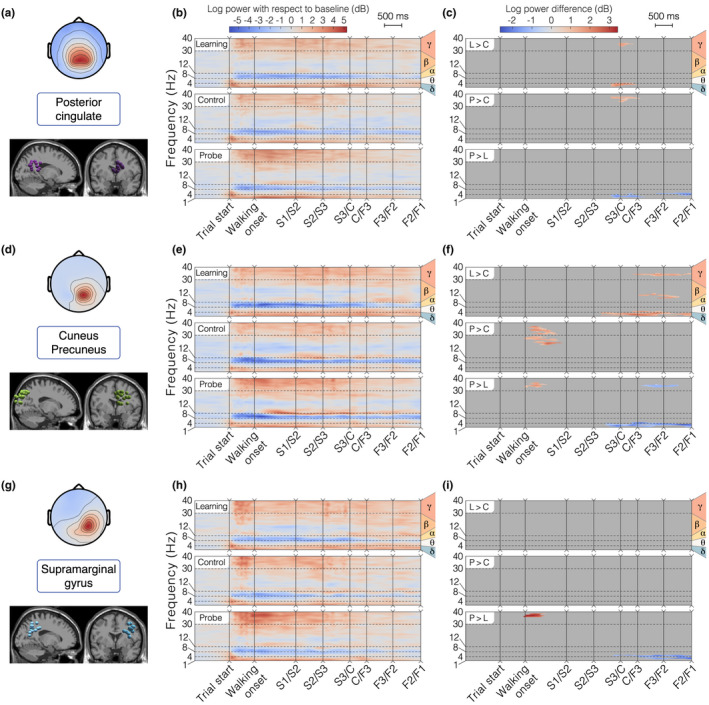
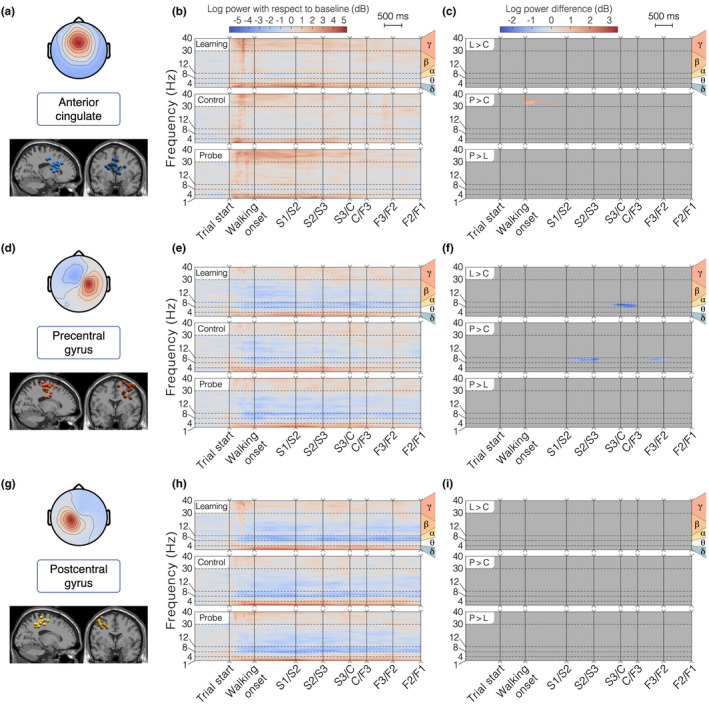
Coupling behavioral measures and brain imaging in naturalistic, ecological conditions is key to comprehend the neural bases of spatial navigation. This highly integrative function encompasses sensorimotor, cognitive, and executive processes that jointly mediate active exploration and spatial learning. However, most neuroimaging approaches in humans are based on static, motion-constrained paradigms and they do not account for all these processes, in particular multisensory integration. Following the Mobile Brain/Body Imaging approach, we aimed to explore the cortical correlates of landmark-based navigation in actively behaving young adults, solving a Y-maze task in immersive virtual reality. EEG analysis identified a set of brain areas matching state-of-the-art brain imaging literature of landmark-based navigation. Spatial behavior in mobile conditions additionally involved sensorimotor areas related to motor execution and proprioception usually overlooked in static fMRI paradigms. Expectedly, we located a cortical source in or near the posterior cingulate, in line with the engagement of the retrosplenial complex in spatial reorientation. Consistent with its role in visuo-spatial processing and coding, we observed an alpha-power desynchronization while participants gathered visual information. We also hypothesized behavior-dependent modulations of the cortical signal during navigation. Despite finding few differences between the encoding and retrieval phases of the task, we identified transient time-frequency patterns attributed, for instance, to attentional demand, as reflected in the alpha/gamma range, or memory workload in the delta/theta range. We confirmed that combining mobile high-density EEG and biometric measures can help unravel the brain structures and the neural modulations subtending ecological landmark-based navigation.

Keywords: ecological navigation; mobile EEG; retrosplenial complex; source reconstruction; virtual reality.


Conflict of interest statement

The authors declare no conflict of interest.

Figures

FIGURE 1
FIGURE 1
Virtual environment, setup, and timeline of the experiment. (a) Details of participant's equipment. (1) EEG cap (128 channels); (2) VR Head‐mounted display (VIVE Pro); (3) Wifi transmitter for EEG data (Move system); (4) Additional motion capture tracker (VIVE tracker); and (5) Backpack computer running the virtual environment (Zotac PC). (b) Virtual environment. Participants explored a virtual equilateral Y‐maze. In the learning condition, they always started in the same arm (e.g., A) and they had to find a hidden goal, always placed in the same location (e.g., C). In the testing conditions, the environment and goal location stayed the same but the participant would start from either the same position (A) in control trials or the third arm (B) in probe trials. (c) Spatial discretization of the environment (example for a learning trial). We delimited 10 areas in the maze: “S” stands for starting arm, “C” for center, “E” for error arm, and “G” for goal arm. In the text, when referring to the arm chosen by the participant (either “E” or “G”), we use the letter “F” standing for finish arm. These labels are condition‐dependent (different in the probe condition). The names of the landmark depend on the location of starting arm in the learning condition and goal arm. These names are block dependent. (d) General timeline of the experiment. The first row represents the general succession of conditions in the experiment. The second row shows an example of the sequence of trials in an experimental block. The third row illustrates the structure of a trial, including a possible course of events: progress across spatial sections and visibility of landmarks depending on participant's head movements. We provide a video of a participant performing the task, along with the reconstruction of the tracker positions, in Video S1
FIGURE 2
FIGURE 2
Flowchart of the EEG processing pipeline. We first preprocessed EEG data at the individual level (in blue) and, in particular, decomposed the channel data into independent components (ICs) with an adaptative mixture ICA (AMICA) algorithm. We then selected 70 ICs per participant for the clustering procedure (in orange). Finally, we labeled and selected the clusters of interest for an ERSP analysis per condition (in brown). The “Cluster selection” process is described in the “EEG cluster analysis” section of the Results
FIGURE 3
FIGURE 3
Behavioral metrics – Walking speed, horizontal head rotations variability, and landmark visibility for the allocentric group. (a) Average standard deviation of horizontal head rotations, computed from the difference between head and torso orientation. (b) Main effect of Zone on horizontal head rotations variability F(6;273) = 8.99, p < 0.00001. (c) Average instantaneous walking speed. (d) Main effect of Zone on walking speed F(6;273) = 472.15, p < 0.00001. (e) Average landmark visibility. The color code corresponds to the percentage of time each landmark was visible at the screen. (f) Three‐way interaction effect of Zone, Condition, and Landmark on landmark visibility. Each bar shows average landmark visibility (sorted in descending order) for a specific combination of zone (labeled), condition (color), and landmark (texture). We present only combinations associated with at least 10% landmark visibility (17 combinations out of 63). (a, c, e) We divided each trial according to the same sequence of events: walking onset, followed by the first passage in the starting arm (S) then in the finish arm (F), being either the goal or the error arm. Events are horizontally spaced according to the median duration between each event. All three plots represent data in the learning, control, and probe conditions, averaged between separating events across all trials and blocks for all 14 allocentric participants. (b, d, f) Mean value with standard error of the mean (black bars). We present the summary of the significant differences (green braces) found in post‐hoc analysis (computed on a pairwise basis, then grouped when similar). For figure (f), we found no pairwise significant differences within the group of combinations not shown (below 10%). ***p < 0.0001, **p < 0.001, *p < 0.01
FIGURE 4
FIGURE 4
Horizontal eye movements and neck muscle clusters for the allocentric group. (a, d, g) Topographical map of the average cluster components' projection at the scalp level and sagittal view of all ICs in the cluster (blue spheres) with the position of the centroid (red sphere). (b, e, h) ERSP average per condition. We first averaged the data at the participant level, then at the group level. (c, f, i) ERSP pairwise differences between conditions. Plotted values represent the average of participant‐wise ERSP difference between the two conditions compared. We masked differences not satisfying the statistical threshold in the permutation test (i.e., p > 0.05). For all the ERSP plots, the Y axis displays the delta, theta, alpha, beta, and gamma frequency bands and the X axis represents the time‐warped sequence of main events in the trial. We horizontally spaced the events according to the median duration between them. “L > C”: difference between Learning and Control, “P > C”: difference between Probe and Control, and “P > L”: difference between Probe and Learning. (a‐c) Horizontal eye movements cluster. (d‐f) Left neck muscle cluster. (g‐i) Right neck muscle cluster
FIGURE 5
FIGURE 5
Brain cluster 3D localization and mean channel activation maps. Spatial location of brain clusters retained for analysis (from left to right: transverse view, sagittal view, and coronal view). Each IC is represented by a sphere located at its corresponding dipole location. For each cluster, we plotted all ICs, irrespective of their associated participant's behavioral group. We used MRI scans from the standard MNI brain for representation. Topographies show the mean channel activation map associated with each cluster. The centroids of the clusters are located in or near the posterior cingulate (Cluster 1 – 12 ICs, 12 participants), the right cuneus (Cluster 2 – 22 ICs, 12 participants), the right supramarginal gyrus (Cluster 3 – 15 ICs, 11 participants), the anterior cingulate (Cluster 4 – 15 ICs, 12 participants), the right precentral gyrus (Cluster 5 – 17 ICs, 13 participants), and the left postcentral gyrus (Cluster 6 – 13 ICs, 11 participants). Detailed information on the location of the cluster centroids is provided in Table S4
FIGURE 6
FIGURE 6
Detailed analysis of brain clusters 1 – 3 for the allocentric group. (a, d, g) Topographical map of the average cluster components' projection at the scalp level (top) and sagittal/frontal views of all ICs in the cluster (bottom). (b, e, h) ERSP average per condition. (c, f, i) ERSP pairwise differences between conditions. “L > C”: difference between Learning and Control, “P > C”: difference between Probe and Control, “P > L”: difference between Probe and Learning. (a‐c) Cluster 1 – Posterior Cingulate. In the allocentric group, this cluster contains 10 ICs from 10 different participants. (d‐f) Cluster 2 – Right Cuneus/Precuneus. In the allocentric group, this cluster contains 21 ICs from 11 different participants. (g‐i) Cluster 3 – Right Supramarginal Gyrus. In the allocentric group, this cluster contains 13 ICs from 9 different participants
FIGURE 7
FIGURE 7
Detailed analysis of brain clusters 4–6 for the allocentric group. The layout is the same as in Figure 6a,d,g Topographical map of the average cluster components' projection at the scalp level (top) and sagittal/frontal views of all ICs in the cluster (bottom). (b, e, h) ERSP average per condition. (c, f, i) ERSP pairwise differences between conditions. “L > C”: difference between Learning and Control, “P > C”: difference between Probe and Control, “P > L”: difference between Probe and Learning. (a‐c) Cluster 4 – Anterior Cingulate. In the allocentric group, this cluster contains 14 ICs from 11 different participants. (d‐f) Cluster 5 – Right Precentral Gyrus. In the allocentric group, this cluster contains 15 ICs from 11 different participants. (g‐i) Cluster 6 – Left Postcentral Gyrus. In the allocentric group, this cluster contains 12 ICs from 10 different participants

References

    1. Akalin Acar, Z. , & Makeig, S. (2013). Effects of forward model errors on EEG source localization. Brain Topography, 26, 378–396. 10.1016/j.tics.2008.07.004 - DOI - PMC - PubMed
    1. Arleo, A. , & Rondi‐Reig, L. (2007). Multimodal sensory integration and concurrent navigation strategies for spatial cognition in real and artificial organisms. Journal of Integrative Neuroscience, 06, 327–366. 10.1142/s0219635207001593 - DOI - PubMed
    1. Artoni, F. , Fanciullacci, C. , Bertolucci, F. , Panarese, A. , Makeig, S. , Micera, S. , & Chisari, C. (2017). Unidirectional brain to muscle connectivity reveals motor cortex control of leg muscles during stereotyped walking. NeuroImage, 159, 403–416. 10.1016/j.neuroimage.2017.07.013 - DOI - PMC - PubMed
    1. Auger, S. D. , & Maguire, E. A. (2018). Dissociating landmark stability from orienting value using functional magnetic resonance imaging. Journal of Cognitive Neuroscience, 30, 698–713. - PMC - PubMed
    1. Auger, S. D. , Mullally, S. L. , & Maguire, E. A. (2012). Retrosplenial cortex codes for permanent landmarks. PLoS One, 7, e43620. 10.1371/journal.pone.0043620 - DOI - PMC - PubMed

Publication types