Multicenter Study
. 2021 Dec;99(8):e1474-e1482.
doi: 10.1111/aos.14847. Epub 2021 Mar 18.

Posterior uveal melanoma incidence and survival by AJCC tumour size in a 70-year nationwide cohort

Affiliations
Multicenter Study

Posterior uveal melanoma incidence and survival by AJCC tumour size in a 70-year nationwide cohort

Isabel Smidt-Nielsen et al. Acta Ophthalmol. 2021 Dec.

Abstract

Purpose: While early treatment of posterior uveal melanoma can save the eye, the effect of early treatment on survival remains unknown. Therefore, we aimed to determine whether the tumour size at diagnosis has changed over time, and if this has affected survival rates of patients with posterior uveal melanoma in Denmark.

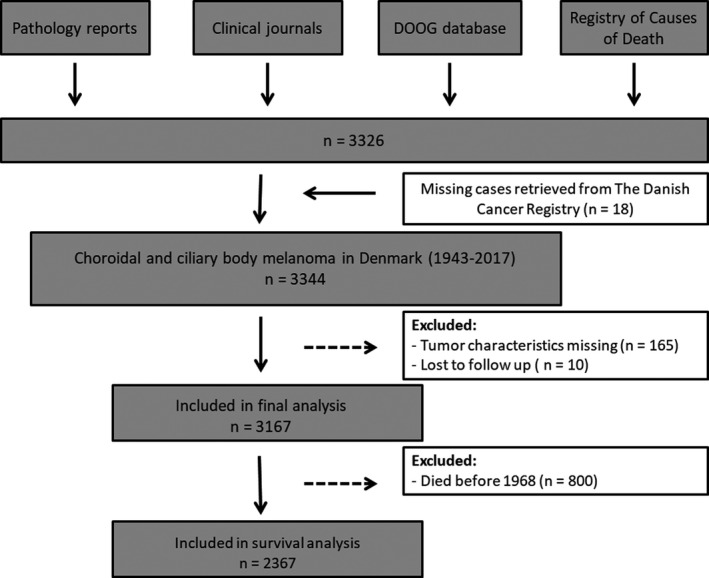
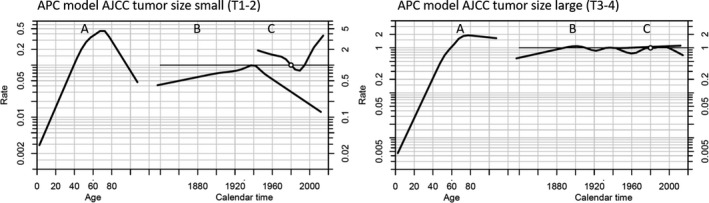
Methods: Nationwide retrospective cohort study linking data from registry-based resources to data from clinical charts and pathology records. Including all Danish patients diagnosed with posterior uveal melanoma from 1943 to 2017. Incidence rates were estimated as annual percentage change (APC) overall and by American Joint Committee on Cancer (AJCC) tumour sizes. The age-period-cohort model was applied to estimate the relative risk of calendar period. The cox proportional hazards model, relative survival Kaplan-Meier curves and cumulative incidence curves were applied to estimate the effect of calendar period on survival.

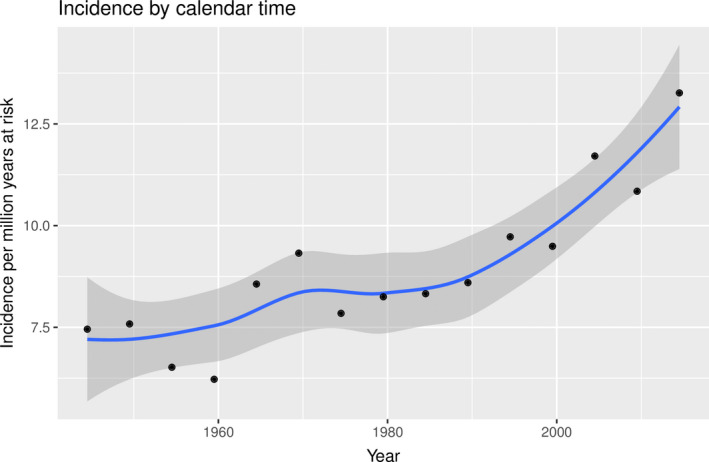
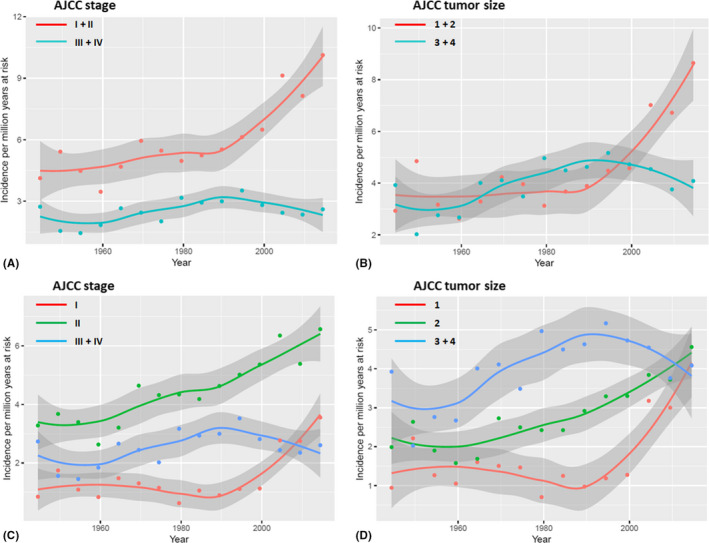
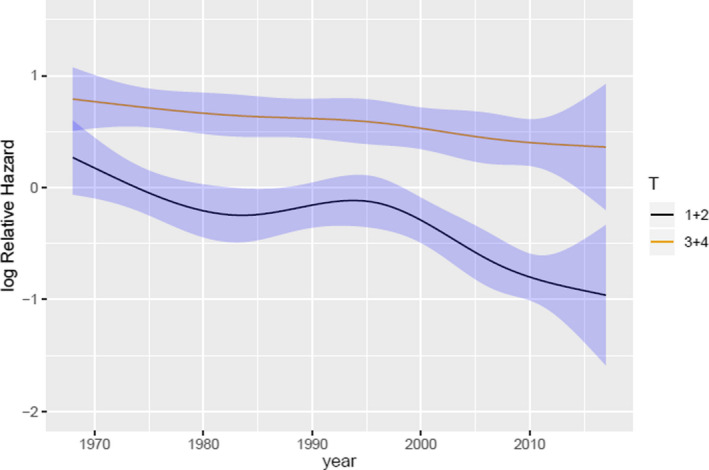
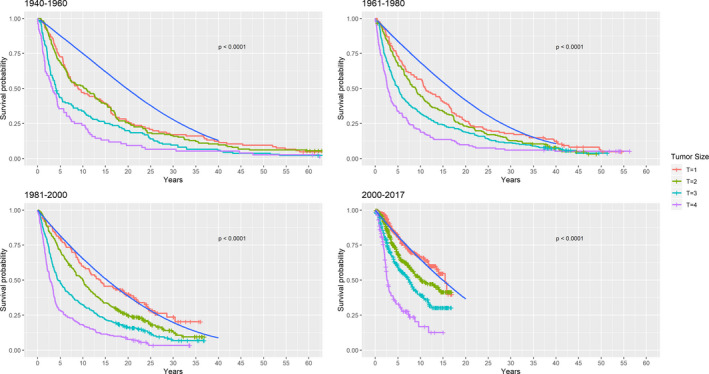
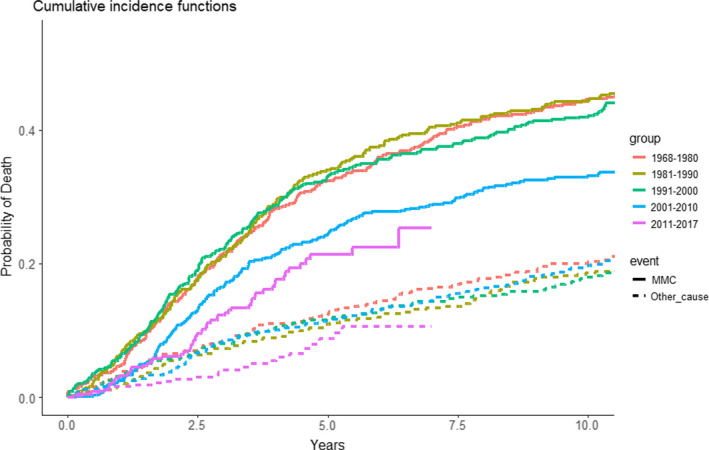
Results: An overall increase in incidence rate of uveal melanoma was found (APC = 0.25%, 0.08-0.42; 95% CI). This was due to increasing incidence rate of AJCC T1 + T2 tumours (APC = 0.97%, 0.57-1.37; 95% CI), whereas no increase in incidence rates of AJCC T3 + T4 tumours was found (APC = -0.01%, -0.26 to 0.25; 95% CI). The disease-specific survival improved with calendar period for all tumour sizes (HR = 0.988; 0.984-0.993; 95% CI).

Conclusion: Increasing incidence rate and improved survival rate for uveal melanoma was found concordantly with a decrease in tumour size during a 70-year period.


Figures

Fig. 1
Fig. 1
Flowchart illustrating the inclusion of patients to the study. DOOG = Danish Ophthalmologic Oncology Group.
Fig. 2
Fig. 2
Crude incidence rates and annual percentage change in incidence rates in Danish patients with choroidal and ciliary body melanoma from 1943 through 2017. Black dots denote crude incidence rates by 5‐year periods. Blue line denotes annual percentage change. 95% confidence intervals are presented by the grey area.
Fig. 3
Fig. 3
Crude incidence rates and annual percentage change in Danish patients with uveal melanoma from 1943 through 2017 subdivided into AJCC tumour stages and – sizes. Dots denote crude rates by 5 year intervals and lines denote annual percentage change. Grey areas represent 95% confidence intervals. (A) Red line denotes incidence rates in low stage tumours (AJCC stage I and II) and turquoise line denotes advanced stage tumours (AJCC stage III and IV). (B) Red line denotes incidence rates in small tumours (AJCC T1 and T2) and turquoise line denotes large tumours (AJCC T 3 and T4). (C) Blue line denotes incidence rates in advanced stage tumours (AJCC stage III and IV). Low stage tumours are subdivided into AJCC stage I (red line) and AJCC stage II (green line). (D) Blue line denotes incidence rates in large tumours (AJCC T3 and T4). Small tumours are subdivided into AJCC T1 (red line) and AJCC T2 (green line). AJCC = American Joint Committee on Cancer, T = AJCC tumour size.
Fig. 4
Fig. 4
Age Period Cohort (APC) models for small (T1‐2) and large (T3‐4) AJCC tumour sizes. Reference cohort is 1940 and reference for the calendar period is 1980. The model shows the individual effects of age, period and cohort by three lines A, B and C, respectively on the incidence of posterior uveal melanoma. A, The incidence according to age increased until the age of approximately 70‐years in both models. B, There was no significant effect of birth cohort on the incidence in both models. C, The incidence according to calendar period increased significantly after 1990 for small sized tumours but remained stable for large sized tumours throughout the period. The estimations of drift (the slope) are shown in Table 2. AJCC = American Joint Committee on Cancer.
Fig. 5
Fig. 5
Logarithmic relative hazard in small and large tumours from 1968 through 2017 in relation to calendar period. Black line depicts small tumours (AJCC T1 and T2) and yellow line depicts large tumours (AJCC T3 and T4). 95% confidence intervals are presented by blue areas. The figure graphically presents the log relative hazard (RH) of small and large tumours, respectively, relative to calendar year when all other covariates are fixed (age = 60 years, sex = male). In 1980 (reference year) the RH of small tumours was 1 (logRH = 0) and in 2007 the RH had decreased to 0.6 (logRH = (−0.5)). Thus, the model demonstrates a 40% decreased risk of disease specific mortality in posterior uveal melanomas diagnosed in 2007 compared to 1980. T = AJCC tumour size.
Fig. 6
Fig. 6
Relative survival categorized by calendar periods. The coloured lines represent all‐cause mortality of the study population according to AJCC tumour sizes. The blue solid line depicts survival probability in the Danish background population conditioned on identical distribution of age, sex and birth year. The distance between the coloured lines and the blue line represents excess mortality which can be interpreted as the disease specific mortality. T = AJCC tumour size.
Fig. 7
Fig. 7
Cumulative incidence functions of disease specific mortality with death from other causes as a competing event, Fine and Grey model. Curves are shown as disease specific survival by year of diagnosis in the following periods: 1968–1980, 1981–1990, 1991–2000, 2001–2010 and 2011–2017. The solid lines represents death due to MMC and the dotted lines represents death due to other causes.

Similar articles

Cited by

References

    1. Ah‐Fat F & Damato B (1998): Delays in the diagnosis of uveal melanoma and effect on treatment. Eye 12: 781–782. - PubMed
    1. Andersson TML, Rutherford MJ & Humphreys K (2017): Assessment of lead‐time bias in estimates of relative survival for breast cancer. Cancer Epidemiol 46: 50–56. - PubMed
    1. Aronow ME & Topham AKSA (2018): Uveal melanoma: 5‐year update on incidence, treatment, and survival (SEER 1973–2013). Ocul Oncol Pathol 4: 145–151. - PMC - PubMed
    1. Bagger M, Andersen MT, Andersen KK, Heegaard S, Andersen MK & Kiilgaard JF (2014): The prognostic effect of American Joint Committee on Cancer staging and genetic status in patients with choroidal and ciliary body melanoma. Invest Ophthalmol Vis Sci 56: 438–444. - PubMed
    1. Bagger M, Smidt‐Nielsen I, Andersen MK, Jensen PK, Heegaard S, Andersen KK, Friis S & Kiilgaard JF (2018): Long‐term metastatic risk after biopsy of posterior uveal melanoma. Ophthalmology 1–8. - PubMed

Publication types