. 2021 Mar 19:10:e58565.
doi: 10.7554/eLife.58565.

Enhanced insulin signalling ameliorates C9orf72 hexanucleotide repeat expansion toxicity in Drosophila

Affiliations

Enhanced insulin signalling ameliorates C9orf72 hexanucleotide repeat expansion toxicity in Drosophila

Magda L Atilano et al. Elife. .

Abstract

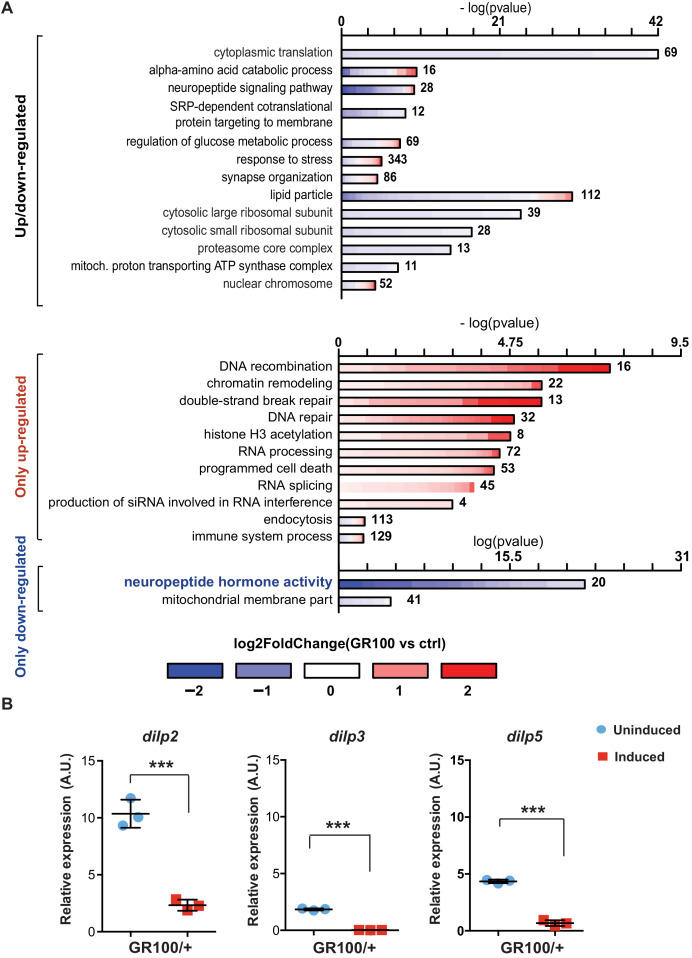
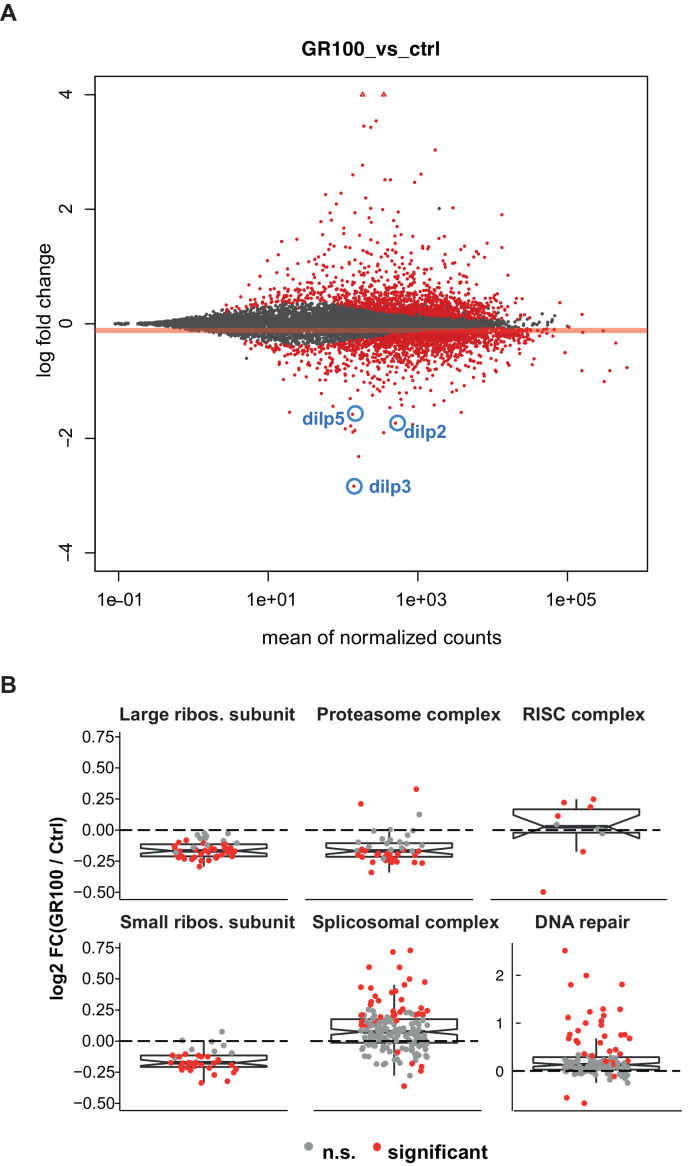
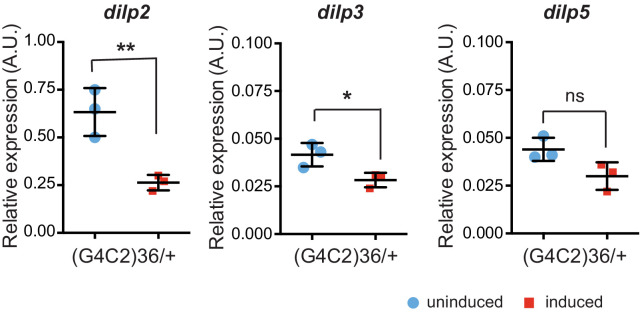
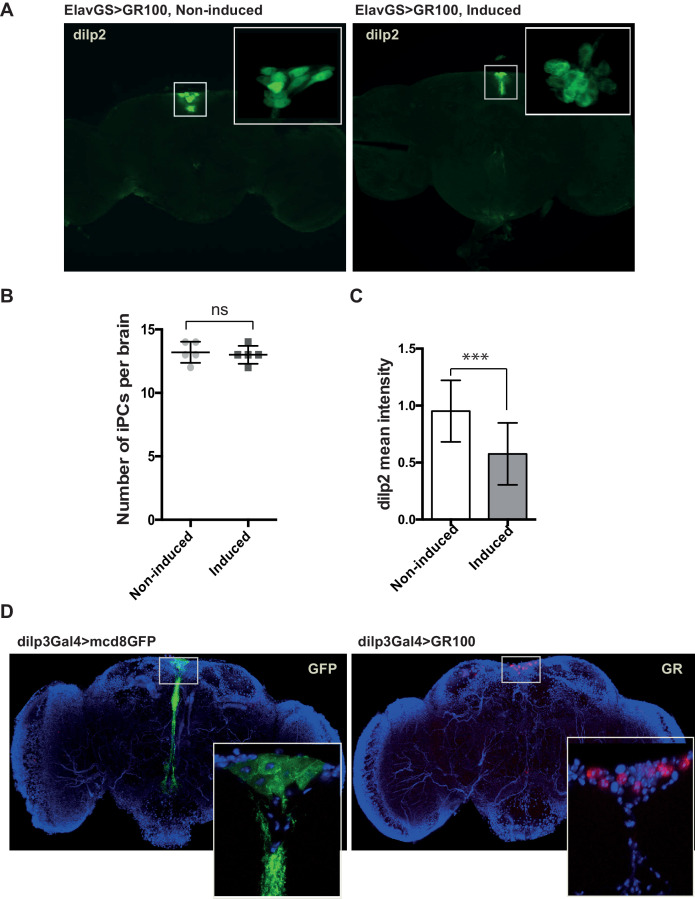
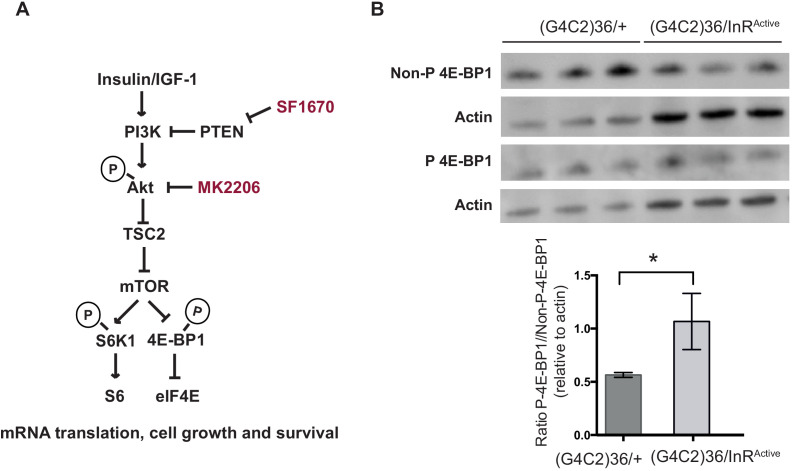
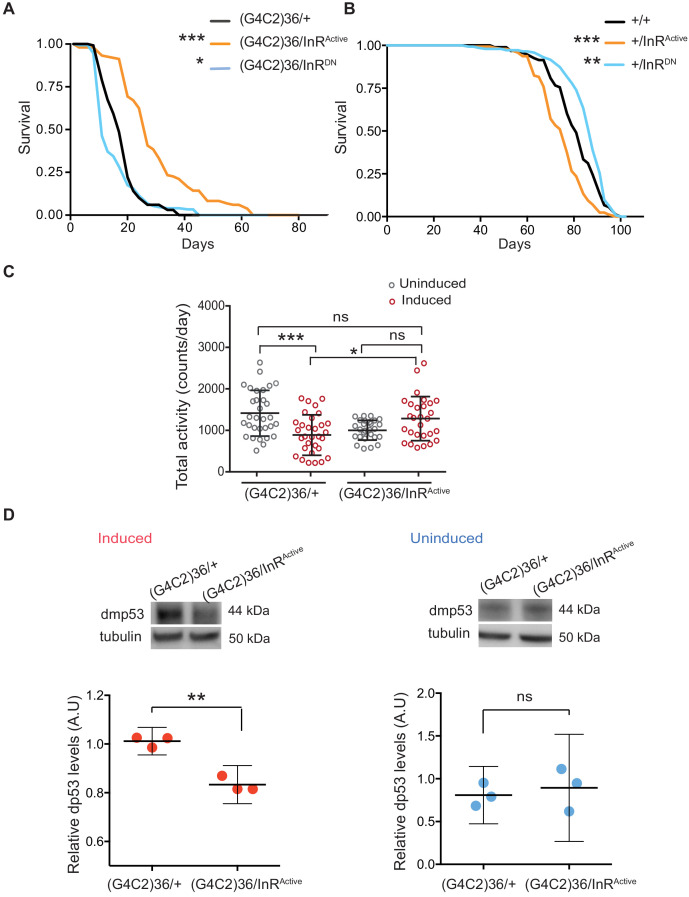
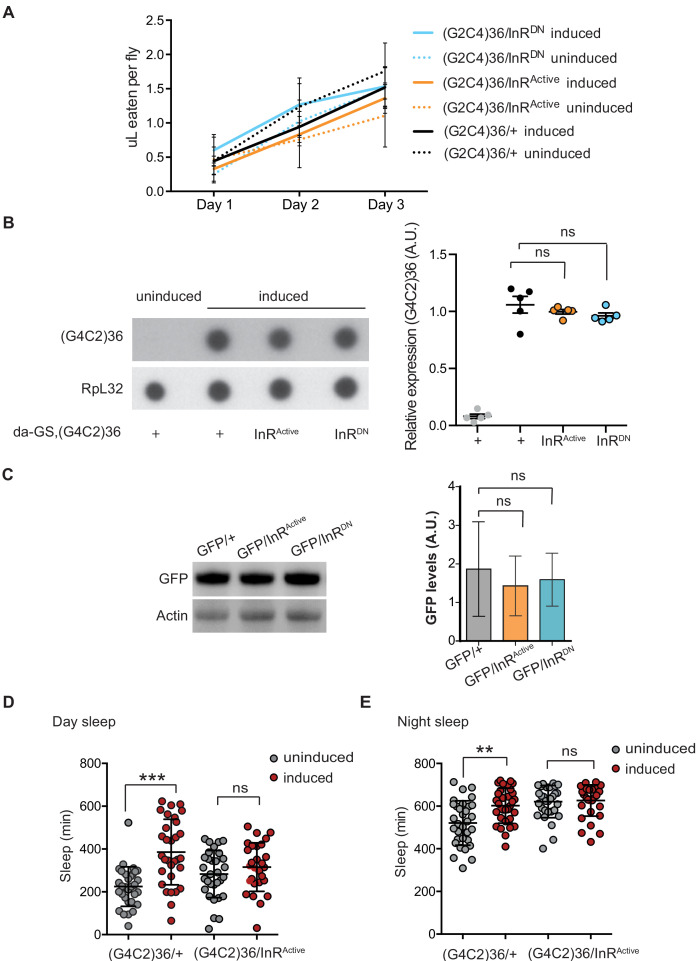
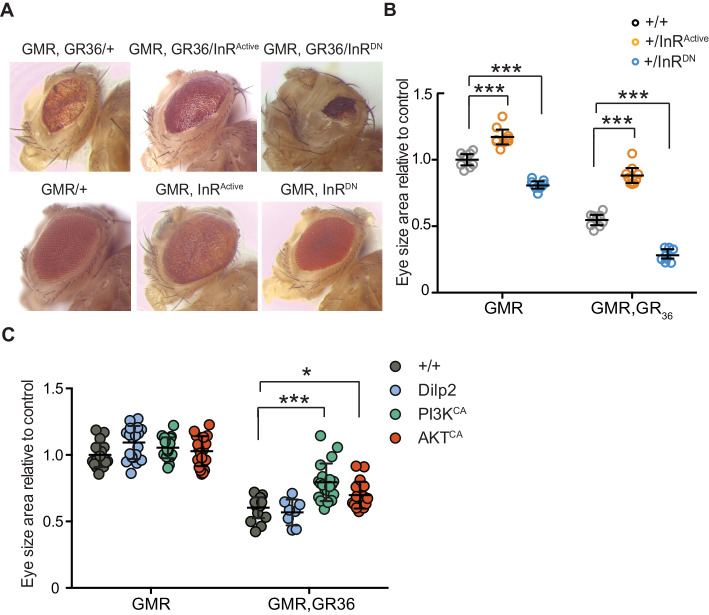
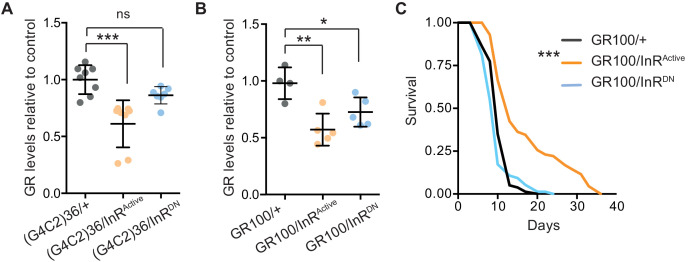
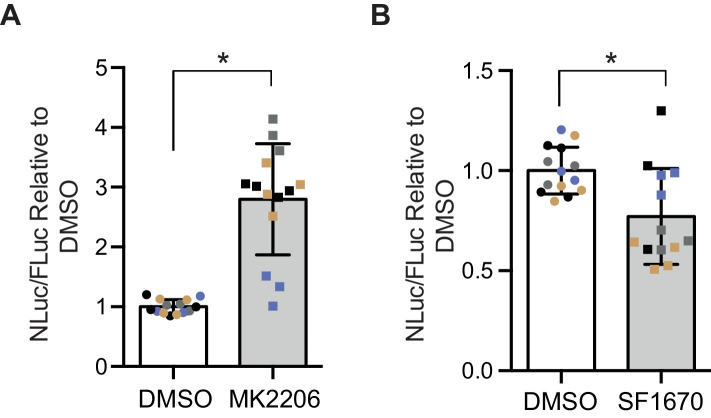
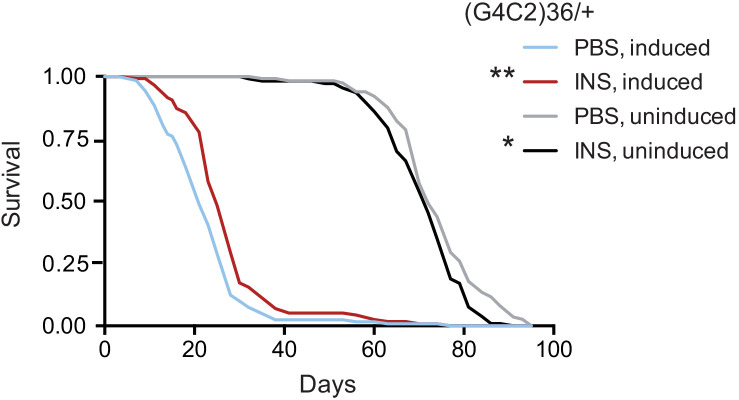
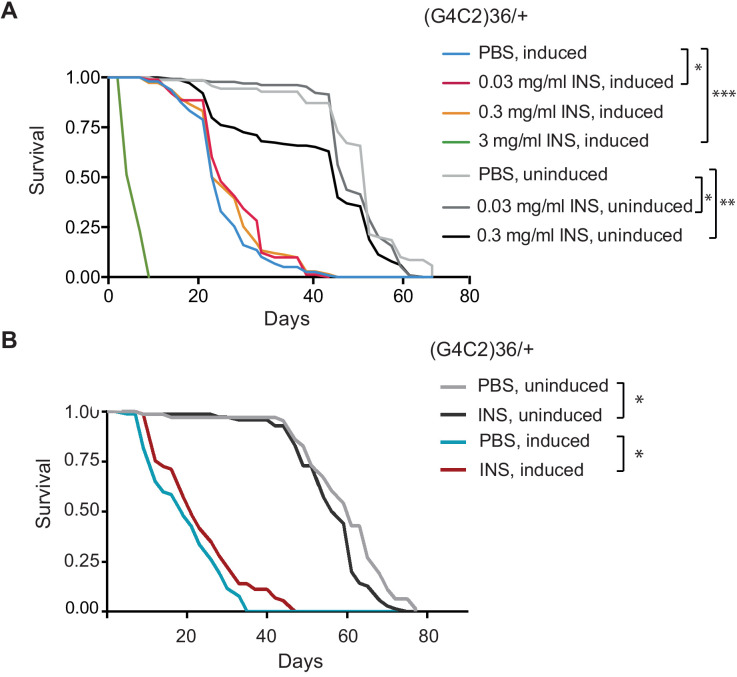
G4C2 repeat expansions within the C9orf72 gene are the most common genetic cause of amyotrophic lateral sclerosis (ALS) and frontotemporal dementia (FTD). The repeats undergo repeat-associated non-ATG translation to generate toxic dipeptide repeat proteins. Here, we show that insulin/IGF signalling is reduced in fly models of C9orf72 repeat expansion using RNA sequencing of adult brain. We further demonstrate that activation of insulin/IGF signalling can mitigate multiple neurodegenerative phenotypes in flies expressing either expanded G4C2 repeats or the toxic dipeptide repeat protein poly-GR. Levels of poly-GR are reduced when components of the insulin/IGF signalling pathway are genetically activated in the diseased flies, suggesting a mechanism of rescue. Modulating insulin signalling in mammalian cells also lowers poly-GR levels. Remarkably, systemic injection of insulin improves the survival of flies expressing G4C2 repeats. Overall, our data suggest that modulation of insulin/IGF signalling could be an effective therapeutic approach against C9orf72 ALS/FTD.

Keywords: C9orf72; D. melanogaster; hexanucleotide repeats; insulin signalling; neuroscience.


Conflict of interest statement

MA, SG, TN, LK, OH, JM, OH, MD, MA, AH, MS, AM, MB, IG, AI, LP No competing interests declared

Figures

Figure 1.
Figure 1.. Insulin signalling is down-regulated in flies expressing C9orf72 repeats.
(A) Gene ontology enrichment of genes with altered expression when GR100 was expressed in neurons. In the top graph, bars represent enrichment of up- and down-regulated genes. In the bottom graph, upper bars represent only up-regulated genes, lower bars represent only down-regulated genes. Lengths of bars represent negative log-transformed, adjusted p-values for Fisher’s exact enrichment test. Bar colour indicates log2-fold changes between GR100 and control per gene. Neuropeptide/hormone activity genes were down-regulated. (B) Quantitative RT-PCR analysis of dilp 2, 3, and 5 normalized against tubulin in fly heads expressing GR100 in neurons. Data was assessed by t-test and presented as mean ± SD, n = 3; dilp2: p=0.0004; dilp3: p<0.0001, dilp5: p<0.0001. Genotypes: (A) w; UAS-GR100/+; ElavGS/+ (GR100), w; +; ElavGS/+ (ctrl) and (B) w; UAS-GR100/+; ElavGS/+.
Figure 1—figure supplement 1.
Figure 1—figure supplement 1.. Expression of GR100 in fly neurons induces strong perturbation of the transcriptome.
(A) MA-plot of DESeq2 output indicating genes that were significantly differentially expressed (red dots), non-significantly differentially expressed (grey circles), and significantly expressed outside the 4 to −4 log-fold change limit (red triangles) in GR100 over-expression flies relative to control flies. Dilp2, 3, and 5 are annotated (blue circles). (B) Graphs display the relative expression of all genes associated with the identified GO-term categories with altered expression. Log2-fold change of the genes in GO categories: DNA repair, proteasome complex, spliceosome complex, RISC complex, and small and large ribosomal subunits. (A and B) Genotypes: w; UAS-GR100/+; ElavGS/+ (GR100) and w; +; ElavGS/+ (ctrl).
Figure 1—figure supplement 2.
Figure 1—figure supplement 2.. Insulin-like peptides 2, 3, and 5 are down-regulated in flies expressing (G4C2)36.
Quantitative RT-PCR analysis of dilp 2, 3, and 5 normalized against tubulin in fly heads expressing (G4C2)36 in neurons. Blue circles show data obtained from uninduced flies, red squares data obtained from induced flies. Data was assessed by t-test and presented as mean ± SD, n = 3, *p=0.017, **p=0.008, ns p=0.0620. Genotype: w; UAS-(G4C2)36 /+; ElavGS/+.
Figure 1—figure supplement 3.
Figure 1—figure supplement 3.. Expression of GR100 in fly neurons does not induce loss of IPCs.
(A) Representative confocal images of dilp2 immunostaining (green) in the IPCs of adult female flies expressing neuronal GR100 (induced) or not (non-induced). (B) Quantified IPC number present in brains of non-induced and induced flies expressing GR100. No significant difference (p=0.694) was found. Data was assessed by t-test and presented as mean ± SD, n = 5. (C) Quantified dilp2 mean immunofluorescence intensities in IPCs. Flies expressing GR100 had significantly reduced dilp2 levels (Mann-Witney test, ***p<0.0001). Data are presented as mean ± SD, n = 24. (D) IPC immunostaining with anti-GR (red) and anti-GFP (green) antibodies. Local expression of poly-GR repeats in IPCs using dilp3-Gal4 driver showed that the IPCs were still able to produce GR100 (red). Flies expressing GFP in IPCs were used as control. Genotypes (A), (B), and (C) w; UAS-GR100/+; ElavGS/+. (D) w; UAS-GR100 /dilp3-Gal4 and w; UAS-mcd8-GFP /dilp3-Gal4.
Figure 1—figure supplement 4.
Figure 1—figure supplement 4.. Insulin pathway activity is down-regulated in flies expressing (G4C2)36.
(A) Insulin signalling pathway. Insulin binds to insulin receptor, activating insulin receptor substrates and subsequently PI3K-Akt-mTOR pathway. SF1670 is a PTEN inhibitor and MK2206 is a pan-Akt inhibitor. (B) Western blot analysis of the phosphorylated and non-phosphorylated 4E-BP1. Flies expressing (G4C2)36 had a significantly decreased ratio of phosphorylated 4E-BP1 to the non-phosphorylated form compared with flies expressing both (G4C2)36 and InRActive (*p=0.03, unpaired t-test). Data are presented as mean ± SD, n = 3. Genotype (B) w; UAS-(G4C2)36/+; ElavGS/+ and w; UAS-(G4C2)36 /UAS-InRActive; ElavGS/+.
Figure 2.
Figure 2.. Activation of insulin signalling reduces G4C2 repeat toxicity in vivo.
(A) Lifespan of flies (n = 150) expressing (G4C2)36 or co-expressing InR constructs (InRActive, InRDN) in neurons. Lifespan was significantly extended in (G4C2)36 disease flies co-expressing InRActive compared with (G4C2)36 expressing flies (***p=2.8×10⁻²¹ – log-rank test) and decreased when co-expressed with InRDN (*p=0.027). (B) Lifespan of wild-type flies (n = 150) expressing InRActive or InRDN in neurons. Lifespan was significantly reduced in flies expressing InRActive compared with control flies (***p=2.64×10⁻⁶ – log-rank test) and increased in flies expressing InRDN (**p=0.0035). (C) Total activity of flies expressing (G4C2)36 in neurons was significantly reduced compared with uninduced control flies (***p=0.0003). (G4C2)36 flies co-expressing InRActive showed increased activity (*p=0.018) compared with flies expressing (G4C2)36 alone (two-away ANOVA followed by Holm-Sidak’s comparison test). Data are presented as mean with SD (n = 30 per genotype). (D) Flies expressing (G4C2)36 alone had significantly increased levels of p53 compared with flies expressing InRactive (**p=0.0014, t-test). Data are presented as mean ±95% confidence intervals, n = 3. Genotypes (A) w; UAS-(G4C2)36/+; ElavGS/+, w; UAS-(G4C2)36/UAS-InRActive; ElavGS/+, w; UAS-(G4C2)36/UAS-InRDN; ElavGS/+. (B) w; ElavGS/+, w; +/UAS-InRActive; ElavGS/+, w; +/UAS-InRDN; ElavGS/+. (C and D) w; UAS-(G4C2)36/+; ElavGS/+, w; UAS-(G4C2)36/UAS-InRActive; ElavGS/+.
Figure 2—figure supplement 1.
Figure 2—figure supplement 1.. Expression of InR construct does not affect fly feeding or ElavGS expression system.
(A) There were no significant differences in food intake between flies expressing (G4C2 alone or co-expressing InR constructs, or between flies induced or uninduced with RU486, one-way ANOVA, followed by Tukey’s multiple comparisons test). Data is presented as mean with standard errors of the mean. (B) Dot blot analysis of (G4C2)36 transcript levels in flies ubiquitously expressing (G4C2)36 repeats alone or co-expressing InRActive and InRDN transgenes showed no significant differences across the genotypes (one-way ANOVA, followed by Dunnett’s multiple comparisons test). (C) GFP expression levels in UAS-GFP; ElavGS flies co-expressing InRActive or InRDN determined by western blot analysis. There were no significant differences (p=0.4) in GFP levels between genotypes (one-way ANOVA, followed by Tukey’s multiple comparisons test). Data is presented as mean with ±95% confidence intervals, n = 3. (D) Expression of (G4C2)36 in neurons increased day sleep of flies (***p<0.0001, two-away ANOVA followed by Holm-Sidak’s comparison test), while this was abolished when (G4C2)36 was co-expressed with InRActive (ns; p=0.87). Data are mean ± SD (n = 32 per genotype). (E) Expression of (G4C2)36 in neurons increased night sleep of flies (**p=0.0007, two-away ANOVA followed by Holm-Sidak’s comparison test), while co-expression of InRActive abolished this phenotype (ns; p=0.81). Data are mean ± SD (n = 32 per genotype). Genotype (A) w; UAS-(G4C2)36/+; ElavGS/+, w; UAS-(G4C2)36/UAS-InRActive; ElavGS/+ and w; UAS-(G4C2)36 /UAS-InRDN; ElavGS/+. (B) w; da-GS, UAS-(G4C2)36/+, w; da-GS, UAS-(G4C2)36/UAS-InRActive and w; da-GS, UAS-(G4C2)36/UAS-InRDN. (C) w; UAS-GFP/+; ElavGS/+, w; UAS-GFP/UAS-InRActive; ElavGS/+ and w; UAS-GFP/UAS-InRDN; ElavGS/+. (D and E) w; UAS-(G4C2)36/+; ElavGS/+, w; UAS-(G4C2)36/UAS-InRActive; ElavGS/+.
Figure 3.
Figure 3.. Activation of insulin signalling reduces poly-GR toxicity via InR/PI3K/Akt.
(A) Stereomicroscopy images of representative 2-day-old adult Drosophila eyes expressing InRActive or InRDN using the GMR-GAL4 driver (bottom panel) or co-expressing both GR36 and InR constructs (top panel). (B) Eye size of flies (n = 10 per genotype) normalized to the mean of the control eye size. Expression of InRActive in a wild-type background with GMR driver caused eye overgrowth, while InRDN decreased eye size (p<0.001). Co-expression of the GR36 with InRDN greatly decreased eye size (***p<0.0001), while with InRActive substantially increased it (two-way ANOVA followed by Holm-Sidak’s multiple comparison test). Two-way ANOVA showed a significant interaction between InR genotype and expression of the repeats (p<0.0001). Data is presented as mean ± 95% confidence intervals. (C) Eye size (n = 20) of 2-day-old adult Drosophila eyes expressing dilp2, PI3KCA, or AktCA using the GMR-GAL4 driver. Co-expression of PI3KCA or AktCA with GR36 repeats yielded a partial rescue of the size of the eye (***p<0.0001 and *p=0.036 respectively, two-way ANOVA, followed by Holm-Sidak’s multiple comparison test). Data are presented as mean ± SD. Genotypes: (A and B) w; GMR-Gal4/+, w; GMR-GAL4/UAS-InRActive, w; GMR-GAL4/UAS-InRDN, w; GMR-Gal4, UAS-GR36/+, w; GMR-Gal4, UAS-GR36/UAS-InRActive, w; GMR-Gal4, UAS-GR36/UAS-InRDN. (C) w; GMR-Gal4, UAS-GR36/+, w; GMR-Gal4, UAS-GR36/+;UAS-dilp2/+, w/PI3KCA; GMR-Gal4, UAS-GR36/+, w; GMR-Gal4, UAS-GR36/AktCA, w; GMR-Gal4/+, w; GMR-Gal4/+; UAS-dilp2/+, w/PI3KCA; GMR-Gal4/+, w; GMR-Gal4/AktCA.
Figure 4.
Figure 4.. Activation of insulin signalling reduces poly-GR levels in flies.
(A) GR dipeptide levels determined by Meso Scale Discovery (MSD) immunoassay were reduced in (G4C2)36 flies expressing InRActive compared to (G4C2)36 alone flies (***p=0.0001, one-way ANOVA, followed by Tukey’s multiple comparisons test). Levels of GR were normalized to the mean GR levels of control (G4C2)36 flies. Data is presented as mean ± SD, n = 8. (B) Expression of poly-GR determined by MSD immunoassay was also reduced in flies expressing both GR100 and InRActive compared to flies expressing GR100 alone (**p=0.0025, one-way ANOVA followed by Tukey’s multiple comparison test). Co-expression of InRDN slightly reduced poly-GR levels (*p=0.044). Levels of GR were normalized to the mean GR levels of control (G4C2)36. Data are presented as mean ± SD, n = 5. (C) Lifespan was significantly extended in flies (expressing ATG driven GR100 with over-expression of InRActive compared to flies only expressing GR100; ***p=1.62×10⁻¹¹ – log rank test). Genotypes (A) w; UAS-(G4C2)36/+; ElavGS/+, w; UAS-(G4C2)36/UAS-InRActive; ElavGS/+, w; UAS-(G4C2)36/UAS-InRDN; ElavGS/+. (B, C) w; UAS-GR100/+; ElavGS/+, w; UAS-GR100/UAS-InRActive; ElavGS/+, w; UAS-GR100/UAS-InRDN; ElavGS/+.
Figure 5.
Figure 5.. Poly-GR levels are increased by Akt inhibition and decreased by PTEN inhibition in mammalian cells.
Poly-GR levels were measured using a NLuc reporter assay following a 48 hr treatment with either 1 µM MK2206 (AKT inhibitor) or SF1670 (PTEN inhibitor). (A) MK2206 significantly increases poly-GR levels (*p=0.0168). (B) SF1670 significantly decreases poly-GR levels (*p=0.0401). Each NLuc reading was normalized to FLuc for each well and further normalized to DMSO control treatment. Data given as mean ± SD of 4 biological replicates with 3–4 technical replicates per biological replicate. Data analyzed via two-tailed, unpaired Student’s t-test on the mean of each biological repeat.
Figure 6.
Figure 6.. Systemic injection of insulin rescues (G4C2)36 toxicity in Drosophila.
Injection of 0.03 mg/ml insulin (INS) significantly extended lifespan of flies (n = 120) expressing (G4C2)36 when compared with flies injected with PBS (**p=0.00034, log-rank test), while it slightly shortened lifespan in non-induced flies (*p=0.043). Genotype: w; UAS-(G4C2)36 /+; ElavGS/+.
Figure 6—figure supplement 1.
Figure 6—figure supplement 1.. Systemic injection of insulin reduces (G4C2)36 toxicity in Drosophila.
(A) Injection of different concentrations of insulin 0.03, 0.3, and 3 mg/ml into (G4C2)36 flies haemolymph (n = 120). Injection of 3 mg/ml insulin into (G4C2)36-induced flies greatly shortened their lifespan (p<0.0001, log-rank test), while 0.3 mg/ml had no significant effect (p=0.083), and 0.03 mg/ml modestly increased lifespan (p=0.038, log-rank test, PBS induced vs. 0.03 mg/ml INS induced). In uninduced (G4C2)36 flies, injection of insulin at 0.3 or 0.03 mg/ml shortened lifespan (p<0.0001, log-rank test, PBS uninduced flies vs. 0.3 mg/ml INS uninduced; p=0.039, log-rank test, PBS uninduced flies vs 0.03 mg/ml INS uninduced). (B) Injection of insulin (INS) at 0.03 mg/ml significantly extended lifespan of flies (n = 80) expressing (G4C2)36 when compared with flies injected with PBS (*p=0.037, log-rank test) in induced flies, while it shortened lifespan in non-induced flies (*p=0.007). Genotype (A, B) w; UAS-(G4C2)36/+; ElavGS/+.

References

    1. Allodi I, Comley L, Nichterwitz S, Nizzardo M, Simone C, Benitez JA, Cao M, Corti S, Hedlund E. Differential neuronal vulnerability identifies IGF-2 as a protective factor in ALS. Scientific Reports. 2016;6:25960. doi: 10.1038/srep25960. - DOI - PMC - PubMed
    1. Annenkov A. The insulin-like growth factor (IGF) receptor type 1 (IGF1R) as an essential component of the signalling network regulating neurogenesis. Molecular Neurobiology. 2009;40:195–215. doi: 10.1007/s12035-009-8081-0. - DOI - PubMed
    1. Arnold SE, Arvanitakis Z, Macauley-Rambach SL, Koenig AM, Wang HY, Ahima RS, Craft S, Gandy S, Buettner C, Stoeckel LE, Holtzman DM, Nathan DM. Brain insulin resistance in type 2 diabetes and alzheimer disease: concepts and conundrums. Nature Reviews Neurology. 2018;14:168–181. doi: 10.1038/nrneurol.2017.185. - DOI - PMC - PubMed
    1. Augustin H, McGourty K, Allen MJ, Adcott J, Wong CT, Boucrot E, Partridge L. Impact of insulin signaling and proteasomal activity on physiological output of a neuronal circuit in aging Drosophila melanogaster. Neurobiology of Aging. 2018;66:149–157. doi: 10.1016/j.neurobiolaging.2018.02.027. - DOI - PMC - PubMed
    1. Balendra R, Isaacs AM. C9orf72-mediated ALS and FTD: multiple pathways to disease. Nature Reviews Neurology. 2018;14:544–558. doi: 10.1038/s41582-018-0047-2. - DOI - PMC - PubMed

Publication types

Associated data