. 2021 Jul 5;31(8):3804-3819.
doi: 10.1093/cercor/bhab050.

Inhibition of Matrix Metalloproteinase 9 Activity Promotes Synaptogenesis in the Hippocampus

Affiliations

Inhibition of Matrix Metalloproteinase 9 Activity Promotes Synaptogenesis in the Hippocampus

Ahmad Salamian et al. Cereb Cortex. .

Erratum in

Abstract

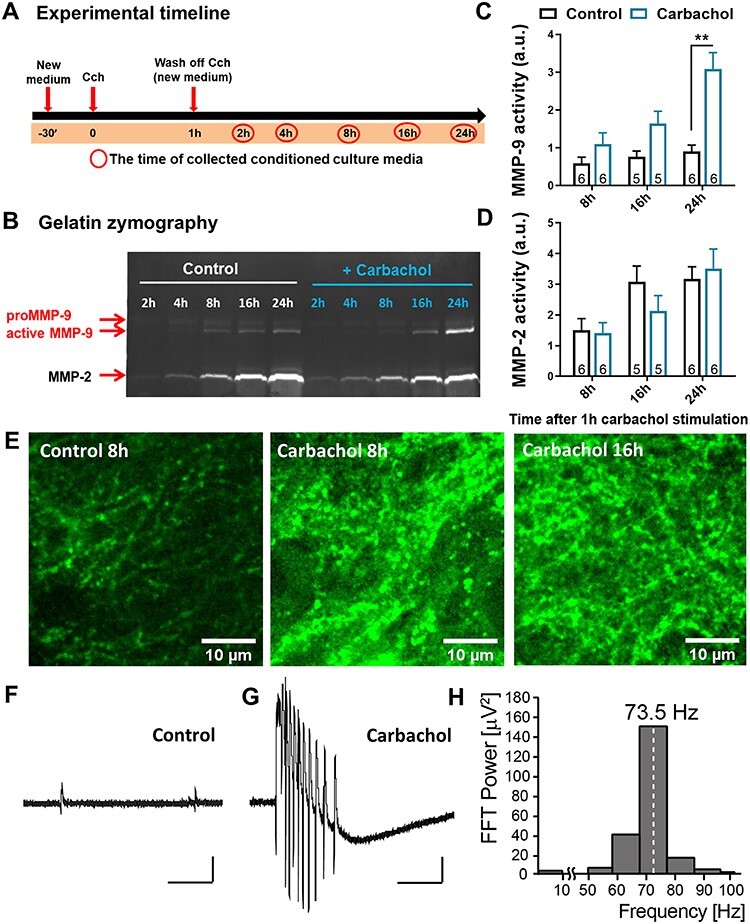
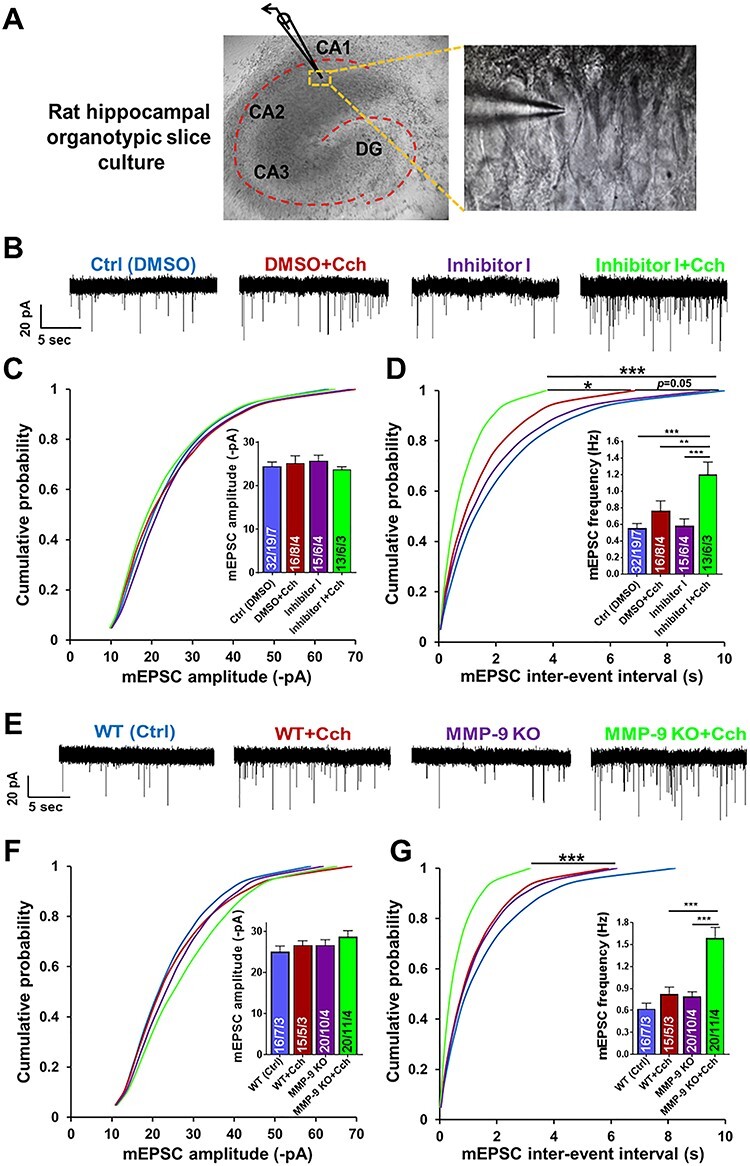
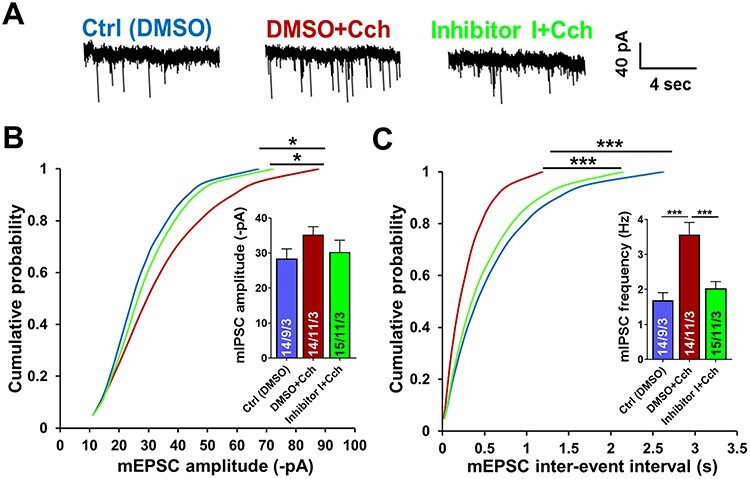
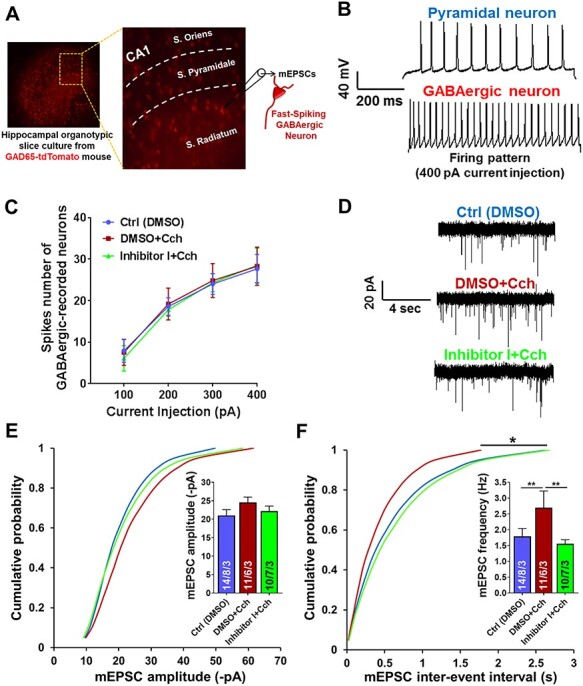
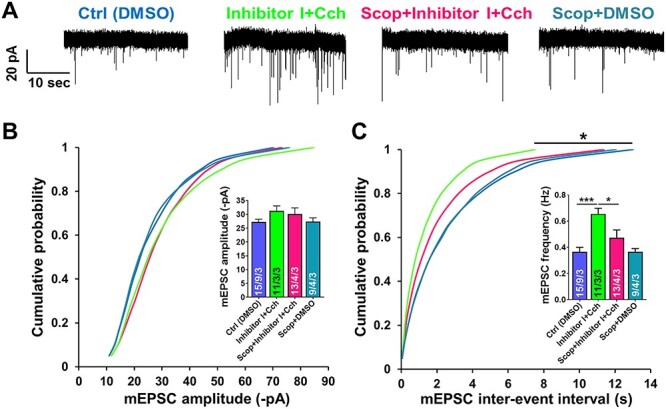
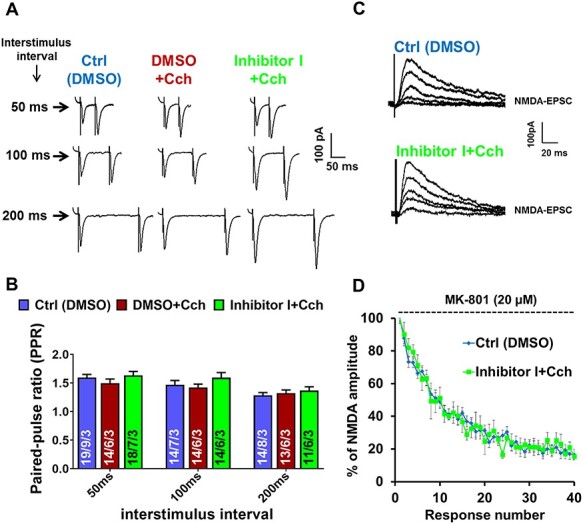
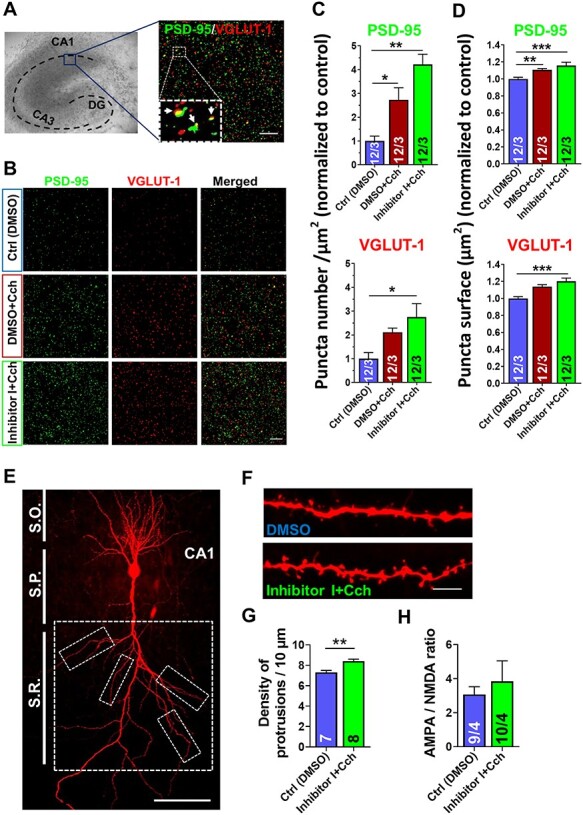
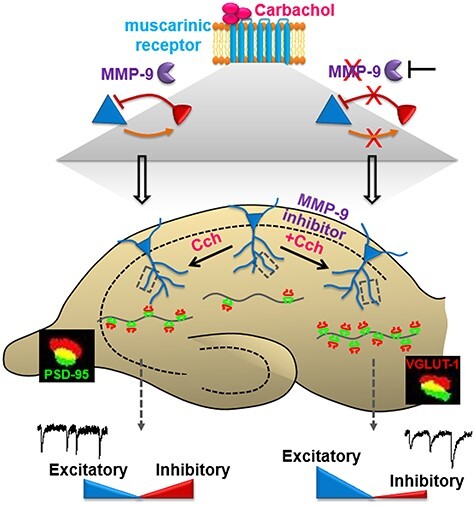
Information coding in the hippocampus relies on the interplay between various neuronal ensembles. We discovered that the application of a cholinergic agonist, carbachol (Cch), which triggers oscillatory activity in the gamma range, induces the activity of matrix metalloproteinase 9 (MMP-9)-an enzyme necessary for the maintenance of synaptic plasticity. Using electrophysiological recordings in hippocampal organotypic slices, we show that Cch potentiates the frequency of miniature inhibitory and excitatory postsynaptic currents (mIPSCs and mEPSCs, respectively) in CA1 neurons and this effect is MMP-9 dependent. Interestingly, though MMP-9 inhibition prevents the potentiation of inhibitory events, it further boosts the frequency of excitatory mEPSCs. Such enhancement of the frequency of excitatory events is a result of increased synaptogenesis onto CA1 neurons. Thus, the function of MMP-9 in cholinergically induced plasticity in the hippocampus is to maintain the fine-tuned balance between the excitatory and the inhibitory synaptic transmission.

Keywords: MMP-9; carbachol; excitatory; inhibitory; synaptogenesis.


Figures

Figure 1
Figure 1
MMP-9 enzymatic activity timeline in the CA1 stratum radiatum area. (A) An experimental timeline representing different time points (red circles) of collecting conditioned culture media after 1 h of Cch (10 μM) treatment from hippocampal organotypic slice cultures. (B) An example of gelatin zymography, which shows the enzymatic activity of MMP-9 and MMP-2 in equal amounts of culture media from different time points up to 24 h after Cch, displayed in part A. Two forms of MMP-9, pro- and active enzyme, were detected based on the molecular weight. (C) Quantified data indicate that MMP-9 active form gradually increases after Cch treatment with a significant peak at 24 h (F1,28 = 26.62, P = 0.009, n = 6). (D) No difference is observed in MMP-2 activity. Data are represented as mean ± SEM; the values on bars represent the numbers of independent cultures). (E) Example confocal images of the intensity of DQ gelatin fluorescence 8 h after DMSO the (Ctrl, left), 8 h after Cch (middle) and 16 h after Cch treatment (right). (F) A field potential example trace representing a baseline activity of an organotypic slice. (G) A field potential recording of a burst of gamma oscillations during 1 h application of Cch. Scale bars: 200 ms; 10 μV. (H) Fast Fourier transform analysis of a gamma trace presented in G. Statistical comparisons were performed using mixed-effects RM ANOVA followed by Sidak’s multiple comparisons test (P value: **  P < 0.01).
Figure 2
Figure 2
Chemical inhibition or genetic ablation of MMP-9 results in a dramatic increase of the frequency of AMPAR mEPSCs induced by Cch at hippocampal CA1 excitatory synapses. (A) A DIC image of rat hippocampal organotypic slice culture displaying a patched pyramidal cell in the CA1 region. (B) Representative traces of mEPSCs from different experimental groups. (C) Cumulative distributions of event amplitudes and mean event amplitudes (inset) display no effect of Cch (10 μM) on mEPSCs amplitude. (D) Cumulative distributions of interevent intervals and mean event frequencies (inset) show an increase of mEPSCs frequency after Cch and further increase by inhibition of MMP-9 activity. (E) Representative traces of mEPSCs. (F) Cumulative distributions of event amplitudes and mean event amplitudes (inset) show no difference of AMPAR mEPSCs amplitude between WT or MMP-9 KO slices, control and Cch treated (mouse hippocampal organotypic slice cultures). (G) Cumulative distributions of interevent intervals and mean event frequencies (inset) of MMP-9 KO slices reveal a dramatic increase of AMPAR mEPSCs frequency after Cch stimulation compared to KO and WT controls. Statistical comparisons on cumulative distributions were performed with Kolmogorov-Smirnov test and nested one-way ANOVA followed by Sidak’s test for bar graph inserts (mEPSCs frequency: F3,34 = 12.70, Inh I + Cch vs. Ctrl P < 0.001, Inh I + Cch vs. Cch P = 0.007, Inh I + Cch vs. Inh I P = 0.0002; mEPSCs frequency in MMP-9 KO: F3,29 = 17.04, MMP-9 KO + Cch vs. WT + Cch P = 0.0003, MMP-9 KO + Cch vs. MMP-9 KO P < 0.0001). Numbers inside each bar represent the numbers of neurons/slices/cultures. The number of slices was used for statistical analysis (P value: *P < 0.05, **P < 0.01, ***P < 0.001).
Figure 3
Figure 3
MMP-9 blocking impairs cholinergic activation-mediated increase of inhibitory input onto hippocampal CA1 pyramidal neurons. (A) Representative traces of mIPSCs from different experimental groups. (B) Cumulative distributions of event amplitudes and mean event amplitudes (inset) display an increase in mIPSCs amplitude by Cch, and a slight impairment by inhibition of MMP-9. (C) Cumulative distributions of interevent intervals and mean event frequencies (inset) show almost 2-fold enhancement of inhibitory currents frequency by Cch that is disrupted by blockage of MMP-9. Data shown as mean ± SEM (numbers of neurons/independent cultures). Statistical comparisons on cumulative distributions were performed using Kolmogorov-Smirnov test and nested one-way ANOVA followed by Sidak’s test for bar graph inserts (mIPSCs frequency: F2,28 = 14.06, Cch vs. Ctrl P = 0.0001, Inh I + Cch vs. Cch P = 0.0005). Numbers inside each bar represent the numbers of neurons/slices/cultures. Statistical analysis was based on the number of slices (P value: *P < 0.05, ***P < 0.001).
Figure 4
Figure 4
Blockage of MMP-9 prevents the enhancement of excitatory input onto a subpopulation of fast-spiking GABAergic neurons, mediated by cholinergic activation. (A) Hippocampal organotypic slice culture from GAD65-tdTomato mouse. AMPAR mEPSCs were recorded from stratum radiatum fast-spiking GAD65-positive neurons. (B) Examples of APs traces of the CA1 pyramidal neuron and the fast-spiking GABAergic neuron induced by 400 pA current injection. (C) Spikes number of GABAergic neurons, subjected to record AMPAR mEPSCs, demonstrates the same firing pattern induced by different current injections (100, 200, 300, 400 pA). (D) Representative traces of AMPAR mEPSCs. (E) Cumulative distributions of event amplitudes and mean event amplitudes (inset) indicate no difference in the amplitudes. (F) Cumulative distributions of interevent intervals and mean event frequencies (inset) reveal significant increase in the frequency of miniature excitatory input onto the fast-spiking GABAergic neurons by Cch and its disruption when MMP-9 is blocked. Data shown as mean ± SEM (numbers of neurons/independent cultures). Statistical comparisons on cumulative distributions were performed using Kolmogorov-Smirnov test and nested one-way ANOVA followed by Sidak’s test for bar graph inserts (mEPSCs frequency: F2,32 = 6.52, Cch vs. Ctrl P = 0.009, Inh I + Cch vs. Cch P = 0.009). Numbers inside each bar represent the numbers of neurons/slices/cultures. Statistical analysis was based on the number of slices (P value: *P < 0.05, **P < 0.01).
Figure 5
Figure 5
Muscarinic receptors–mediated cholinergic activation mediates enhancement of AMPAR mEPSCs frequency at hippocampal CA1 excitatory synapses. (A) Representative traces of AMPAR mEPSCs. (B) Cumulative distributions of event amplitudes and mean event amplitudes (inset) display no significant difference in mEPSCs amplitude. (C) Cumulative distributions of interevent intervals and mean event frequencies (inset) demonstrate that enhancement of AMPAR mEPSCs frequency, which is mediated by MMP-9 inhibition and Cch, is impaired by cholinergic muscarinic receptors antagonist (Scop). Data shown as mean ± SEM (numbers of neurons/independent cultures). Statistical comparisons were performed using Kolmogorov-Smirnov test on cumulative distributions and nested one-way ANOVA followed by Sidak’s test for bar graph inserts (mEPSCs frequency: F3,16 = 10.26, Inh I + Cch vs. Ctrl P = 0.0009, Scop + Inh I + Cch vs. Inh I + Cch P = 0.01). Numbers inside each bar represent the numbers of neurons/slices/cultures. Statistical analysis was based on the number of slices (P value: *P < 0.05, ***P < 0.001).
Figure 6
Figure 6
Carbachol does not affect the probability of glutamate release. (A) Example of PPR traces of AMPA receptor–mediated EPSCs with three interstimulus intervals (50, 100, 200 ms) from different experimental groups. (B) Quantified data of PPR of amplitudes from stimulated groups (Cch and Inhibitor I + Cch) reveal no significant difference compared to control in neither of three interstimulus intervals. (C) Example traces of consecutive NMDAR responses in the presence of open-channel blocker MK-801. (D) Decay of NMDA receptor EPSCs amplitude normalized to the first amplitude recorded in the presence of MK-801 showing that inhibition of MMP-9 does not affect the decay kinetics of NMDAR responses (n = 6 neurons). Data in B are represented as mean ± SEM. Numbers inside each bar represent the numbers of neurons/slices/cultures. Statistical analysis was based on the number of slices.
Figure 7
Figure 7
Augmented excitatory synaptogenesis and increase in dendritic protrusions density mediated by cholinergic activation is boosted by inhibition of MMP-9. (A) An illustration of rat hippocampal organotypic slice culture where blue box indicates the region imaged with confocal microscope, and an example of immunolabeling of PSD-95 (green) and VGLUT-1 (red; merged image), with their colocalizations shown with arrows in the magnified box. Scale bars: 10 μm. (B) Representative examples of double immunolabeling of PSD-95 and VGLUT-1 from experimental groups. Scale bars: 10 μm. Quantitative measurement of PSD-95– or VGLUT-1–positive puncta reveals a significant increase in the number (C) as well as surface area (D) 21 h after Cch, normalized to control, with further enhancement in the presence of MMP-9 blocker (n = 48 images; 12 slices; 3 independent cultures). Forty-four images of PSD-95 puncta were analyzed in the control (DMSO) group. (E) A CA1 pyramidal neuron filled with biocytin and stained with Alexa-Fluor–conjugated streptavidin. Dashed boxes represent areas on secondary and tertiary apical dendrites where protrusions density was measured. Scale bar: 100 μm. S.R.—stratum radiatum, S.P.—stratum pyramidale, S.O.—stratum oriens. (F) Examples of secondary apical dendrites. Scale bars: 5 μm. (G) Dendritic protrusions analysis shows a significant density increase in the Inhibitor I + Cch group (n = 8 pyramidal neurons (8 slices)/56 dendritic segments) compared to control (DMSO, n = 7 pyramidal neurons (7 slices)/48 dendritic segments). (H) The ratio of AMPA/NMDA receptors–mediated EPSCs amplitudes in CA1 pyramidal neurons shows no significant difference between Ctrl and Inh I + Cch (n = 4 slices), (numbers inside each bar represent the numbers of neurons/slices). Data shown as mean ± SEM. Statistical comparisons of puncta number and surface were based on the number of independent cultures and performed with nested one-way ANOVA test followed by Tukey’s multiple comparison test. Statistical analysis of protrusions density was based on the number of slices and performed with Student’s t-test (P value: *P < 0.05; **P < 0.01; ***P < 0.001).
Figure 8
Figure 8
Graphical summary: cholinergically induced MMP-9 activity mediates the modulation of the excitatory and inhibitory synaptic transmission. Activation of cholinergic muscarinic receptors triggers an enhancement of inhibitory currents input onto hippocampal CA1 pyramidal neurons (blue), and in turn, a potentiation of fast-spiking inhibitory neurons (red) via the increase of excitatory currents input. Both synaptic connections from inhibitory to excitatory neurons and vice versa are facilitated by the activity of MMP-9. Blocking the MMP-9 activity leads to an even larger boost of excitatory currents input onto the CA1 pyramidal neurons, while preventing the inhibitory currents potentiation. These unbalanced excitatory and inhibitory transmissions strongly potentiate the growth of synaptic connections in the CA1 pyramidal neurons, while only a moderate increase in synapse number is induced by cholinergic activation when MMP-9 is active.

References

    1. Alaiyed S, Bozzelli PL, Caccavano A, Wu JY, Conant K. 2019. Venlafaxine stimulates PNN proteolysis and MMP-9-dependent enhancement of gamma power; relevance to antidepressant efficacy. J Neurochem. 148:810–821. - PMC - PubMed
    1. Behrends JC, ten Bruggencate G. 1993. Cholinergic modulation of synaptic inhibition in the Guinea pig hippocampus in vitro: excitation of GABAergic interneurons and inhibition of GABA-release. J Neurophysiol. 69:626–629. - PubMed
    1. Besser S, Sicker M, Marx G, Winkler U, Eulenburg V, Hulsmann S, Hirrlinger J. 2015. A transgenic mouse line expressing the red fluorescent protein tdTomato in GABAergic neurons. PLoS One. 10:e0129934. - PMC - PubMed
    1. Bland BH, Colom LV. 1993. Extrinsic and intrinsic properties underlying oscillation and synchrony in limbic cortex. Prog Neurobiol. 41:157–208. - PubMed
    1. Brown TE, Forquer MR, Cocking DL, Jansen HT, Harding JW, Sorg BA. 2007. Role of matrix metalloproteinases in the acquisition and reconsolidation of cocaine-induced conditioned place preference. Learn Mem. 14:214–223. - PMC - PubMed

Publication types

MeSH terms