. 2021 Apr 16;65(1):51-66.
doi: 10.1042/EBC20200021.

Single-molecule optical genome mapping in nanochannels: multidisciplinarity at the nanoscale

Affiliations

Single-molecule optical genome mapping in nanochannels: multidisciplinarity at the nanoscale

Jonathan Jeffet et al. Essays Biochem. .

Abstract

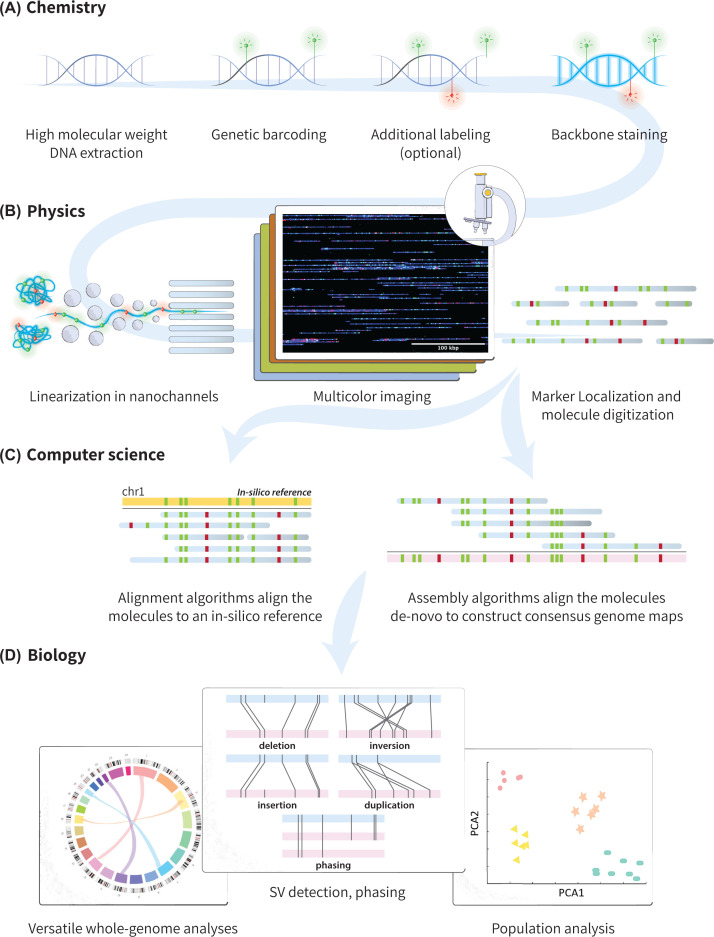
The human genome contains multiple layers of information that extend beyond the genetic sequence. In fact, identical genetics do not necessarily yield identical phenotypes as evident for the case of two different cell types in the human body. The great variation in structure and function displayed by cells with identical genetic background is attributed to additional genomic information content. This includes large-scale genetic aberrations, as well as diverse epigenetic patterns that are crucial for regulating specific cell functions. These genetic and epigenetic patterns operate in concert in order to maintain specific cellular functions in health and disease. Single-molecule optical genome mapping is a high-throughput genome analysis method that is based on imaging long chromosomal fragments stretched in nanochannel arrays. The access to long DNA molecules coupled with fluorescent tagging of various genomic information presents a unique opportunity to study genetic and epigenetic patterns in the genome at a single-molecule level over large genomic distances. Optical mapping entwines synergistically chemical, physical, and computational advancements, to uncover invaluable biological insights, inaccessible by sequencing technologies. Here we describe the method's basic principles of operation, and review the various available mechanisms to fluorescently tag genomic information. We present some of the recent biological and clinical impact enabled by optical mapping and present recent approaches for increasing the method's resolution and accuracy. Finally, we discuss how multiple layers of genomic information may be mapped simultaneously on the same DNA molecule, thus paving the way for characterizing multiple genomic observables on individual DNA molecules.

Keywords: epigenetics; genetics; nanotechnology; optical mapping; single molecule; super-resolution.


Conflict of interest statement

The authors declare that there are no competing interests associated with the manuscript.

Figures

Figure 1
Figure 1. The multi-disciplinary process of optical mapping
(A) High molecular weight DNA is extracted and chemically labeled at sequence-specific sites to generate a genetic barcode. Additional labeling of various information layers such as epigenetic marks can follow, and finally the DNA backbone is stained with an intercalating dye. (B) Using an electrical field, DNA molecules are unraveled from their entangled state and forced into nanochannels for linearization. Within the nanochannels, the labeled molecules are imaged in multiple colors (image obtained on BioNano Genomics Saphyr system). The molecules and their fluorescent marks are then detected and localized, and image analysis is performed for their digitization. (C) The digitized barcodes are then used to infer the molecules' genomic origin, either by their alignment to a known reference genome, or their assembly de novo. (D) The resulting genomic (and epigenetic) information obtained is used for biological analysis based on structural variants, copy number aberrations, genome phasing and population analyses.
Figure 2
Figure 2. Genetic labeling schemes
(A–D) sparse labeling schemes. (A) Two-step nick translation. In the first step, a nicking enzyme creates a single-strand nick in the DNA. In the second step, DNA polymerase introduces fluorescent nucleotides to the nicked site. (B) Methyltransferase-based one-step labeling. (C) Nick translation at target sequences with nicking Cas9, steps are similar to (A). (D) single-step fluorescent labeling with dCas9. (E) Continuous affinity-based labeling: competitive binding of a nonsequence-specific fluorescent intercalating dye and an AT/CG-selective molecule. This molecule blocks the dye from binding to these sites, thus keeping them dark while the rest of the genome is labeled, resulting in a sequence-specific intensity profile of the molecules.
Figure 3
Figure 3. Physical aspects of genomic optical mapping in nanochannels
(A) DNA fluctuations in nanochannels. Left, possible conformations of DNA molecules confined to nanochannels that contribute to the measured fluctuations. Reprinted from [47], with the permission of AIP Publishing. Middle, raw kymograph (left) and the corresponding marker localizations (right) of barcode labeled genomic DNA extracted from E. coli, showing the thermal fluctuations of confined DNA. Adapted from [48], with the permission of AIP Publishing. Right, probability distribution of observed marker separations in relation to their aligned genomic distance (calculated using 70,305 observed marker positions from single-frame images of 4557 DNA molecules confined to 43 × 43 nm² cross-section channels). The distribution gets wider as the genomic distance increases and therefore mapping accuracy reduces with genomic marker separation. Reprinted from [47], with the permission of AIP Publishing. (B) Improving mapping accuracy with pairwise distance averaging. Left, raw kymograph of the D4Z4 tandem repeat region in chromosome 4 (see optical genome mapping impact section), confined to 45 × 45 nm² cross-section channels (repetitive region marked with the red dashed frame). The repetitive region was used by Jeffet et al. [45] as a ruler to quantify the accuracy and resolution of optical mapping. Adjacent spots in the repetitive segment are distanced 3.3 kbp and each spot is composed of two unresolved fluorophores spaced 676 bp apart. Middle, comparison between localizations maps and cumulative pairwise distances maps of the repetitive region. The localizations map shows correlations in marker fluctuations at short genomic separations, while the distances map shows reduced fluctuations. Right, observed locations distribution compared to the pairwise distance distribution of the ruler molecule’s markers shown to the left. The distances standard deviation is reduced by ∼2-fold compared with locations, allowing increased mapping accuracy. (C) Enabling super-resolution with distance averaging. Left, schematic illustration of the method. A target consisting of multiple sub-diffraction-limit spaced fluorophores is imaged as a single gaussian signal on the camera. Pairwise distance recording between the target and an adjacent marker allows to remove the local collective fluctuations, and thus enable sensitivity to distance shifts originating from the target’s fluorophores blinking or bleaching behavior. Middle, 3D visualization of the intensity–time profile of two fluorescent spots presented in panel (B). Each spot is composed of two fluorophores, where a bleaching event of one of the fluorophores of the left spot is evident after 15 frames. Top right, Intensity time trace of the spots. Bottom right, pairwise distance time-trace between the two spots. The bleaching step alters the mean distance between the two spots allowing to resolve the sub-diffraction-limit distance between them with ∼30 nm resolution. Panels (B and C) were adapted with permission from [45]. Copyright (2016) American Chemical Society.
Figure 4
Figure 4. Genomic observables and epigenetic optical mapping in nanochannels
(A) Example observables that can be marked and viewed in optical mapping. (B) labeling schemes of the epigenetic modifications shown in A. (i) labeling of TCGA sequences that contains an unmodified cytosine by the enzyme M.TaqI and a fluorescent cofactor; (ii) two-step labeling of 5-hmC: the enzyme β-GT attaches a modified glucose with an azide group on it from uridine-diphospho-6-azide-glucose (UDP-6-N3-Glu) to the hydroxyl group of the 5-hmC. Then the azide group is reacted with a fluorescently-labeled alkyne via click chemistry; (iii) two-step labeling of DNA damage sites: The damaged lesion is enzymatically excised, and replaced by fluorescent nucleotides; (iv) in vitro labeling of origins of DNA replication: fluorescent nucleotides enter synchronized cells following electroporation. Then, fluorescence is incorporated into the newly replicated DNA and creates symmetrical replication ‘forks’. (C) An exaggerated illustration demonstrating the impact of thermal fluctuations on multi-color marker detection. Sequential color acquisitions capture the same molecule at different off-equilibrium conformations due to fluctuations. This results in an erroneous interpretation of marker locations along the DNA molecule compared to the ground truth.

References

    1. Müller V. and Westerlund F. (2017) Optical DNA mapping in nanofluidic devices: principles and applications. Lab. Chip. 17, 579–590 10.1039/C6LC01439A - DOI - PubMed
    1. Yuan Y., Chung C.Y.-L. and Chan T.-F. (2020) Advances in optical mapping for genomic research. Comput Struct Biotechnol. J. 18, 2051–2062 10.1016/j.csbj.2020.07.018 - DOI - PMC - PubMed
    1. Levy-Sakin M. and Ebenstein Y. (2013) Beyond sequencing: optical mapping of DNA in the age of nanotechnology and nanoscopy. Curr. Opin. Biotechnol. 24, 690–698 10.1016/j.copbio.2013.01.009 - DOI - PubMed
    1. Lam E.T., Hastie A., Lin C., Ehrlich D., Das S.K., Austin M.D.et al. . (2012) Genome mapping on nanochannel arrays for structural variation analysis and sequence assembly. Nat. Biotechnol. 30, 771–776 10.1038/nbt.2303 - DOI - PMC - PubMed
    1. Bocklandt S., Hastie A. and Cao H. (2019) Bionano genome mapping: high-throughput, ultra-long molecule genome analysis system for precision genome assembly and haploid-resolved structural variation discovery. In Single Mol. and Single Cell Sequencing(Suzuki Y., ed.), pp. 97–118, Springer Singapore, Singapore: 10.1007/978-981-13-6037-4_7 - DOI - PubMed

Publication types