. 2021 Mar 19;10(3):giab018.
doi: 10.1093/gigascience/giab018.

Rapid development of cloud-native intelligent data pipelines for scientific data streams using the HASTE Toolkit

Affiliations

Rapid development of cloud-native intelligent data pipelines for scientific data streams using the HASTE Toolkit

Ben Blamey et al. Gigascience. .

Abstract

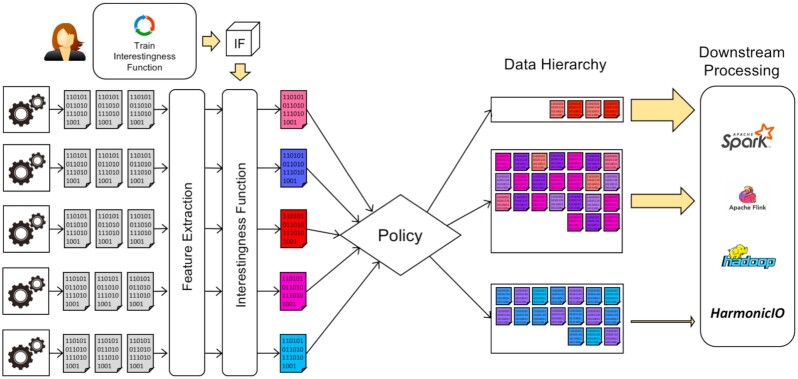
Background: Large streamed datasets, characteristic of life science applications, are often resource-intensive to process, transport and store. We propose a pipeline model, a design pattern for scientific pipelines, where an incoming stream of scientific data is organized into a tiered or ordered "data hierarchy". We introduce the HASTE Toolkit, a proof-of-concept cloud-native software toolkit based on this pipeline model, to partition and prioritize data streams to optimize use of limited computing resources.

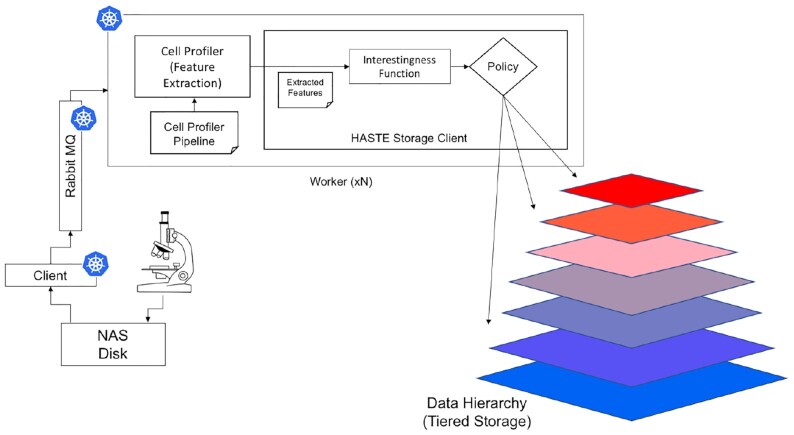
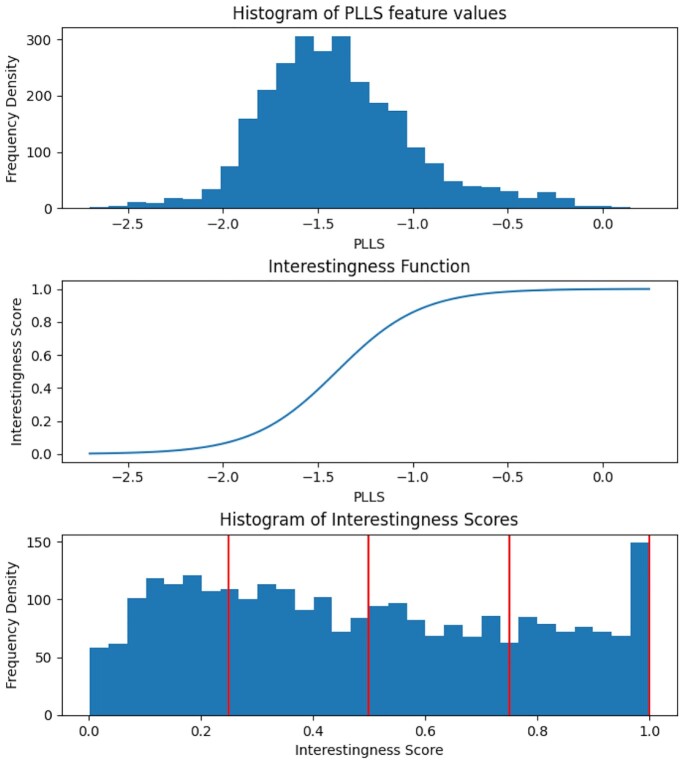
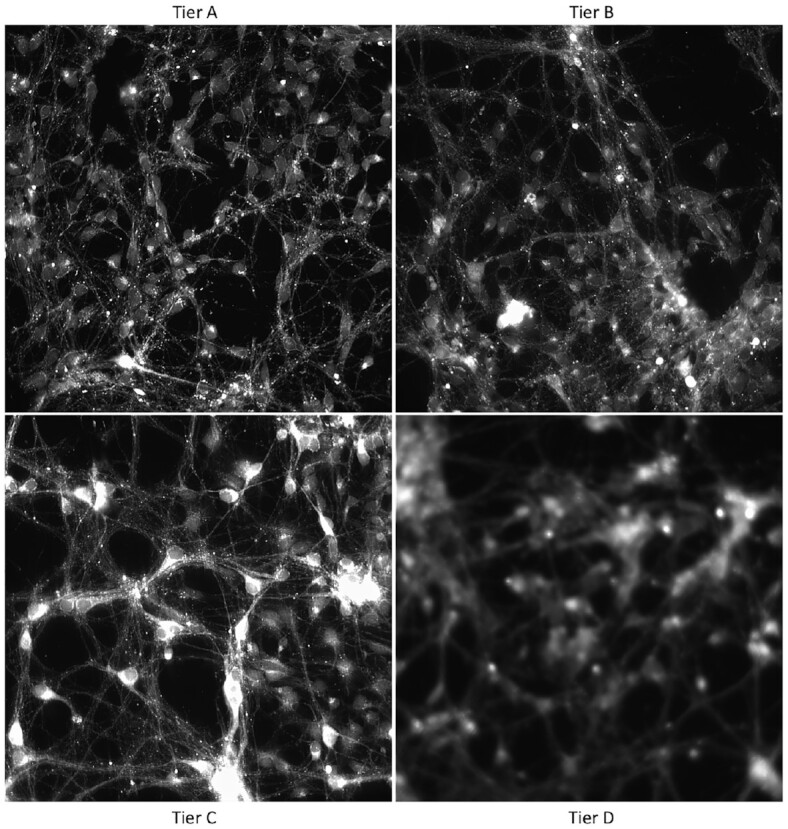
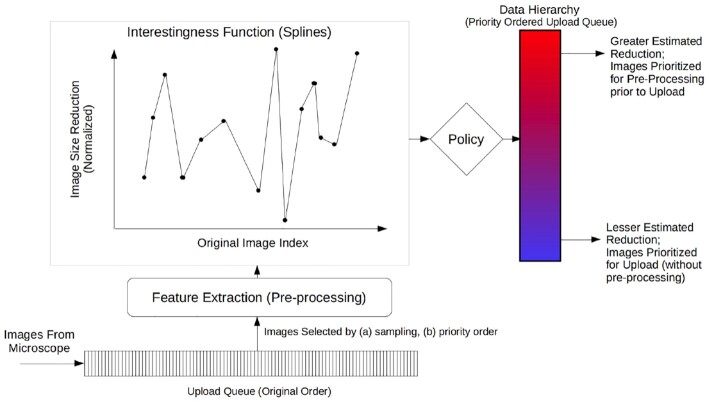
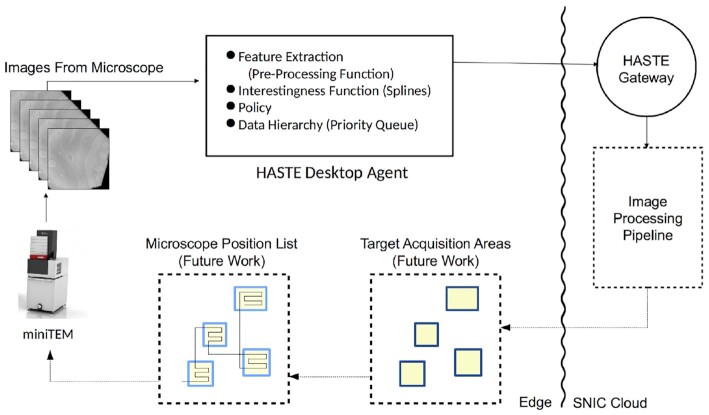
Findings: In our pipeline model, an "interestingness function" assigns an interestingness score to data objects in the stream, inducing a data hierarchy. From this score, a "policy" guides decisions on how to prioritize computational resource use for a given object. The HASTE Toolkit is a collection of tools to adopt this approach. We evaluate with 2 microscopy imaging case studies. The first is a high content screening experiment, where images are analyzed in an on-premise container cloud to prioritize storage and subsequent computation. The second considers edge processing of images for upload into the public cloud for real-time control of a transmission electron microscope.

Conclusions: Through our evaluation, we created smart data pipelines capable of effective use of storage, compute, and network resources, enabling more efficient data-intensive experiments. We note a beneficial separation between scientific concerns of data priority, and the implementation of this behaviour for different resources in different deployment contexts. The toolkit allows intelligent prioritization to be `bolted on' to new and existing systems - and is intended for use with a range of technologies in different deployment scenarios.

Keywords: HASTE; image analysis; interestingness functions; stream processing; tiered storage.


Conflict of interest statement

The authors declare that they have no competing interests.

Figures

Figure 1:
Figure 1:
Logical architecture for the HASTE pipeline model. A stream of data objects is generated by 1 or more streaming sources (such as a microscope). These objects undergo online, automated feature extraction, and an IF is applied with the extracted features as input. This associates an interestingness score with each object in the stream. A user-defined policy is then used to organize the data objects into a data hierarchy to be used for optimizing subsequent communication, storage, and downstream processing.
Figure 2:
Figure 2:
Architecture for Case Study 1. In this case study, the DH is realized as storage tiers. Images streamed from the microscope are saved to disk (network attached storage [NAS]). This disk is polled by the “client," which pushes a message about the new file to RabbitMQ. Workers pop these messages from the queue, analyze the image, and move it to the storage tiers configured in the data hierarchy, using the HASTE Storage Client, configured with an appropriate IF and policy. Icons indicate the components running as Kubernetes “pods."
Figure 3:
Figure 3:
Histograms of the PLLS feature scores (top), and when converted to an interestingness score (bottom), by application of the Logistic Function (the IF for Case Study 1, middle). The vertical lines on the bottom plot indicate tier boundaries configured in the policy; cf. example images in Fig. 4.
Figure 4:
Figure 4:
Example images from the high-content screening dataset (Case Study 1), according to automatically assigned tier. Tier A is the most in-focus, with the highest PLLS feature values and interestingness scores.
Figure 5:
Figure 5:
Architecture for Case Study 2, showing internal functionality of the HASTE Desktop Agent at the cloud edge. Images streamed from the microscope are queued at the edge for uploading after (potential) pre-processing. The DH is realized as a priority queue. Images are prioritized in this queue depending on the IF, which estimates the extent of their size reduction under this pre-processing operator: those with a greater estimated reduction are prioritized for processing (vice versa for upload). This estimate is calculated by interpolating the reduction achieved in nearby images (see Fig. 7). This estimated spline is the IF for this case study.
Figure 6:
Figure 6:
Architecture of the intended application: full control loop for the MiniTEM, with automatic imaging of target areas identified in initial scan. Control of microscope acquisition is future work. The internals of the HASTE Desktop Agent (where the HASTE model is applied) are shown in Fig. 5.
Figure 7:
Figure 7:
Image size reduction (normalized by CPU cost) over index, showing which images are processed at the edge. Those marked "processed" were processed at the cloud edge prior to upload (and vice versa)—selected either to search for new areas of high/low reduction or to exploit known areas (using the IF). The line shows the final revision of the splines estimation of the message size reduction (the IF). Note how this deviates from the true value (measured independently for illustration purposes on the same hardware) in regions of low reduction. Note the oscillating pattern, which is an artifact of movement over the grid in the miniTEM. Adapted from [27].

References

    1. Ouyang W, Zimmer C. The imaging tsunami: computational opportunities and challenges. Curr Opin Syst Biol. 2017;4:105–13.
    1. Stephens ZD, Lee SY, Faghri F, et al. Big data: astronomical or genomical?. PLoS Biol. 2015;13(7):e1002195. - PMC - PubMed
    1. Blamey B, Wrede F, Karlsson J, et al. Adapting the secretary hiring problem for optimal hot-cold tier placement under top-K workloads. In: 2019 19th IEEE/ACM International Symposium on Cluster, Cloud and Grid Computing (CCGRID) Larnaca, Cyprus; 2019:576–583.
    1. Sivarajah U, Kamal MM, Irani Z, et al. Critical analysis of big data challenges and analytical methods. J Bus Res. 2017;70:263–86.
    1. Reinsel D, Gantz J, Rydning J. Data Age 2025: The Digitization of the World from Edge to Core (Seagate White Paper); 2018. https://www.seagate.com/www-content/our-story/trends/files/idc-seagate-d.... An IDC White Paper – #US44413318. Accessed: April 2020

Publication types

LinkOut - more resources