. 2021 Apr 12;144(3):800-816.
doi: 10.1093/brain/awaa447.

Diffuse axonal injury has a characteristic multidimensional MRI signature in the human brain

Affiliations

Diffuse axonal injury has a characteristic multidimensional MRI signature in the human brain

Dan Benjamini et al. Brain. .

Abstract

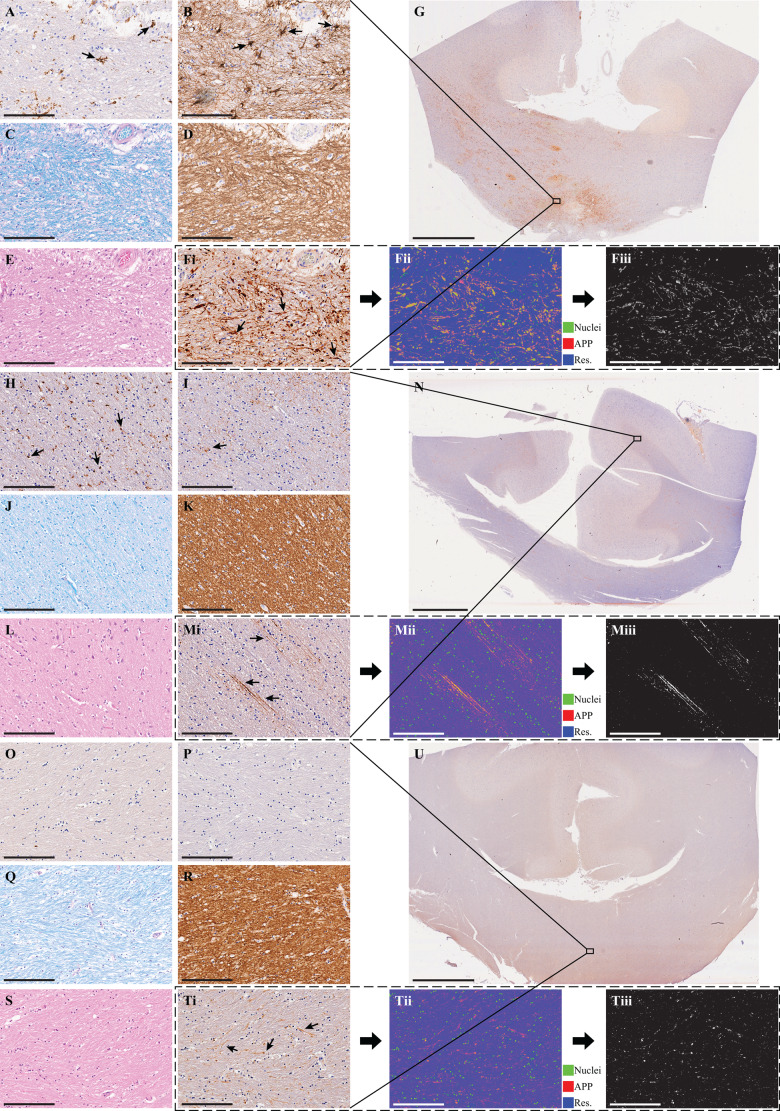
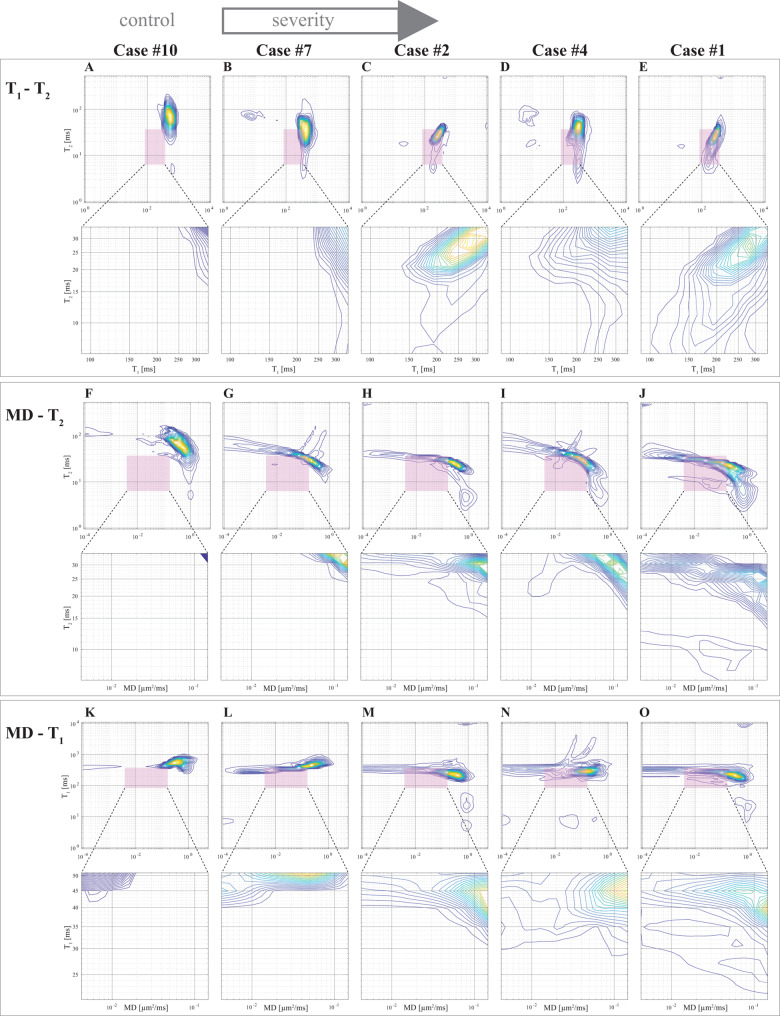
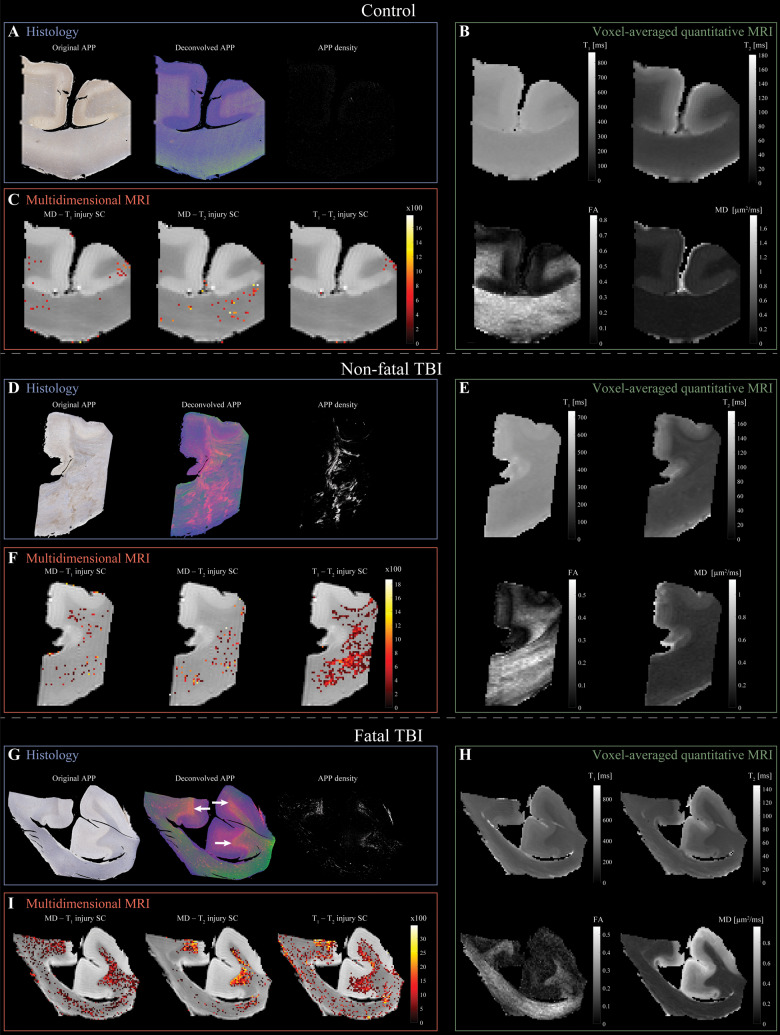
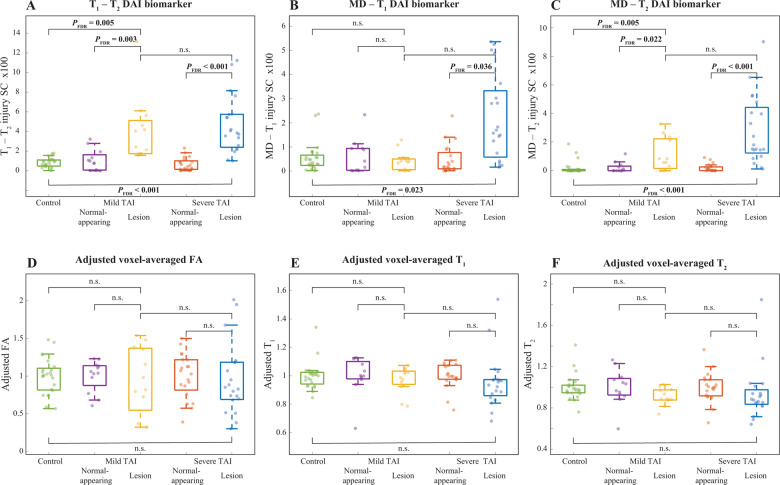
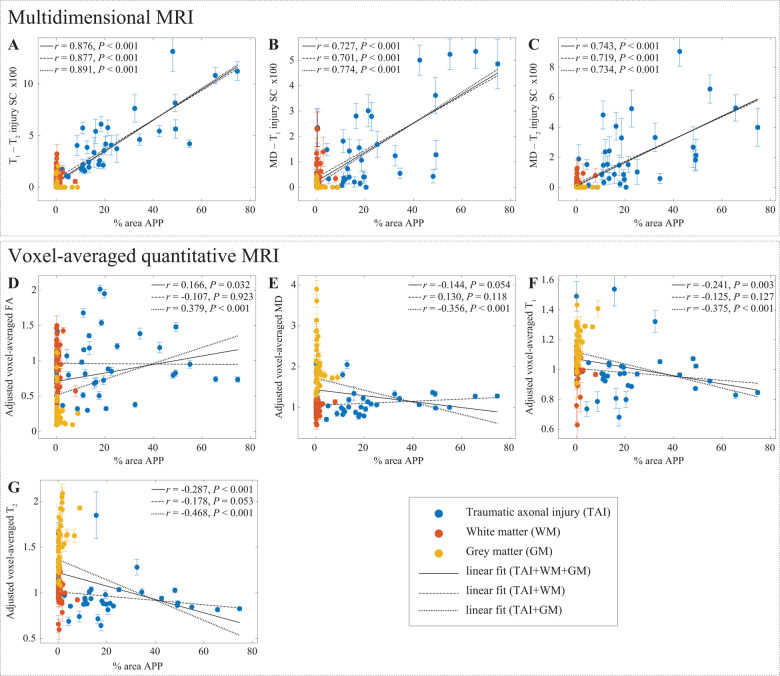
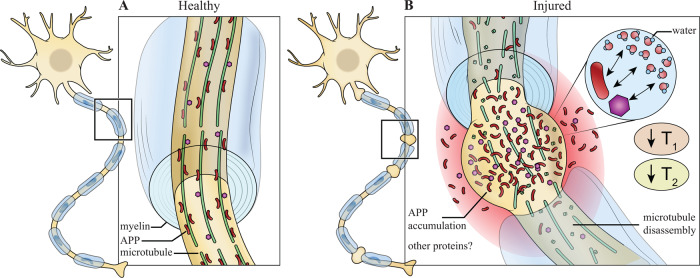
Axonal injury is a major contributor to the clinical symptomatology in patients with traumatic brain injury. Conventional neuroradiological tools, such as CT and MRI, are insensitive to diffuse axonal injury (DAI) caused by trauma. Diffusion tensor MRI parameters may change in DAI lesions; however, the nature of these changes is inconsistent. Multidimensional MRI is an emerging approach that combines T1, T2, and diffusion, and replaces voxel-averaged values with distributions, which allows selective isolation of specific potential abnormal components. By performing a combined post-mortem multidimensional MRI and histopathology study, we aimed to investigate T1-T2-diffusion changes linked to DAI and to define their histopathological correlates. Corpora callosa derived from eight subjects who had sustained traumatic brain injury, and three control brain donors underwent post-mortem ex vivo MRI at 7 T. Multidimensional, diffusion tensor, and quantitative T1 and T2 MRI data were acquired and processed. Following MRI acquisition, slices from the same tissue were tested for amyloid precursor protein (APP) immunoreactivity to define DAI severity. A robust image co-registration method was applied to accurately match MRI-derived parameters and histopathology, after which 12 regions of interest per tissue block were selected based on APP density, but blind to MRI. We identified abnormal multidimensional T1-T2, diffusion-T2, and diffusion-T1 components that are strongly associated with DAI and used them to generate axonal injury images. We found that compared to control white matter, mild and severe DAI lesions contained significantly larger abnormal T1-T2 component (P = 0.005 and P < 0.001, respectively), and significantly larger abnormal diffusion-T2 component (P = 0.005 and P < 0.001, respectively). Furthermore, within patients with traumatic brain injury the multidimensional MRI biomarkers differentiated normal-appearing white matter from mild and severe DAI lesions, with significantly larger abnormal T1-T2 and diffusion-T2 components (P = 0.003 and P < 0.001, respectively, for T1-T2; P = 0.022 and P < 0.001, respectively, for diffusion-T2). Conversely, none of the conventional quantitative MRI parameters were able to differentiate lesions and normal-appearing white matter. Lastly, we found that the abnormal T1-T2, diffusion-T1, and diffusion-T2 components and their axonal damage images were strongly correlated with quantitative APP staining (r = 0.876, P < 0.001; r = 0.727, P < 0.001; and r = 0.743, P < 0.001, respectively), while producing negligible intensities in grey matter and in normal-appearing white matter. These results suggest that multidimensional MRI may provide non-invasive biomarkers for detection of DAI, which is the pathological substrate for neurological disorders ranging from concussion to severe traumatic brain injury.

Keywords: brain injury; diffuse axonal injury; multidimensional MRI; radiological-pathological correlations; traumatic; traumatic axonal injury.


Figures

Figure 1
Figure 1
Histological findings from three representative cases. Case 1 (AF), Case 2 (HM), and Case 4 (O–T). Micrographs from approximately the same regions of (A, H and O) Iba1 (microglia), (B, I and P) GFAP (astrocytes), (C, J and Q) Luxol fast blue (myelin), (D, K and R) MBP (myelin), (E, L and S) haematoxylin and eosin. [F(i), M(i) and T(i)] Original APP images, [F(ii), M(ii) and T(ii)], which are deconvolved to obtain the APP density, in F(iii), M(iii) and T(iii). Scale bar = 200 µm in all micrographs and 5 mm in the whole-mount corpus collosum APP images in G, N and U. Case 1 survived 3 days post TBI and presented reactive microglia (A), astrogliosis (B), no apparent myelin loss (C and D), and TAI APP lesions (F). Case 2 survived 26 days post TBI and presented reactive microglia (H), very sparse astrogliosis (I), no apparent myelin loss (J and K), and TAI APP lesions (M). Case 4 survived 16 h post TBI and did not present any glial reactivity (O and P), no apparent myelin loss (Q and R), but did present TAI APP lesions (T).
Figure 2
Figure 2
Multidimensional spectra of the TAI lesions in representative cases with increasing degree of severity (left to right). (AE) T1-T2, (FJ) MD-T2, and (KO) MD-T1. The preselected T1-T2-MD range, T1 = [91.03, 339.32] ms, T2 = [6.70, 34.85] ms, and MD = [0.004, 0.146] µm2/ms is highlighted as pink rectangles. Below each distribution, a magnification of the highlighted spectral region of interest is shown. The progressive shift towards shorter T1, shorter T2, and slower diffusivity as the severity of the injury increases is evident.
Figure 3
Figure 3
Multidimensional and voxel-averaged MRIs of TAI. (AC) Control brain (Case 10). (A) APP histological images co-registered to MRIs. Deconvolved histological image: red = APP stain. Negligible APP density was detected. (B) Conventional MRI maps of T1, T2, FA and MD do not show visible abnormalities. (C) Multidimensional injury maps overlaid onto proton density images show absent of significant injury. (DF) Non-fatal TBI brain (Case 6). (D) APP histological images co-registered to MRIs show visible TAI lesions in the corpus callosum. (E) Conventional MRI maps of T1, T2, FA and MD do not show visible abnormalities in the corpus callosum. (F) Multidimensional injury maps overlaid onto proton density images show significant injury in white matter (in particular, the T1-T2 injury SC). (GI) Fatal TBI brain (Case 2). (G) APP histological images co-registered to MRIs show TAI lesions in regions of white matter/grey matter interface (white arrows). (H) Conventional MRI maps of T1, T2, FA and MD do not show visible abnormalities in white matter/grey matter interface. (I) Multidimensional injury maps overlaid onto proton density images show substantial injury along the white matter/grey matter interface.
Figure 4
Figure 4
Between-group comparisons of voxel-averaged and multidimensional biomarkers and histopathological measures. Box plots showing between-group differences among control corpus callosum, normal-appearing white matter in mild TAI corpus callosum, mild TAI lesions, normal-appearing white matter in severe TAI corpus callosum, and severe TAI lesions. (A) T1-T2 injury SC; (B) MD-T1 injury SC; (C) MD-T2 injury SC; (D) adjusted voxel-averaged FA; (E) adjusted voxel-averaged T1; and (F) adjusted voxel-averaged T2. All parameters are averaged across their corresponding spatial regions of interest.
Figure 5
Figure 5
APP density. APP density (% area) from 132 tissue regions, consisting of 4 APP-positive regions from each TAI case (total of 32, blue dots), four to six normal-appearing white matter regions from all cases (total of 56, red dots), and four cortical grey matter regions from all cases (total of 44, yellow dots), and the corresponding magnetic resonance parameter correlations. Individual data-points represent the mean region of interest value from each post-mortem tissue sample. Scatterplots of the mean (with 95% confidence interval error bars) % area APP and (A) T1-T2, (B) MD-T1, and (C) MD-T2 injury SCs show positive and significant correlation with APP density. Both T1-T2 and MD-T2 injury SCs demonstrated specificity exclusively towards TAI (all grey matter and normal-appearing white matter had negligible intensities). The conventional MRI metrics (DG) did not result in strong and significant correlations with % area APP.
Figure 6
Figure 6
Proposed explanation of T1 and T2 shortening in TAI lesions. Schematic representation of (A) healthy neuron and (B) traumatized neuron. In healthy neurons, APP and other proteins transported through axons via microtubules by fast axonal transport without reaching detectable levels. In traumatized neurons, microtubules undergo mechanical failure resulting in transport disruption that leads to accumulation of APP and possibility other proteins, which causes local axonal swelling. As known T1 and T2 relaxation enhancers, proteins accumulate and affect the surrounding water by shortening their observed T1 and T2 values.

References

    1. Adams JH, Doyle D, Ford I, Gennarelli TA, Graham DI, Mclellan DR.. Diffuse axonal injury in head injury: definition, diagnosis and grading. Histopathology 1989; 15: 49–59. - PubMed
    1. Adams JH, Graham DI, Murray LS, Scott G.. Diffuse axonal injury due to nonmissile head injury in humans: an analysis of 45 cases. Ann Neurol 1982; 12: 557–63. - PubMed
    1. Adler DH, Wisse LEM, Ittyerah R, Pluta JB, Ding S-L, Xie L, et al.Characterizing the human hippocampus in aging and Alzheimer’s disease using a computational atlas derived from ex vivo MRI and histology. Proc Natl Acad Sci USA 2018; 115: 4252–7. - PMC - PubMed
    1. Arfanakis K, Haughton VM, Carew JD, Rogers BP, Dempsey RJ, Meyerand ME.. Diffusion tensor MR imaging in diffuse axonal injury. AJNR Am J Neuroradiol 2002; 23: 794–802. - PMC - PubMed
    1. Barmpoutis A, Vemuri BC.. A unified framework for estimating diffusion tensors of any order with symmetric positive-definite constraints. In: 2010 IEEE International Symposium on Biomedical Imaging: from Nano to Macro. IEEE; 2010. pp. 1385–1388. - PMC - PubMed

Publication types