

Biomarkers of environmental enteric dysfunction are not consistently associated with linear growth velocity in rural Zimbabwean infants
- PMID: 33740052
- PMCID: PMC8106752
- DOI: 10.1093/ajcn/nqaa416
Biomarkers of environmental enteric dysfunction are not consistently associated with linear growth velocity in rural Zimbabwean infants
Abstract
Background: Child stunting remains a poorly understood, prevalent public health problem. Environmental enteric dysfunction (EED) is hypothesized to be an important underlying cause.
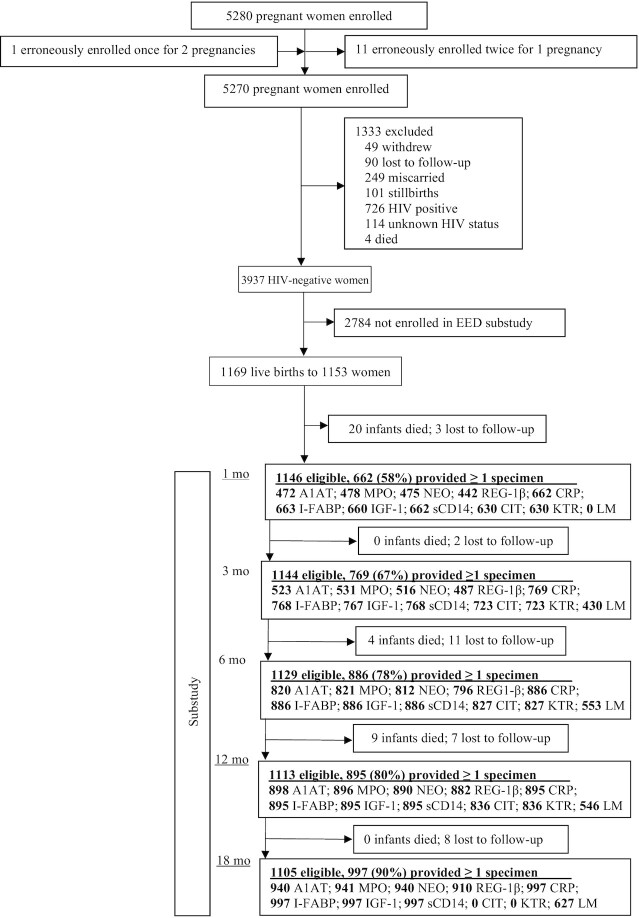
Objectives: Within a subgroup of 1169 children enrolled in the SHINE (Sanitation Hygiene Infant Nutrition Efficacy) trial in rural Zimbabwe, followed longitudinally from birth to 18 mo of age, we evaluated associations between the concentration of 11 EED biomarkers and linear growth velocity.
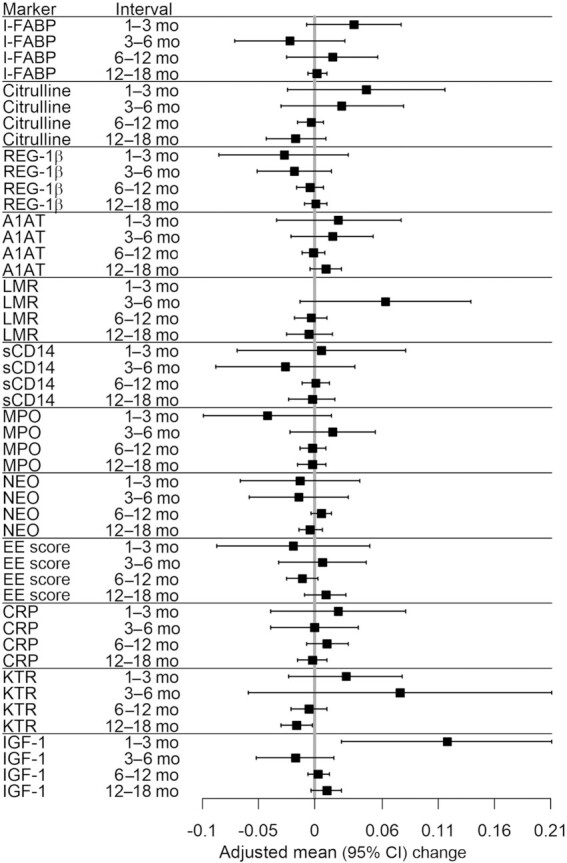
Methods: At infant ages 1, 3, 6, 12, and 18 mo, nurses measured child length and collected stool and blood; the lactulose-mannitol urine test was also conducted at all visits except at 1 mo. Stool neopterin, α-1 antitrypsin, myeloperoxidase, and regenerating gene 1β protein; urinary lactulose and mannitol; and plasma kynurenine, tryptophan, C-reactive protein, insulin-like growth factor-1 (IGF-1), soluble CD14, intestinal fatty acid binding protein, and citrulline were measured. We analyzed the change in relative [∆ length-for-age z score (LAZ)/mo] and absolute (∆ length/mo) growth velocity during 4 age intervals (1-3 mo; 3-6 mo; 6-12 mo; and 12-18 mo) per SD increase in biomarker concentration at the start of each age interval.
Results: In fully adjusted models, we observed only 3 small, statistically significant associations: kynurenine:tryptophan ratio at 12 mo was associated with decreased mean LAZ velocity during the 12-18 mo interval (-0.015 LAZ/mo; 95% CI: -0.029, -0.001 LAZ/mo); mannitol excretion at 6 mo was associated with increased LAZ velocity during the 6-12 mo interval (0.013 LAZ/mo; 95% CI: 0.001, 0.025 LAZ/mo), and plasma IGF-1 at 1 mo was associated with increased LAZ velocity during the 1-3 mo interval (0.118 LAZ/mo; 95% CI: 0.024, 0.211 LAZ/mo). Results for absolute growth velocity were similar, except IGF-1 was also associated with growth during the 12-18 mo interval. We found no other associations between any EED biomarker and linear growth velocity.
Conclusions: None of 11 biomarkers of EED were consistently associated with linear growth among Zimbabwean children.This trial was registered at clinicaltrials.gov as NCT01824940.
Keywords: Zimbabwe; biomarkers; child growth; environmental enteric dysfunction; stunting.
© The Author(s) 2021. Published by Oxford University Press on behalf of the American Society for Nutrition.
Figures
References
-
- UNICEF, World Health Organization, International Bank for Reconstruction and Development/The World Bank. Levels and trends in child malnutrition: key findings of the 2019 edition of the Joint Child Malnutrition Estimates. Geneva: WHO; 2019.
-
- De Onis M, Habicht JP. Anthropometric reference data for international use: recommendations from a World Health Organization Expert Committee. Am J Clin Nutr. 1996;64:650–8. - PubMed
-
- Victora CG, De Onis M, Hallal PC, Blössner M, Shrimpton R. Worldwide timing of growth faltering: revisiting implications for interventions. Pediatrics. 2010;125:e473–e80. - PubMed
-
- Vollmer S, Harttgen K, Subramanyam MA, Finlay J, Klasen S, Subramanian SV. Association between economic growth and early childhood undernutrition: evidence from 121 Demographic and Health Surveys from 36 low-income and middle-income countries. Lancet Glob Health. 2014;2:e225–e34. - PubMed
Publication types
MeSH terms
Substances
Associated data
Grants and funding
LinkOut - more resources
Full Text Sources
Other Literature Sources
Medical
Research Materials
Miscellaneous
