. 2021 Apr 15;184(8):2103-2120.e31.
doi: 10.1016/j.cell.2021.02.045. Epub 2021 Mar 18.

Simultaneous binding of Guidance Cues NET1 and RGM blocks extracellular NEO1 signaling

Affiliations

Simultaneous binding of Guidance Cues NET1 and RGM blocks extracellular NEO1 signaling

Ross A Robinson et al. Cell. .

Abstract

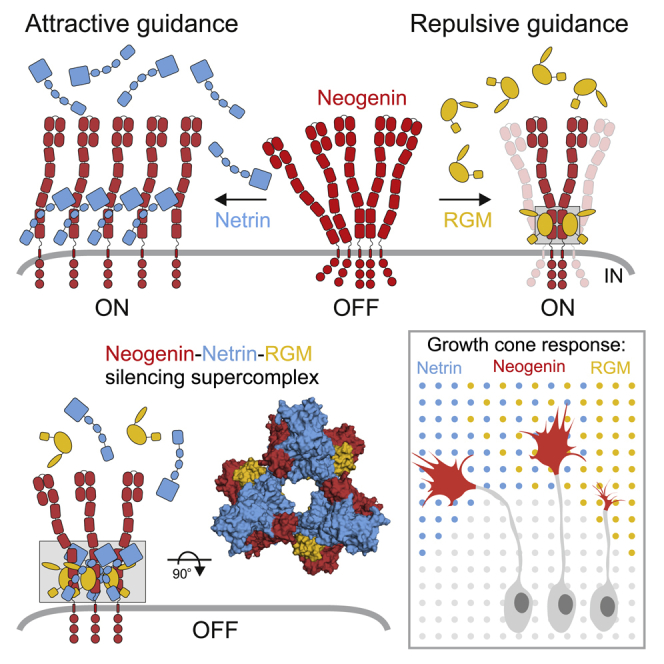
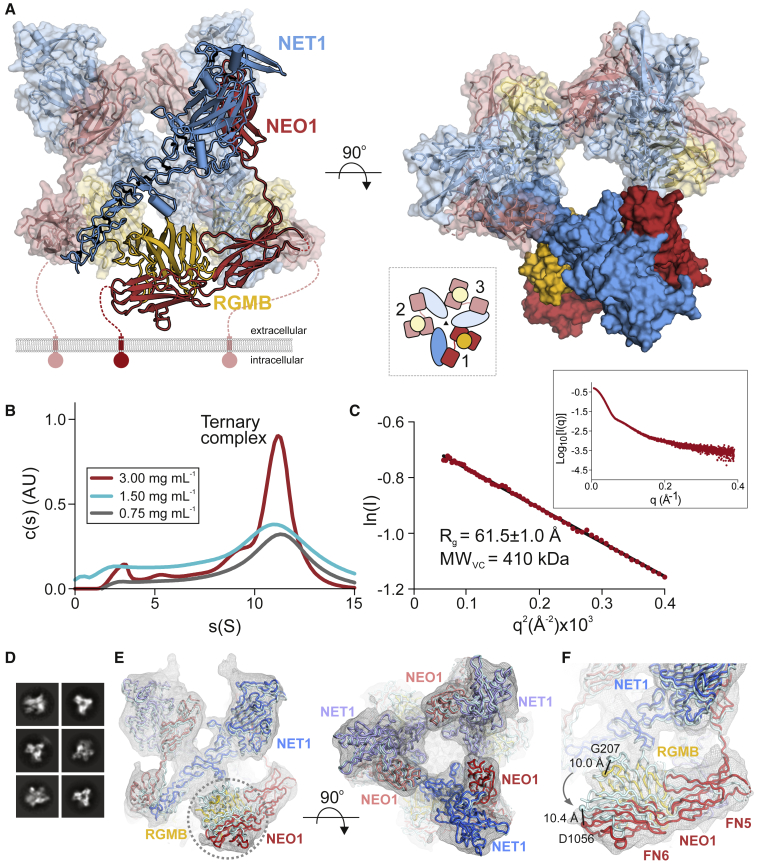
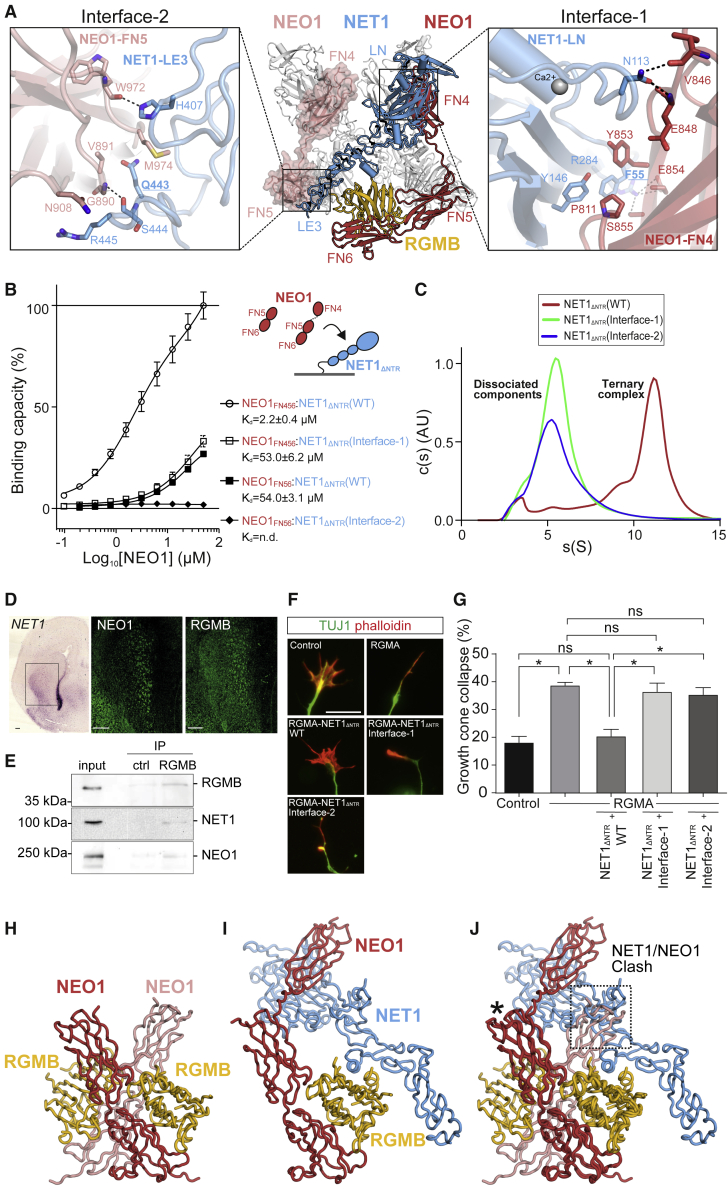
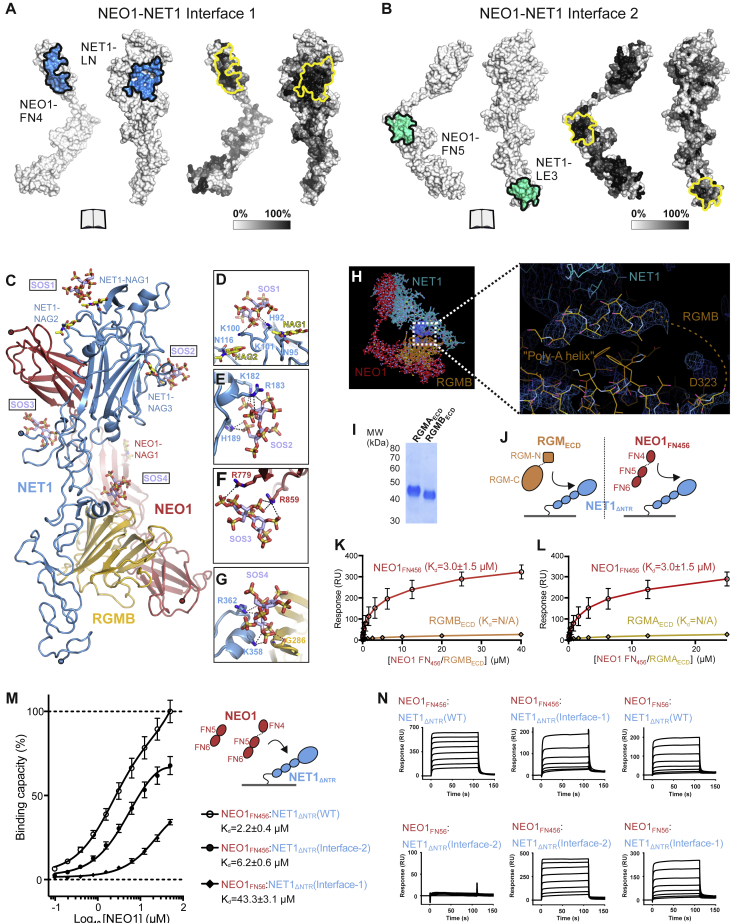
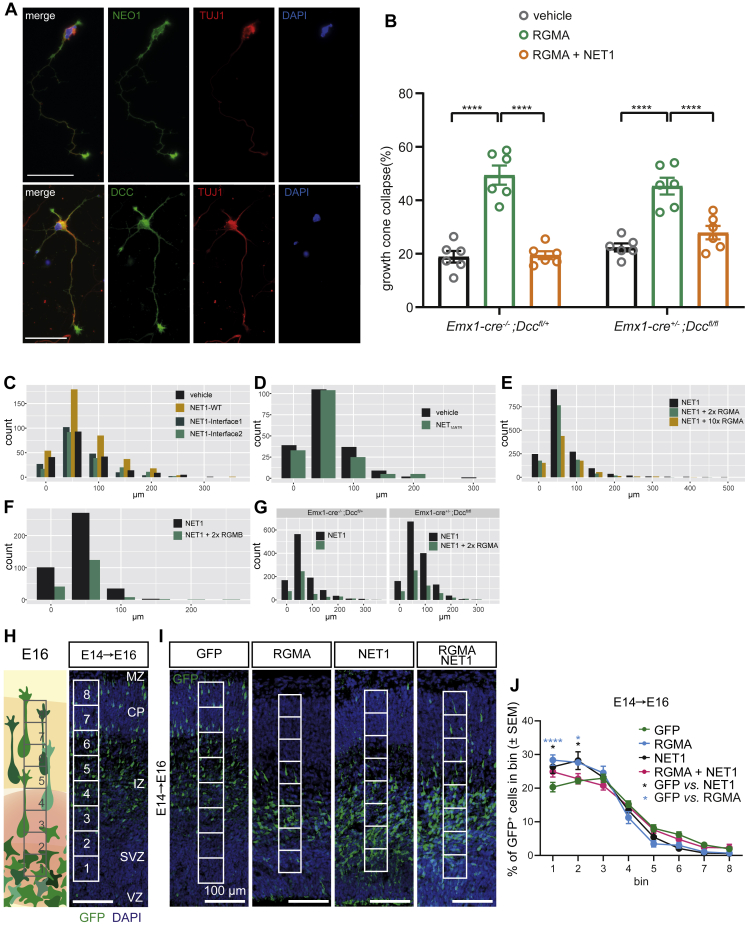
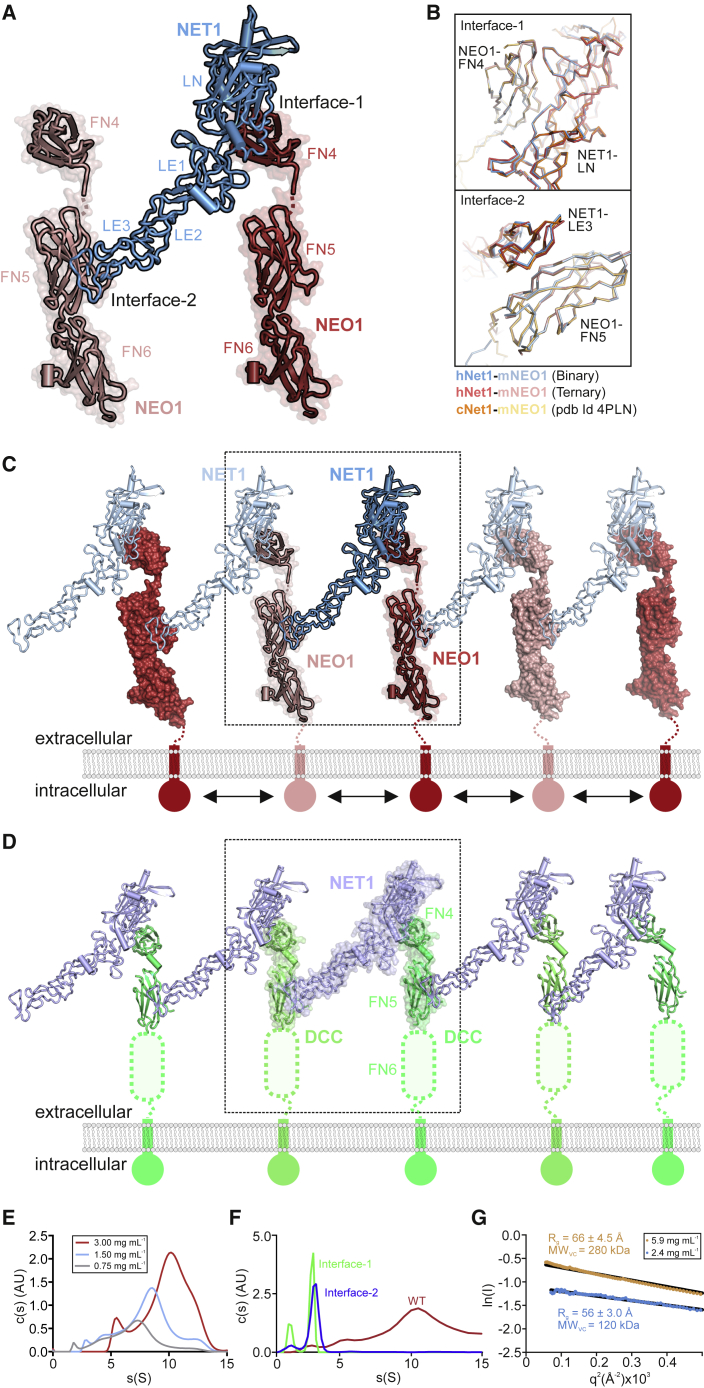
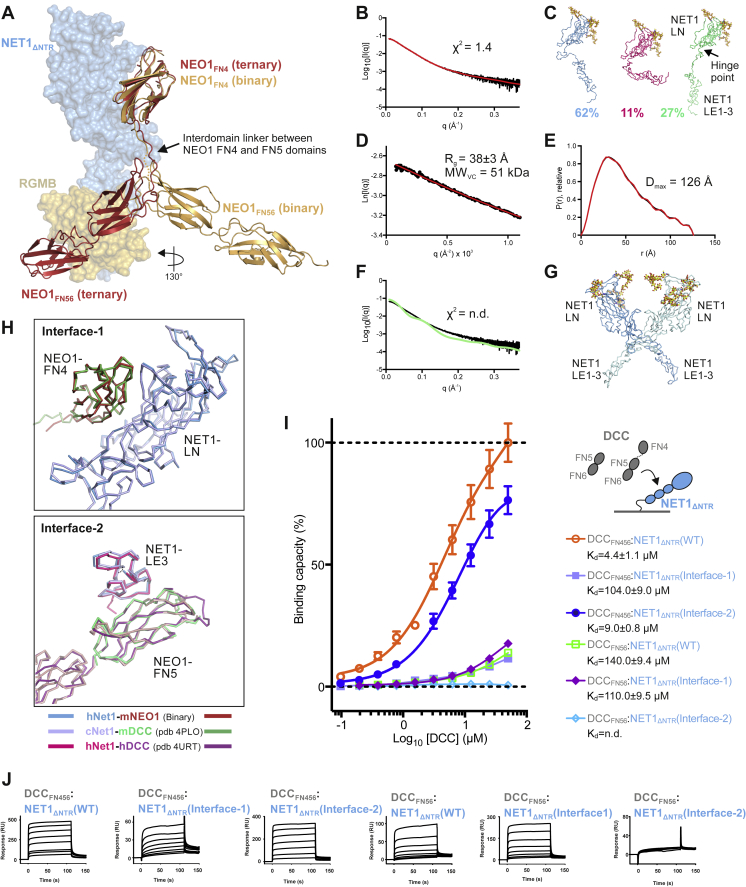
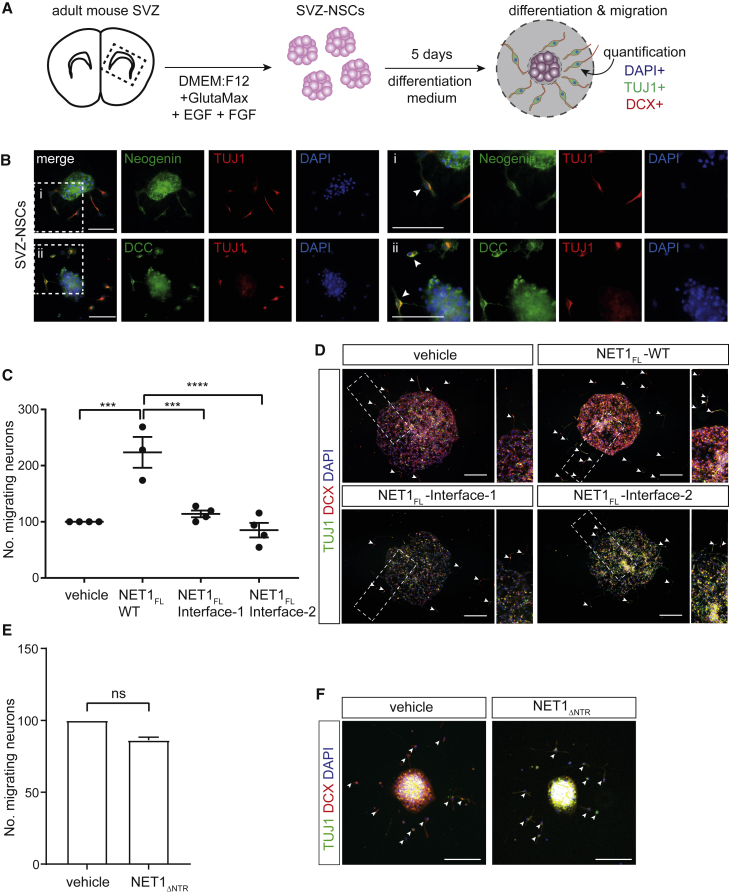
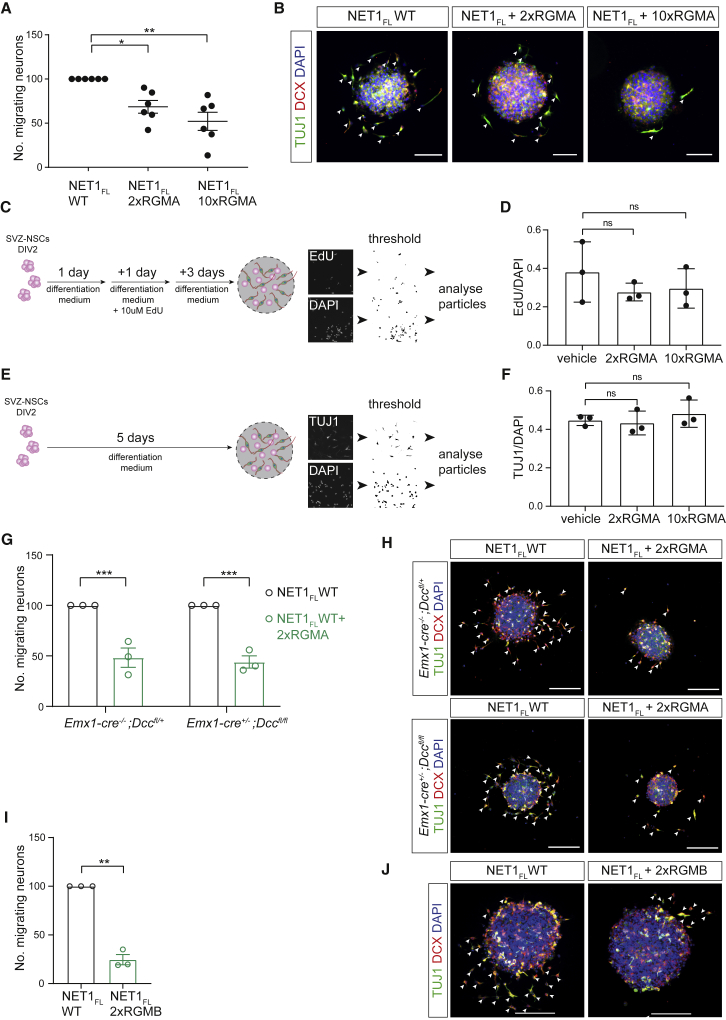
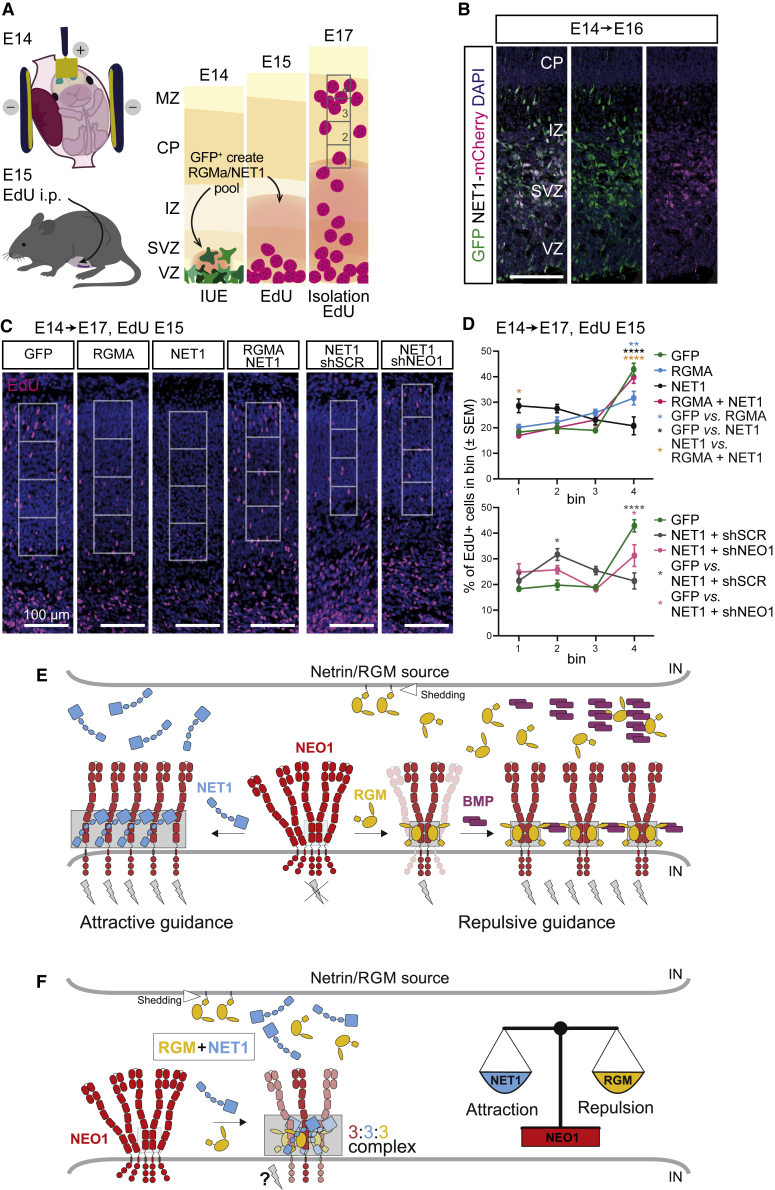
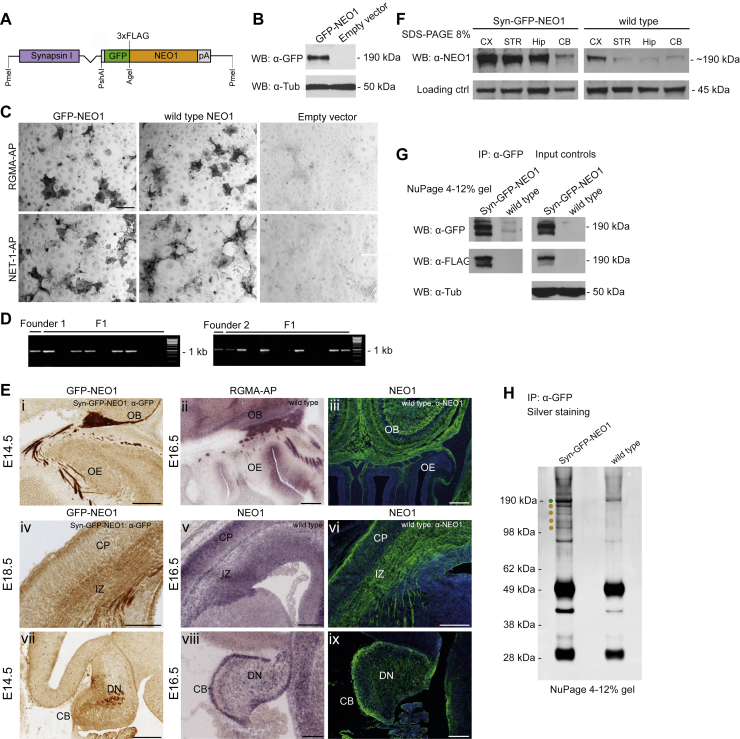
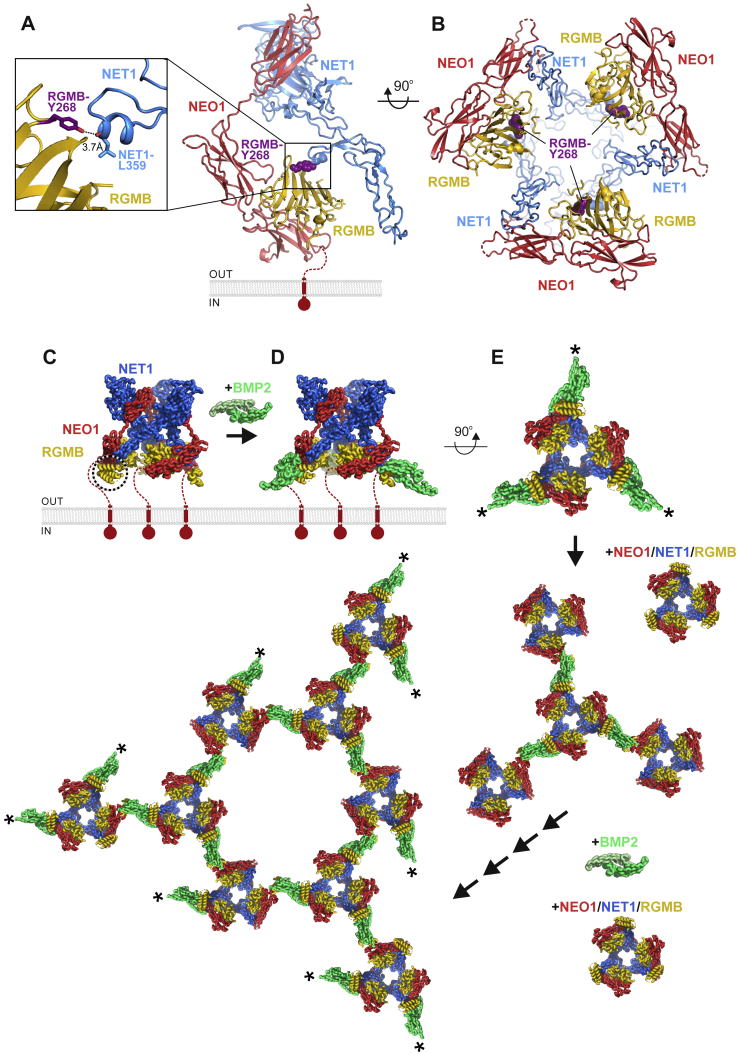
During cell migration or differentiation, cell surface receptors are simultaneously exposed to different ligands. However, it is often unclear how these extracellular signals are integrated. Neogenin (NEO1) acts as an attractive guidance receptor when the Netrin-1 (NET1) ligand binds, but it mediates repulsion via repulsive guidance molecule (RGM) ligands. Here, we show that signal integration occurs through the formation of a ternary NEO1-NET1-RGM complex, which triggers reciprocal silencing of downstream signaling. Our NEO1-NET1-RGM structures reveal a "trimer-of-trimers" super-assembly, which exists in the cell membrane. Super-assembly formation results in inhibition of RGMA-NEO1-mediated growth cone collapse and RGMA- or NET1-NEO1-mediated neuron migration, by preventing formation of signaling-compatible RGM-NEO1 complexes and NET1-induced NEO1 ectodomain clustering. These results illustrate how simultaneous binding of ligands with opposing functions, to a single receptor, does not lead to competition for binding, but to formation of a super-complex that diminishes their functional outputs.

Keywords: Neogenin; Netrin; axon regeneration; cell migration; cell surface receptors; complex structure; morphogen signaling; protein-protein interactions; repulsive guidance molecule; signal transduction.


Conflict of interest statement

Declaration of interests The authors declare no competing interests.

Figures

None
Graphical abstract
Figure S1
Figure S1
Identification of the minimal NEO1-NET1 interaction region, related to Figure 1 (A, B) SPR equilibrium binding experiments of different NET1 and NEO1 constructs. Graphs show a plot of the equilibrium binding response against used NEO1 construct concentrations (left panels: full-length NEO1 ectodomain (eNEO1), right panels: NEO1 FN type III domains 4 to 6 (NEO1FN456). Ligands immobilized on SPR sensor chip: A, full-length NET1; B, NET1ΔNTR. (C) Immunofluorescence staining of FLAG-tagged full-length human DCC (DCCFL) and mouse NEO1 (NEO1FL) overexpressed in COS-7 cells (green). Left panel: bound NET1ΔNTR is stained via a Rho ID4 tag (red); right panel: transfected cells were incubated with buffer only as a negative control and stained as in the left panel. (D) Western blot of COS-7 cells transfected with the indicated plasmids used in C. α-tubulin serves as a loading control. (E, F) Proximity ligation assay (PLA) to test for simultaneous binding of NET1 and RGMB to NEO1. (E) COS-7 cells were transfected with a NEO1-mVenus fusion protein or the corresponding empty vector, and with full-length RGMB (wild type or RGMB-A186R). Transfected cells were incubated with NET1ΔNTR before performing the PLA assay. PLA signals are shown in red and NEO1-mVenus transfected cells in green with nuclei in blue. (F) PLA signals were quantified and values from 3 individual experiments were plotted. A two-tailed, unpaired t test showed the statistical significance as p = 0.0107.
Figure 1
Figure 1
NET1 and RGMB can simultaneously bind NEO1 and form a ternary complex (A) Schematics of NEO1, NET1, and RGMB. SP, signal peptide; TM, transmembrane helix; IG, immunoglobulin-like domain; FN, fibronectin type III domain; CD, cytoplasmic domain; LN, laminin domain; LE, laminin epidermal growth factor-like repeats; LC, netrin (NTR) domain; N-RGM, RGM N-terminal domain identified to bind to BMP ligands (Healey et al., 2015); vWfD, von Willebrand factor D-like domain; GPI, glycosylphosphatidylinositol anchor. (B and C) Proximity ligation assays (PLA) were performed to test for simultaneous binding of NET1 and RGMB to NEO1. (B) Cos-7 cells were either transfected with a NEO1-mVenus fusion protein or empty vector. Cells were incubated with NET1ΔNTR and RGMBECD (wild type or RGMBECD-A186R). NEO1-mVenus positive cells are shown in green, nuclei are stained with DAPI and PLA signals in red. (C) Number of PLA signals per NEO1-mVenus positive cells. Individual values are plotted from 4 independent experiments. Statistical significance was determined using a two-tailed, unpaired t test with p < 0.0001. (D) Ribbon representation of the NEO1-NET1-RGMB protomer observed in the 3.25 Å resolution crystal structure, with NEO1FN456 in red, NET1ΔNTR in blue and RGMBCORE in yellow. A schematic is shown. See also Figure S1.
Figure 2
Figure 2
Structure of the NEO1-NET1-RGMB ternary complex (A) Two 90°-rotated ribbon representations of the NEO1-NET1-RGMB trimer-of-trimers complex. The relative location of the plasma membrane is depicted. The solvent accessible surface is shown in the right panel in addition to the ribbons. The inset shows an outline complex architecture and symmetry. Disordered regions are depicted as dotted lines. Color-coding is as in Figure 1D. (B) Sedimentation velocity AUC experiment of the NEO1FN456-NET1ΔNTR-RGMBECD complex at different concentrations. The major species corresponds to a 3:3:3 complex. (C) Guinier region analysis of the NEO1-NET1-RGMB complex from SEC-SAXS experiment suggests a molecular weight of 410 kDa, corresponding to the 3:3:3 NEO1FN456:NET1ΔNTR:RGMBECD stoichiometry. The inset shows the SAXS intensity plot for the final merged data. (D) Selected 2D class averages used for cryo-EM map reconstruction of the NEO1-NET1-RGMB ternary complex. (E) Ribbon representation of the 3:3:3 NEO1-NET1-RGMB cryo-EM complex. View and coloring as in (A). The crystallographic 3:3:3 NEO1-NET1-RGMB complex fitted into the cryo-EM map as a single rigid body (depicted in light cyan) is shown for comparison. The cryo-EM electron potential (grey mesh) is calculated to 6.0 Å resolution. (F) Close-up view of the NEO1-RGMB interface highlighted in (E). The model of the ternary 3:3:3 complex fits the cryo-EM map better when refined as six rigid bodies (see also STAR Methods). Distances (Å) between selected Cα atoms are indicated. The curved arrow highlights the movement of the NEO1FN56-RGMB segment by up to 10 Å relative to the NEO1FN4-NET1 segment. See also Figures S2 and S3 and Methods S1 and S2.
Figure S2
Figure S2
SEC, MALS and SDS-PAGE analysis of the ternary NEO1-NET1-RGM complexes, related to Figure 2 (A) SEC of the ternary NEO1FN456-NET1ΔNTR-RGMBECD complex. The SEC fraction (elution volume ~9.8-10.1 ml) indicated with a red line was analyzed using MALS (panel B) and cryo-EM. SEC fractions indicated with a blue line (elution volume ~8-12 ml) were analyzed on SDS PAGE (panels C and D). (B) SEC-MALS analysis of the NEO1FN456-NET1ΔNTR-RGMBECD complex. Calculated MW of 1:1:1 mol:mol:mol complex is 144.4 kDa (129.35 kDa of protein plus 15.06 kDa of seven Asn-linked Man9GIcNAc2 glycans). Calculated MW of 3:3:3 complex is 433.24 kDa. The NEO1-NET1-RGMB complex eluted as two peaks with corresponding MW of 422.7 kDa and 117.9 kDa (indicated with red lines). (C, D) SDS PAGE analysis of SEC fractions. Fractions were heated (100 °C, 10 minutes) in the presence or absence of 2-mercaptoethanol (panels C and D, respectively). (E) NEO1FN456 co-elutes with extracellular domain of RGMA (RGMAECD) on SEC, suggesting that NEO1 and RGMA form a binary complex. SEC fractions were analyzed using SDS-PAGE under non-reducing and reducing conditions. Under reducing conditions, the RGMAECD dissociates into two fragments (labelled N-term. and C-term.) due to an autocatalytic cleavage mechanism. SEC fractions containing the binary NEO1-RGMA complex used to form the ternary NEO1-NET1-RGMA complex are indicated. SEC running buffer: 150 mM NaCl, 10 mM HEPES pH 7.5, 2 mM CaCl2, 0.02% NaN3 (flow rate 0.3 ml/min; Superose 6 Increase 10/300 GL column; 21 °C). (F) SDS-PAGE analysis (non-reducing and reducing conditions) of NET1 and NEO1-RGMA used to assemble the ternary NEO1-NET1-RGMA complex for SEC-MALS analysis. Traces corresponding to absorbance at 280 nm, light scattering and molecular masses derived from SEC-MALS are shown in black, blue and red, respectively. Calculated molecular masses based on protein amino acid sequences: NET1ΔNTR, 49.2 kDa plus 3 Asn-linked glycans, 5.6 kDa; FN domains 4–6 of NEO1, 39.2 kDa plus 2 Asn-linked glycans, 3.8 kDa; RGMA, 42.2 kDa plus 3 Asn-linked glycans, 5.6 kDa. Thus, calculated mass of the glycosylated NEO1-NET1-RGMA ternary 3:3:3 complex is 437.0 kDa. The ternary complex dissociated on SEC-MALS as suggested by a major peak corresponding to 79.97 kDa. However, an additional peak corresponding to 444.4 kDa, which is consistent with the NET1:NEO1:RGMA 3:3:3 mol:mol:mol complex, was also observed. (G) FN domains 4–6 of NEO1 co-elute with the full-length extracellular domain of RGMC (RGMCECD) on SEC, suggesting that NEO1 and RGMC form a binary complex. SEC fractions were analyzed using SDS-PAGE under non-reducing and reducing conditions. Under reducing conditions, a fraction of RGMCECD dissociates into two fragments (labelled N-term. and C-term.) as observed for RGMAECD (E). (H) SEC and SDS-PAGE analysis of the ternary NET1–NEO1–RGMC complex. The ternary NEO1-NET1-RGMC complex elutes as two major peaks (12.5 and 13.9 ml peaks) at lower elution volume compared to the binary NEO1-RGMC complex (16.3 ml, G) or NET1 in isolation, suggesting that the NEO1-NET1-RGMC ternary complex forms in solution. SEC running buffer: 150 mM NaCl, 10 mM HEPES pH 7.5, 2 mM CaCl2, 1 mM sucrose octasulfate, 0.02% NaN3 (flow rate 0.3 ml/min; Superose 6 Increase 10/300 GL column; 21 °C). SEC input was 0.6 ml of the ternary complex at 2.6 mg/ml.
Figure 3
Figure 3
Interface analysis of the ternary NEO1-NET1-RGMB super-complex (A) Close-up views of the observed NET1-NEO1 interfaces (right: interface 1, left: interface 2). Residues are displayed in stick representation and labelled according to domain color-coding. A Ca2+ ion bound to NET1 LN (grey sphere) and hydrogen bonds (dashed black lines) are displayed. Mutated residues are in bold and underlined. (B) SPR equilibrium binding curves for the NET1-NEO1 interaction. A schematic of the experiment and the calculated Kd values are shown. (C) AUC analysis of the NEO1FN456-NET1ΔNTR-RGMBECD complex, using NET1ΔNTR WT and mutants. Both NET1 interface-1 and -2 mutants abolish the 3:3:3 stoichiometry of the NEO1-NET1-RGMB super-complex. (D) Overlapping expression of NET1 RNA (in situ hybridization), and NEO1 and RGMB protein (immunohistochemistry) in consecutive coronal sections of E16 mouse striatum. Boxed area is shown at higher magnification for NEO1 and RGMB. Scale bar, 100 μm. (E) RGMB immunoprecipitation (IP) from adult mouse cortex was followed by immunoblotting. Input samples (lane 1), IP using control non-specific IgGs (cntrl) (lane 2), and anti-RGMB IP (lane 3). NEO1 and NET1 co-IP with RGMB from adult mouse brain lysates. (F and G) Functional analysis of the effect of NET1 on RGMA-mediated growth cone collapse. (F) Representative examples of growth cones from mouse P0 cortical neurons. Neurons were stained with the microtubule marker Tuj1 (green) and F-actin marker phalloidin (red). Scale bar, 10 μm. (G) Quantification of growth cone collapse. Growth cones were treated with control or RGMA alone and in combination with different NET1 variants. Proportions of collapsed growth cones relative to control are displayed. n = 3 experiments, one-way ANOVA followed by Tukey’s multiple comparison test. p < 0.05. Data are shown as means ± SEM. (H–J) Comparison of binary NEO1-RGM (PDB ID 4BQ6 [Bell et al., 2013]) and the ternary NEO1-NET1-RGMB complexes shown as ribbons. The ternary NEO1-NET1-RGMB protomer complex architecture (I) clashes with the NEO1-RGM dimer-of-dimers signaling conformation (H) when superimposed on NEO1 (marked with an asterisk) (J). See also Figure S3, Figure S4, Figure S5.
Figure S3
Figure S3
Structural and functional analysis of the ternary NEO1-NET1-RGM complex, related to Figures 2, 3, and 4 (A, B) Surface representations of NET1-NEO1 interactions The NEO1-NET1 Interface-1, formed by the NEO1 FN4-NET1 LN interaction is shown in A. Interface residues are mapped onto solvent accessible surfaces displayed in open-book view (blue, left panel in A). Residue conservation calculated with ConSurf server (https://consurf.tau.ac.il/) is mapped onto the protein surfaces according to a white-to-black gradient (right panel in A). Surfaces are highlighted with a line. The NEO1-NET1 Interface-2, formed by the NEO1 FN5-NET1 LE3 interaction is shown in B. Presentation is as in A. (C-G) Sugar sites identified on the ternary NEO1-NET1-RGMB crystal structure. (C) Ribbon presentation of the NEO1-NET1-RGMB protomer with the 4 N-linked N-acetylglucosamine (NAG; yellow) and 4 sucrose-octasulfate (SOS; light blue) molecules depicted as sticks. (D-G), Close-up views of the 4 SOS-binding sites with residue side chains within hydrogen-bonding distance shown in stick representation and labelled. Potential hydrogen bonds are displayed as dashed black lines. (H) NET1-RGM interaction analysis in the ternary trimer-of-trimers complex determined by X-ray crystallography. Overall 1:1:1 trimer architecture is displayed on the left. The close-up shows the interface between NET1 and RGMB. The sigmaA-weighted 2Fo-Fc map of the final refinement in AUTOBUSTER is displayed and contoured at 1σ. RGMB is ordered to residue D323 and a dashed line denotes disordered residues linking to a putative helical stretch of Ala residues, which were built into this density as the sequence could not be unambiguously assigned. (I) Non-reducing SDS-PAGE of purified RGMAECD and RGMBECD used as analytes for SPR injections. (J) Schematics of the experimental SPR set up. NET1ΔNTR (ligand) was attached to a streptavidin-coupled sensor chip via a biotinylated C-terminal Avi-tag. RGMECD and NEO1FN456 (analytes) were injected to probe interactions. (K, L), SPR equilibrium binding curves for NET1ΔNTR binding experiments with NEO1FN456 (K and L; same measurement for comparison), RGMBECD (K) and RGMAECD (L). (M, N) SPR equilibrium binding curves for the NEO1-NET1 interaction. A schematic of the experiment (NEO1: red, NET1: blue) and the calculated Kd values are shown. The maximal response for the wild type NEO1FN456:NET1ΔNTR interaction represents 100% binding. Sensorgrams for NEO1:NET1ΔNTR interactions, corresponding to Figure 3B and Figure S6J are shown in (B).
Figure S4
Figure S4
Expression of NEO1, NET1, RGMA and RGMB, related to Figure 3 (A) Protein expression of NET1, NEO1 and RGMB in the adult mouse brain detected by western blot analysis. (B) Sagittal overview of the adult mouse brain. (C)In situ hybridization for NEO1, NET1, RGMA and RGMB in sagittal sections from the adult mouse brain (obtained from the Allen Brain Atlas (brain-map.org)). Regions of interest are indicated in boxed regions in B: (i) anterodorsal nucleus of the thalamus, (ii) cerebellum and (iii) olfactory nucleus. Images are obtained from the Allen Brain Atlas. Olf bulb, olfactory bulb; ctx ant, anterior half of the cortex; ctx post, posterior half of the cortex; hip, hippocampus; Th, thalamus; AON, anterior olfactory nucleus; ACB, nucleus accumbens. Scale bar = 500 μm. (D) scRNAseq dataset analysis (Mizrak et al 2019) for co-expression of RGMA/B, NEO1 and NET1 in adult V-SVZ. Single-cell expression levels of cluster-specific marker genes in adult ventricular-subventricular zone (V-SVZ) cells plotted on UMAP embedding (Cldn10, Mog, Ccnd2, Tmem119, Meg3, Egfl7, Ccdc153, Vtn, Pdgfra, Fyn). In addition, expression levels of Neogenin (NEO1), Netrin-1 (NET1), RGMA and RGMB are shown. Clusters marked as [clusterID]. OPC, oligodendrocyte precursor; COP, committed oligodendrocyte precursors.
Figure S5
Figure S5
Silencing of RGMA-mediated growth cone collapse by NET1 is DCC-independent, related to Figures 3, 5, 6, and 7 (A) Immunocytochemistry of NEO1, deleted in colorectal cancer (DCC) and TUJ1 in P0 mouse cortical neurons at DIV3. Scale bar = 50 μm. (B) Mean ± S.E.M. of the percentage of collapsed growth cones following exposure to RGMA or RGMA + NET1FL in cortical neurons from Emx1-Cre-/-;Dccfl/+ (control) or Emx1-Cre+/-;Dccfl/fl (knockout) mice. Emx1-Cre-/-;Dccfl/+ (mean ± S.E.M.): vehicle = 18.83 ± 2.17, RGMA = 49.40 ± 3.61, RGMA + NET1FL = 19.47 ± 1.47. Emx1-Cre+/-;Dccfl/fl (mean ± S.E.M.): vehicle = 22.35 ± 1.48, RGMA = 45.28 ± 3.15, RGMA + NET1FL = 27.88 ± 2.53. n = 6 experiments, two-way ANOVA with Tukey’s multiple comparisons test, ∗∗∗ p < 0.0001. (C-G) Quantification of migration distance in SVZ-NSC assays and analysis of GFP+ neurons following IUE. Migration distance (per 50 μm bin) of SVZ-neuroblasts related to (C) Figures 5C and 5D, (D) Figures 5E and 5F, (E) Figures 6A and 6B, (F) Figures 6I and 6J, and (G) Figures 6G and 6H. (H-J) Cortical migration of GFP+ electroporated neurons. (H) At E14 embryos were in utero electroporated (IUE) with expression vectors for GFP, RGMA, and/or NET1 (each condition has GFP). Embryos were harvested two days later at E16. Migration distance from the VZ to the MZ was measured per bin (1-8) (i.e. the number of GFP+ cells per bin/total GFP+ cells). (I-J) Electroporation of RGMA or NET1 caused an increase in the number of GFP+ in bins near the VZ, indicating reduced migration towards the MZ. Simultaneous overexpression of RGMA and NET1 in part rescued this inhibitory effect. The reduction in the number of GFP+ cells in more upper layers was visible in the images but did not reach statistical significance due to the low numbers of these more superficially located neurons. One-way ANOVA followed by Sidaks multiple comparisons test: RGMA vs. GFP bin 1 p < 0.0001, RGMA vs. GFP bin 2 p = 0.0305, NET1 vs. GFP bin 1 p = 0.379, NET1 vs. GFP bin 2 p = 0.362. GFP: n = 6 animals, RGMA: n = 6 animals, NET1: n = 4 animals, NET1+RGMA: n = 5 animals. Marker: 100 μm. VZ, ventricular zone; SVZ, subventricular zone; IZ, intermediate zone; CP, cortical plate; MZ, marginal zone.
Figure 4
Figure 4
Structure and functional characterization of the binary NET1-NEO1 complex (A) Cartoon representation of the binary NET1ΔNTR-NEO1FN456 complex. NET1ΔNTR contacts two NEO1FN456 chains, using the same interfaces observed in the “trimer-of-trimers” NEO1-NET1-RGMB super-complex structure. Interfaces 1 and 2 are labelled. (B) Comparison of NET1-NEO1 interfaces (interface 1: top panel, interface 2: lower panel). Superpositions were calculated using NEO1 FN4 (top panel, “interface-1”) and FN5 (lower panel, “interface-2”) as template. The binary (light blue/blue) and ternary (light red/red) NET1ΔNTR-NEO1FN456 complexes from this study and the previously determined NET1ΔNTR-NEO1FN45 complex (orange/light orange, PDB Id. 4PLN [Xu et al., 2014]) are shown as ribbons. (C) Overall arrangement of the NET1-NEO1 complex, which forms a continuous array in the crystal. The relative orientation of the plasma membrane is depicted. The region marked corresponds to the protomer in (A). (D) Cartoon representation of the previously published DCCFN45-NET1ΔNTR complex (PDB Id 4PLO [Xu et al., 2014]) shown in the same orientation as the NET1ΔNTR-NEO1FN456 complex from C. Both complexes form a similar, continuous array in the crystal. The DCC FN6 domain missing in the DCC-NET1 complex is depicted schematically. (E and F) Sedimentation velocity AUC experiments of the binary NET1ΔNTR-NEO1FN456 complex. The complex reveals concentration-dependent increase of oligomerization, characterized by a shift to higher s(S) values (E). This can be inhibited by NET1 interface-1 and -2 mutants that both result in a reduction of the apparent molecular weight (F), corresponding to a 1:1 NET1-NEO1 complex stoichiometry. (G) Guinier region analysis of SEC-SAXS data collected for the NEO1FN456:NET1ΔNTR complex at 2.4 mg mL−1 (blue) and 5.9 mg mL−1 (yellow) gives larger Rg and MWVC values at higher concentrations. See also Figure S6.
Figure S6
Figure S6
Structural and functional analysis of binary NET1-NEO1 and NET1-DCC complexes, related to Figure 4 (A) Flexibility between NEO1 FN4 and FN5-6 domains. Superposition of the binary NEO1-NET1 (gold) and NEO1-NET1-RGMB (red) complex structures. Superimpositions were calculated using NET1 as template. NET1 and RGMB are colored as in Figure 1A. Due to flexibility in the interdomain linker region between FN domains 4 and 5, the position of the NEO1 FN5-6 region varies greatly in relation to the FN4 domain. NEO1FN56 forms a structural unit. (B, C) Fit of an ensemble of NET1ΔNTR models to experimental scattering data. Experimental (black) and calculated (red) scattering curves are displayed to a maximal momentum transfer of q = 0.37 Å-1, with fit value (χ2) displayed (B). A distribution of NET1ΔNTR models as calculated by MultiFOXS and MES is displayed, color-coded as per model (C) (D) Guinier region for experimental and calculated scattering, with radius of gyration (Rg) calculated from experimental data annotated. (E) Normalized pair-distance distribution function, with the derived maximum intra-particle diameter (Dmax). This suggests that NET1ΔNTR behaves as a monomer in solution. (F-G) Fitting between experimental (black) and calculated (green) scattering data (F) from a proposed X-linked NET1ΔNTR dimer (G) (PDB ID. 4PLN). (H) Comparison of the binary NEO1-NET1 and DCC-NET1 interfaces (‘Interface-1’: left panel, ‘Interface-2’: right panel). Superpositions were calculated using NEO1 FN4 (for ‘Interface-1’) and FN5 (for ‘Interface-2’) as template, respectively. The binary NEO1FN456-NET1ΔNTR complex from this study and the previously determined DCCFN45-NET1ΔNTR (PDB ID 4PLO) and DCCFN56-NET1ΔNTR (PDB ID 4URT) complexes are shown as ribbons. (I, J) SPR binding analysis to characterize the NET1 interaction with the NEO1 paralogue DCC. SPR equilibrium binding curves for the DCC-NET1 interaction (B) and corresponding sensorgrams (C) are presented. A schematic of the experiment (DCC: grey, NET1: blue) and the calculated Kd values are shown. The maximal response for the wild type DCCFN456:NET1ΔNTR interaction represents 100% binding.
Figure 5
Figure 5
NET1 mediates SVZ-neuroblast migration via NEO1 (A) Schematic of the neurosphere migration assay. Neurospheres were generated from the adult mouse subventricular zone (SVZ) subsequently plated on control or NET1 proteins. (B) Immunocytochemisty for NEO1, DCC, and TUJ1 (to label SVZ-neuroblasts) in DIV5 SVZ-NSC cultures. SVZ-neurospheres (NSCs) and neuroblasts (arrowheads) express NEO1 and DCC. Boxed areas are shown at higher magnification on the right. Scale bar, 50 μm. (C and D) Analysis of migrating neurons from SVZ-NSCs grown on full-length NET1 constructs. Ablation of either NET1-NEO1 interface-1 or -2 interactions causes loss of NET1-mediated neuron migration. Mean ± SEM of the relative number of Tuj1/DCX positive migrating neurons per neurosphere: vehicle = 100.00, NET1FL-WT = 223.25 ± 27.51, NET1FL-Interface-1 = 114.20 ± 6.07, NET1FL-Interface-2 = 85.06 ± 13.02, n = 3-4 experiments. Brown-Forsythe to test significant difference between SDs (p < 0.05): ns. One-way ANOVA followed by Tukey’s multiple comparisons test: vehicle vs. NET1FL-WT P = 0.0003, NET1FL-WT vs. NET1FL-Interface-1 P = 0.0007, NET1FL vs. NET1FL-Interface-2 p < 0.0001. Representative samples of mouse SVZ-NSCs grown on coverslips coated with indicated proteins are shown in (D). Boxed areas are shown at higher magnification on the right of each panel. Migrating neurons (white arrowheads) were identified via labelling with the microtubule markers TUJ1 (green) and DCX (red) as well as the nuclear marker DAPI (blue). (E and F) Analysis and representative samples of migrating SVZ neuroblasts (white arrowheads) grown on NET1ΔNTR. NET1 lacking the C-terminal NTR domain fails to increase neuron migration. Mean ± S.E.M of the relative number of TUJ1/DCX-positive migrating neurons per neurosphere: control (vehicle) = 100.00, NET1ΔNTR = 86.18 ± 2.215, n = 2 individual experiments. Unpaired t test: p = 0.0247. See also Figure S5.
Figure 6
Figure 6
RGMs inhibit NET1-mediated SVZ-neuroblast migration (A and B) RGMA inhibits SVZ-neuroblast migration mediated by NET1-NEO1 signaling in a concentration-dependent manner. Analysis (A) and representative samples (B) of SVZ-NSCs grown on full-length NET1 and different concentrations of mouse RGMA. 2x RGMA = 1.2 μg/ml, 10x RGMA = 6.0 μg/ml. Mean ± SEM of the relative number of TUJ1/DCX-positive migrating neurons per neurosphere: NET1FL-WT = 100.00, NET1FL-WT + 2x RGMA = 68.52 ± 7.17, NET1FL-WT + 10x RGMA = 52.04 ± 10.27, n = 6 experiments. Bartlett’s test to test significant difference between SDs (p < 0.05): p <0.0001. Kruskal-Wallis followed by Dunn’s multiple comparisons test: NET1FL-WT vs. NET1FL-WT + 2x RGMA p = 0.0289, NET1FL-WT vs. NET1FL-WT + 10x RGMA p = 0.0023. Arrowheads indicate neuroblasts. Scale bar, 50 μm. (CF) RGMA does not influence SVZ neurosphere proliferation and differentiation. (C) Overview of the proliferation assay. (D) Ratio of EdU-positive over DAPI-positive cells. Mean ± SD vehicle = 0.381 ± 0.091, 2x RGMA = 0.277 ± 0.027, 10x RGMA = 0.296 ± 0.059. n = 3 experiments, one-way ANOVA with Tukey’s multiple comparisons test, vehicle vs. 2x RGMA p = 0.5238, vehicle vs. 10x RGMA p = 0.6369. (E) Overview of the differentiation assay. (F) Ratio of TUJ1-positive over DAPI-positive cells. Mean ± SD vehicle = 0.447 ± 0.016, 2x RGMA = 0.433 ± 0.036, 10x RGMA = 0.482 ± 0.041. n = 3 experiments, one-way ANOVA with Tukey’s multiple comparisons test, vehicle vs. 2x RGMA p = 0.9389, vehicle vs. 10x RGMa p = 0.6897. (G and H) Silencing of NET1-mediated neuronal migration in neurospheres by RGMA is DCC-independent. Analysis (G) and representative samples (H) of SVZ-NSCs derived from Emx1wt/wt;Dcclox/wt (control) and Emx1cre/wt;Dcclox/lox (DCC knockout) mice grown on full-length NET1 with and without addition of 2x RGMA. Mean ± SEM of the relative number of TUJ1/DCX-positive migrating neurons per neurosphere: Emx1wt/wt;Dcclox/wt mean ± SEM NET1FL = 100.00, NET1FL + 2x RGMA = 48.263 ± 9.535, Emx1cre/wt;Dcclox/lox; mean ± SEM NET1FL = 100.00, NET1FL + 2x RGMA = 43.977 ± 6.099. n = 3 experiments, two-way ANOVA with Sidak’s multiple comparisons test, NET1FL vs NET1FL + 2x RGMA p < 0.0004 for both genotypes. Arrowheads indicate neuroblasts. Scale bar, 50 μm. (I and J) RGMB inhibits neuroblast migration mediated by NET1. Analysis (I) and representative samples (J) of SVZ-NSC cultures grown on full-length NET1 with and without addition of 2x RGMB. Mean ± SEM of the relative number of TUJ1/DCX-positive migrating neurons per neurosphere: NET1FL = 100.00, NET1FL + 2x RGMB = 24.55 ± 5.253. n = 3 experiments, paired two-tailed t test p = 0.0048. Scale bar, 50 μm. See also Fig. S5.
Figure 7
Figure 7
In vivo inhibitory interactions between RGMA and NET1 (AD) In vivo inhibitory effects of RGMA and NET1 on embryonic mouse cortical neuron migration are silenced in the presence of both cues. (A) Graphical overview of the in utero electroporation (IUE) experiment. Embryos were electroporated at E14 with a GFP construct in addition to (combinations of) different expression vectors (RGMA, NET1, or shRNA). At E15, pregnant mothers were injected with EdU to label the population of cortical neurons born at E15. At E17, migration of Edu+ neurons was quantified in the cortical plate (CP) in 4 different bins (1–4). (B) Immunohistochemistry showing NET1 expression in the deep part of the E16 cortex following co-electroporation of GFP and NET1-mCherry. (C) EdU staining on E17 coronal sections of the mouse cortex to visualize migrating neurons born at E15, one day after IUE of the VZ at E14. Scale bar, 100 μm. (D) Quantification of Edu+ neuron migration using the bins shown in (C). Upper graph, IUE of RGMA and NET1 constructs reduced migration of EdU+ neurons, an effect silenced when RGMA and NET1 are co-electroporated. Lower graph, reduced migration of neurons following NET1 electroporation is partly rescued by knockdown of NEO1 (shNEO1). One-way ANOVA followed by Sidak’s multiple comparisons: RGMA vs. GFP bin 4 p = 0.0094, NET1 vs. GFP bin 4 p < 0.0001, NET1 vs. RGMA+NET1 bin 1 p = 0.0231, NET1 vs. RGMA+NET1 bin 4 p < 0.0001, NET1+shSCR vs. GFP bin 2 = 0.0366, NET1-shSCR vs. GFP bin 4 p < 0.0001, NET1+shNEO1 vs. GFP bin 4 p = 0.0108. GFP, RGMA, and NET1+ RGMA: n = 6 embryos, NET1 and NET1+shSCR: n = 4 embryos, NET1+shNEO1: n = 7 embryos. i.p., intraperitoneally; E, embryonic day; VZ, ventricular zone; SVZ, subventricular zone; IZ, intermediate zone; MZ, marginal zone. (E and F) Model for NEO1 signaling via the NET1 and RGM guidance molecules in trans. (E) NET1-induced clustering of NEO1 at the cell surface via Interface-1 and -2 interactions can lead to NEO1 intracellular interactions, inducing e.g. attractive guidance and outgrowth (left panel). In contrast, RGM binding to potentially pre-clustered NEO1 results in NEO1 dimerization in a signaling compatible conformation (Bell et al., 2013) (right panel). This architecture leads to activation of downstream signaling resulting in repulsive guidance (e.g., growth cone collapse), a process that can be potentiated by BMP morphogens (Healey et al., 2015). (F) Combined binding of RGM and NET1 to NEO1 results in “trimer-of-trimers” super-complexes, preventing cell surface clustering, thereby inhibiting both RGM-mediated repulsive but also NET1-mediated attractive signaling. See also Figure S5, Figure S7, Figure S8.
Figure S7
Figure S7
Generation of neuron-specific NEO1 transgenic mice and in vivo proteomics analysis of NEO1-interacting proteins in brain lysates, related to Figure 7 (A) Schematic representation of the Syn-GFP-NEO1 fusion DNA fragment containing N-terminally GFP- and 3xFLAG-tagged mouse NEO1 cDNA cloned downstream of the neuron-specific synapsin-I promoter. pA: SV40 late polyadenylation signal. (B) Anti-GFP immunoblotting shows expression of GFP-NEO1 in lysate of HEK293 cells transfected with pcDNA3.1-CMV-GFP-NEO1. (C) RGMA-AP and Netrin (NET)-1-AP binding to COS-7 cells transfected with pcDNA3.1-CMV-GFP-NEO1 or wild type NEO1 (pCMVXL-6- NEO1). Empty vector (pcDNA3.1)-transfected COS-7 cells do not bind RGMA-AP or NET1-AP. (D)Syn-GFP-NEO1 founders 1 and 2, and transgenic offspring (F1) identified by PCR. Scale bar in C and D = 50 μm. (E) GFP-NEO1 expression was compared to endogenous NEO1 expression, using anti-GFP (i, iv and vii) and anti- NEO1 (iii, vi and xi) immunostaining, NEO1 in situ hybridization (v and viii) and RGMA-AP section binding (ii) on E14.5 sagittal (i, ii, vii-ix) and E18.5 coronal (iii-vi) brain sections of Syn-GFP-NEO1 (i, iv, vii) and wild type mice (ii, iii, v, vi, viii, ix). Anti-GFP immunostaining is visualized with DAB. Sections iii, vi and ix are counterstained in blue with fluorescent Nissl. (i) GFP-NEO1 expression in the olfactory epithelium (OE) and olfactory sensory neuron (OSN) projections to the olfactory bulb (OB) in Syn-GFP-NEO1 mice. (ii, iii) Endogenous NEO1 expression in the OE and OSN projections to the OB revealed by RGMA-AP section binding (ii) and anti-NEO1 immunostaining (iii). (iv-vi) Expression of GFP-NEO1 (iv) and endogenous NEO1 (v, vi) in the cortical plate (CP) and cortical projections in the intermediate zone (IZ). (vii-ix) Expression of GFP-NEO1 (vii) and endogenous NEO1 (viii, ix) in the deep nuclei (DN) and axonal projections of the cerebellum (CB). Markers i-ix: 200 μm. (F) Anti-NEO1 immunoblotting to detect NEO1 expression in lysates of dissected cortex (CX), striatum (STR), hippocampus (Hip) and cerebellum (CB) of E18.5 Syn-GFP-NEO1 mice or wild type littermate controls. Anti-NEO1 immunoblotting on brain lysates of Syn-GFP-NEO1 mice shows GFP-NEO1 and endogenous NEO1 protein. (G) Immunoblotting using anti-GFP and anti-FLAG antibodies shows GFP-NEO protein in an anti-GFP in vivo pull down experiment on brain lysates of perinatal Syn-GFP-NEO mice. (H) Silver staining of an anti-GFP experiment on brain lysates of perinatal Syn-GFP-NEO1 mice. (H) Silver staining of an anti-GFP in vivo pull down on brain lysates of perinatal Syn-GFP-NEO1 mice shows GFP-NEO1 protein (green dot) and putative NEO1-interacting proteins (orange dots).
Figure S8
Figure S8
Structural analysis of RGM interactors and consequences for the ternary NEO1-NET1-RGM complex, related to Figures 3 and 7. (A-C) Model for BMP2-dependent clustering of the ternary 3:3:3 NEO1-NET1-RGM complex. (A) Ribbon presentation of the ternary NEO1-NET1-RGM complex, with modelled RGMB N-terminal domain based on the full-length RGMB structure (PDB ID. 4UI2). One of the three RGMB N-terminal domains essential for BMP binding is marked with a dotted circle. (B) The ternary complex containing full-length RGMB harbors three distinct binding sites for the disulfide linked BMP dimer (green) (here shown for BMP2). (C) Further addition of the ternary NEO1-NET1-RGM complex and the dimeric BMP2 morphogen can lead to clustering and a continuous arrangement in with RGMB bridges the dimer of BMP2 and the ternary complex. Asterisks mark the “free” RGMB-binding sites on BMP2. (D, E) The RGMB VLK phosphorylation site mapped onto the ternary NEO1-NET1-RGM complex structure. (D) Ribbon representation of the NEO1-NET1-RGMB protomer structure (color coded as in Figure 1). RGMB tyrosine 268 (Y268) that was previously shown to be phosphorylated by VLK is colored in purple and highlighted. (E) Ribbon representation of the NEO1-NET1-RGMB trimer-of-trimers complex. RGMB-Y268 is facing the inside of the ternary complex, and is likely shielded for VLK access.

Similar articles

Cited by

References

    1. Afonine P.V., Poon B.K., Read R.J., Sobolev O.V., Terwilliger T.C., Urzhumtsev A., Adams P.D. Real-space refinement in PHENIX for cryo-EM and crystallography. Acta Crystallogr. D Struct. Biol. 2018;74:531–544. - PMC - PubMed
    1. Agirre J., Davies G., Wilson K., Cowtan K. Carbohydrate anomalies in the PDB. Nat. Chem. Biol. 2015;11:303. - PubMed
    1. Agirre J., Iglesias-Fernández J., Rovira C., Davies G.J., Wilson K.S., Cowtan K.D. Privateer: software for the conformational validation of carbohydrate structures. Nat. Struct. Mol. Biol. 2015;22:833–834. - PubMed
    1. Ahmed G., Shinmyo Y., Ohta K., Islam S.M., Hossain M., Naser I.B., Riyadh M.A., Su Y., Zhang S., Tessier-Lavigne M., Tanaka H. Draxin inhibits axonal outgrowth through the netrin receptor DCC. J. Neurosci. 2011;31:14018–14023. - PMC - PubMed
    1. Alam M.S. Proximity Ligation Assay (PLA) Curr. Protoc. Immunol. 2018;123:e58. - PMC - PubMed

Publication types

MeSH terms