. 2021 May 10;39(5):678-693.e11.
doi: 10.1016/j.ccell.2021.02.016. Epub 2021 Mar 18.

Cancer cells escape autophagy inhibition via NRF2-induced macropinocytosis

Affiliations

Cancer cells escape autophagy inhibition via NRF2-induced macropinocytosis

Hua Su et al. Cancer Cell. .

Abstract

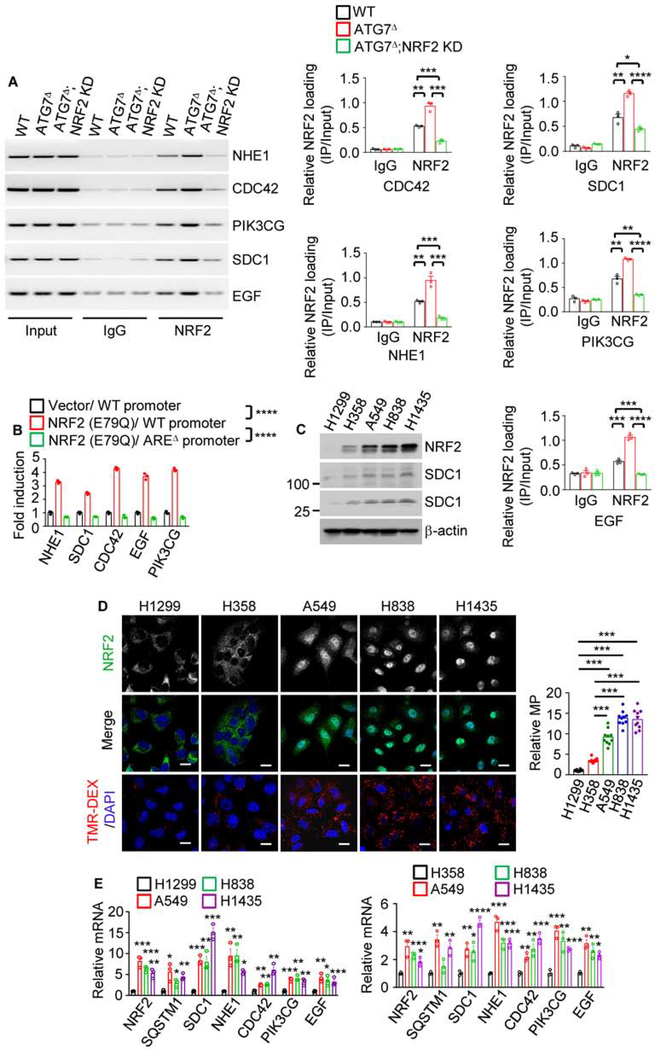
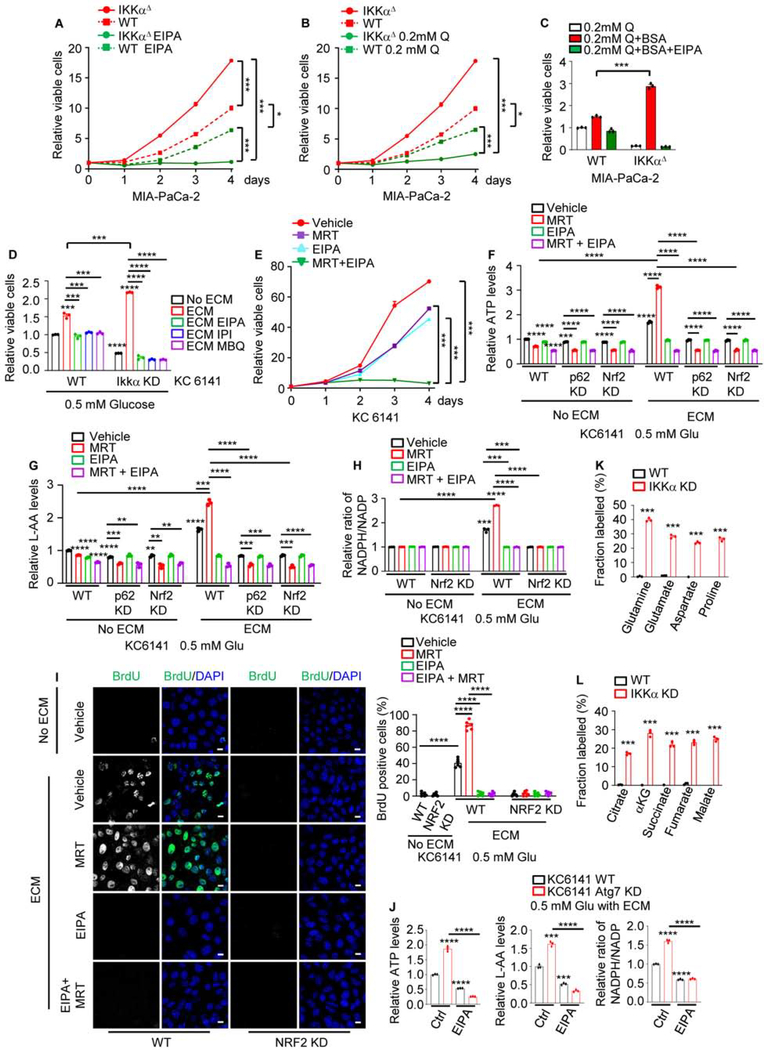
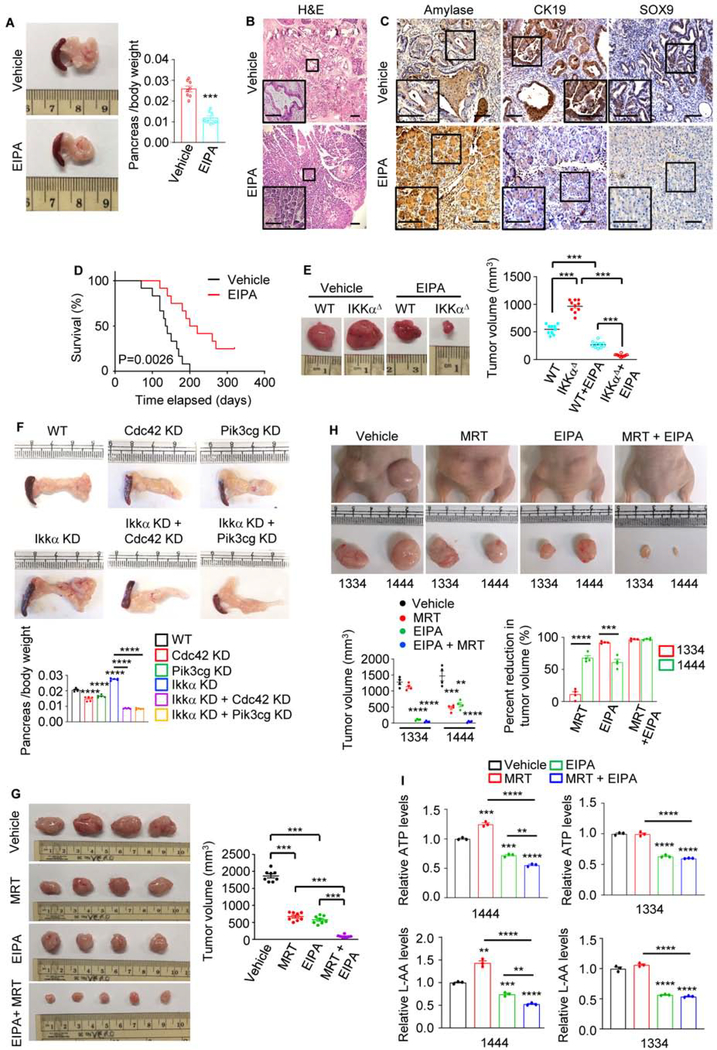
Many cancers, including pancreatic ductal adenocarcinoma (PDAC), depend on autophagy-mediated scavenging and recycling of intracellular macromolecules, suggesting that autophagy blockade should cause tumor starvation and regression. However, until now autophagy-inhibiting monotherapies have not demonstrated potent anti-cancer activity. We now show that autophagy blockade prompts established PDAC to upregulate and utilize an alternative nutrient procurement pathway: macropinocytosis (MP) that allows tumor cells to extract nutrients from extracellular sources and use them for energy generation. The autophagy to MP switch, which may be evolutionarily conserved and not cancer cell restricted, depends on activation of transcription factor NRF2 by the autophagy adaptor p62/SQSTM1. NRF2 activation by oncogenic mutations, hypoxia, and oxidative stress also results in MP upregulation. Inhibition of MP in autophagy-compromised PDAC elicits dramatic metabolic decline and regression of transplanted and autochthonous tumors, suggesting the therapeutic promise of combining autophagy and MP inhibitors in the clinic.

Keywords: NRF2; RAS-driven cancer; autophagy; macropinocytosis; p62/SQSTM1.


Conflict of interest statement

Declaration of interests M.K. is the founder and scientific advisory board member of Elgia Therapeutics and of the scientific advisory board of the Joint Center for Life Sciences, and receives research support from Merck, Janssen, and Gossamer. H.S. and M.K. are authors/inventors of patent titled (Combination therapy for cancer), (PCT/US2021/013203), and (2021) (patent is pending approval).

Figures

Figure 1.
Figure 1.. IKKα Promotes Autophagosome-Lysosome Fusion by Bridging LC3 and STX17
(A) Co-immunoprecipitation (IP) of CFP-SNAP29 and endogenous VAMP8 with Flag-STX17 from controlled and starved (for 2 hrs.) MIA PaCa-2 cells. (B) Co-IP of IKKα-Flag with GFP-LC3 from controlled and starved MIA PaCa-2 cells. (C) LC3 and STX17 co-localization in parental (WT) and IKKα KD MIA PaCa-2 cells incubated in starvation medium for 2 hrs. The right-hand panels show higher magnifications of the areas marked by squares. Quantification is shown to the right. (D) Co-IP of Flag-STX17 with GFP-LC3 in above cells. (E) Co-IP of LC3 and STX17 with endogenous IKKα from control and starved ΜιΑ PaCa-2 cells. (F) Co-IP of endogenous STX17 and transiently expressed Flag-tagged WT and LIR-mutated IKKα variants with GFP-LC3. (G) Immunoblot (IB) analysis of human PDAC cell lines with high and low IKKα expression. (H) LC3 puncta in IKKα high and low PDAC cells. Quantification is on the right. (I) LC3 puncta in COLO 357/FG cells incubated in normal or starvation medium for 2 hrs +/− chloroquine (CQ). Quantification is on the right. Results in (C), (H) and (I) are mean ± SEM (n=30). Scale bar, 10 μm. Statistical significance was determined by 2-tailed t-test. ***p < 0.001, ****p < 0.0001. See also Figures S1 and S2.
Figure 2.
Figure 2.. IKKα Deficiency Upregulates MP
(A) qRT-PCR analysis of MP-related mRNAs in pancreatic epithelial cells (PEC) from 8-week-old (wo) mice of indicated genotypes. Mean ± SEM (n=4 mice). (B) Representative images and quantification of MP in TMR-dextran (TMR-DEX: red) injected pancreatic tissue from 8-wo mice of indicated genotypes. PEC or carcinoma cells are marked by E-cadherin staining (green). Quantification is on the right. Scale bar, 10 μm. Mean ± SEM (n=4 mice). (C) qRT-PCR analysis of MP-related mRNAs in PEC from 12-month-old (mo) KrasG12D and 2-mo KrasG12D;IkkαΔPEC mice. Mean ± SEM (n=3 mice). (D) H&E staining and representative images of TMR-DEX uptake and in pancreata of above mice. Quantification is on the right. Scale bar, 20 μm. Mean ± SEM (n=3 mice). (E) MP visualization and quantification using TMR-DEX in parental and IKKαΔ MIA PaCa-2/1444 cells +/− 75 μM EIPA. Scale bar, 10 μm. Mean ± SEM (n=10). (F) qRT-PCR analysis of MP-related mRNAs in WT and IKKαΔ MIA PaCa-2 cells. Mean ± SEM (n=6). (G) IB analysis of MP-related proteins in PEC isolated from indicated mice. (H) Images of SDC1 and NHE1 localization in pancreata of above mice. PanIN and PDAC cells are marked with a cytokeratin 18 (CK18, red) or E-cadherin (red) antibodies. Scale bar, 20 μm. (I) DQ-BSA fluorescence in WT and IKKαΔ MIA PaCa-2 cells co-incubated with DQ-BSA and TMR-DEX and fixed after 30 min (t=0) or after a 1 hr chase (t=1). The DQ-BSA signal reflects albumin degradation. Insets show higher magnifications of marked areas. Scale bar, 20 μm. Statistical significance in (A)-(F) was determined by a 2-tailed t-test. *p < 0.05, **p < 0.01, ***p < 0.001, **** p < 0.0001.
Figure 3.
Figure 3.. The Autophagy-to-MP Switch Requires p62-Mediated NRF2 Activation
(A) Macropinosomes in WT and ATG7Δ MIA PaCa-2 cells imaged with TMR-DEX. Scale bar, 10 μm. (B) IB analysis of MP-related proteins in WT, ATG7Δ and IKKαΔ MIA PaCa-2 cells. (C) Autophagosomes and macropinosomes in MIA PaCa-2 cells treated +/− MRT68921. Scale bar, 10 μm. Relative macropinocytic uptake was quantitated (on the right), mean ± SEM (n=7). Autophagosome puncta per cell were measured, mean ± SEM (n=30). (D) Macropinosomes in IKKαΔ and IKKαΔ;p62Δ (DKO) MIA PaCa-2 cells. Scale bar, 10 μm. (E) IB analysis of above cells +/− exogenous p62 or NRF2 transfection. (F) Macropinosome imaging and quantification in IKKαΔ and IKKαΔ;NRF2 KD MIA PaCa-2 cells. Scale bar, 10 μm. Mean ± SEM (n=10). (G) IB analysis of WT, IKKαΔ and IKKαΔ;NRF2 KD MIA PaCa-2 cells +/− exogenous NRF2. (H) IB analysis of MP-related proteins in PEC isolated from the indicated mouse strains (n=2–3). (I) MP visualization and quantification in pancreata of indicated mice. Scale bar, 20 μm. Mean ± SEM (n=4 mice). (J) Imaging of macropinosomes and IB analysis of indicated proteins in WT and IKKαΔ MIA PaCa-2 cells +/− KRAS KD and +/− NRF2(E79Q)-Myc. Scale bar, 10 μm. (K) Imaging of macropinosomes and IB analysis of indicated proteins in WT and NRF2(E79Q)-Myc-overexpressing (OE) BxPC3 cells treated +/− trametinib (100 nM). Scale bar, 10 μm. (L) Imaging of macropinosomes and IB analysis of indicated proteins in WT and NRF2(E79Q)-Myc-OE MIA PaCa-2 cells treated +/− p110γ inhibitor IPI549 (600 nM). Scale bar, 10 μm. Relative macropinocytic uptake was quantitated (on the right), mean ± SEM (n=6). Statistical significance in (C), (F), (I) and (L) was determined by a 2-tailed t-test. ***p < 0.001, ****p < 0.0001. See also Figures S3 and S4.
Figure 4.
Figure 4.. MP is Upregulated in NRF2high Human PDAC
(A) Representative immunohistochemical (IHC) analysis of human PDAC tissues. The areas marked by the squares were further magnified. Scale bars, 25 μm. (B) Representative IHC of non-tumor (NT) and tumor (T) areas in IKKαhigh (patient #5) and IKKαlow (patient #6) human PDAC specimens. Marked areas were examined under higher magnification. Scale bars, 25 μm. (C) Imaging and quantification (on the bottom) of LC3 puncta and LC3-LAMP1 co-localization in above specimens. Mean ± SEM (n=10 patients). Statistical significance was determined by a 2-tailed t-test; ***p < 0.001. Scale bars, 10 μm (D) Representative images and MP quantification (on the right) in TMR-DEX injected fresh surgical specimens from patients #5 (IKKαhigh;NRF2low tumor) and #6 (IKKαlow;NRF2high tumor). PEC or carcinoma cells are marked by E-cadherin staining. Scale bar, 20 μm. Mean ± SEM (n=10). ****p < 0.0001. See also Figure S5.
Figure 5.
Figure 5.. NRF2 Transcriptionally Controls MP
(A) ChIP assays probing NRF2 recruitment to the NHE1, CDC42, PIK3CG, SDC1, and EGF promoters in WT, ATG7Δ and ATG7Δ;NRF2 KD MIA PaCa-2 cells. The image shows PCR-amplified promoter DNA fragments containing NRF2 binding sites (AREs). Quantitation is on the right. (B) Activation of reporters controlled by WT and AREΔ promoter regions of above genes. pGL3-WT or AREΔ promoters fused to a luciferase reporter were co-transfected into MIA PaCa-2 cells +/− NRF2 expression vector and pRL-TK control reporter. The figure shows relative fold-activation by NRF2. (C) IB analysis of NRF2 and SDC1 in lung cancer cell lines. (D) Macropinosome and NRF2 imaging in human lung cancer cell lines. Quantitation is on the right. Scale bar, 10 μm. Relative macropinocytic uptake, mean ± SEM (n=10). (E) qRT-PCR analysis of MP-related mRNAs in above cells. Results in (A), (B) and (E) are mean ± SEM (n=3 independent experiments). Statistical significance in (A), (B), (D) or (E) was determined by a 2-tailed t-test. *p < 0.05, **p < 0.01, ***p < 0.001, **** p < 0.0001. See also Figure S6.
Figure 6.
Figure 6.. Effect of MP and Autophagy Inhibition on PDAC Cell Growth and TCA Metabolism
(A, B) WT and IKKαΔ MIA PaCa-2 cells were cultured in complete medium +/− the NHE1 inhibitor EIPA (10.5 μM) (A) or medium containing sub-physiological glutamine (0.2 mM Q) (B). Total viable cells were measured with a CCK-8 assay on the indicated days. Data are presented relative to day 0. (C) WT and IKKαΔ MIA PaCa-2 cells were grown in the presence of 0.2 mM Q, +/− albumin supplementation +/− EIPA. Total viable cells were measured after 3 days and data are presented relative to the WT 0.2 mM Q value. (D) WT and IKKα KD 6141 cells were grown on plates +/− extracellular matrix (ECM) in the presence of 0.5 mM glucose (Glu) +/− EIPA, the p110γ inhibitor IPI549 (IPI, 600 nM) or the CDC42 inhibitor MBQ-167 (MBQ, 500 nM). Total viable cells were measured after 3 days and data are presented relative to the WT without ECM. (E) KC6141 cells were incubated with vehicle, the ULK1/2 inhibitor MRT68921 (MRT), EIPA or MRT + EIPA and total viable cells were measured and presented as in (A). (F) KC6141 cells were grown on plates +/− ECM coating in the presence of 0.5 mM Glu +/− EIPA, MRT or EIPA + MRT for 24 hrs. Total cellular ATP was measured and data were normalized to cell number and presented relative to untreated WT cells grown without ECM. (G) Total L-amino acids (AA) in KC6141 cells that were cultured and treated as above. Data were normalized and presented as above. (H) NADPH and NADP were measured in KC6141 cells cultured and treated as above. Data were normalized to cell number and are presented as NADPH to NADP ratio relative to the value of untreated WT cells grown without ECM. (I) BrdU visualization and quantification in KC6141 cells grown on plates +/− ECM coating in the presence of 0.5 mM Glu and 0.5 mg/ml BrdU for 24 hrs. Scale bar, 10 μm. Mean ± SEM (n=6 fields). (J) KC6141 cells were grown on ECM-coated plates in the presence of 0.5 mM Glu +/− EIPA for 24 hrs. Total cellular ATP, L-AA and NADPH to NADP ratio were measured and presented as in (F), (G) and (H), respectively. (K, L) Fractional labeling (mole percent enrichment) of intracellular AA (K) and TCA cycle intermediates (L) in WT and IKKα-KD KC6141 cells cultured for 24 hrs in 0.5 mM Glu medium on ECM deposited by fibroblasts that were cultured with U-13C-glutamine for 6 days. Results in (A)-(H) and (J) (n=3 independent experiments), (K) and (L) (n=3 per condition) are mean ± SEM. Statistical significance was determined by a 2-tailed t-test. *p < 0.05, **p < 0.01, ***p < 0.001, ****p < 0.0001. See also Figure S7.
Figure 7.
Figure 7.. MP Inhibition in Autophagy-Compromised PDAC Induces Tumor Regression
(A) Gross pancreatic morphology and weight in 8-wo KrasG12D;IkkαΔPECmice treated with vehicle or 10 mg/kg EIPA for 1 month. Mean ± SEM (n=8). (B) H&E-stained pancreatic sections from above mice evaluated at the end of above experiment. Scale bars, 100 μm. (C) IHC analysis of pancreatic sections from above mice. Scale bars, 100 μm. (D) Kaplan-Meier survival curves of KrasG12D;IkkαΔPEC mice treated with vehicle or 10 mg/kg EIPA (n=12). Significance was analyzed by log rank test. (E) Representative images and sizes of MIA PaCa-2 tumors s.c. grown in nude mice treated with EIPA or vehicle. Mean ± SEM (n=10 mice). Note that IKKαΔ tumors removed from EIPA-treated mice mainly consisted of the Matrigel Plus plug. (F) Gross pancreatic morphology and weight in C57BL/6 mice orthotopically transplanted with the indicated KC6141 cells. Mean ± SEM (n=5 mice). (G) Representative images and sizes of dissected KC6141 tumors s.c. grown in C57BL/6 mice treated with vehicle, MRT, EIPA, or MRT + EIPA for 21 days. Mean ± SEM (n=8 mice). (H) Representative images and sizes of human PDAC 1334 and 1444 tumors s.c. grown in nude mice treated as in (G) for 15 days. Mean ± SEM (n=4 mice). (I) Total ATP and L-AA concentrations in above tumor cells. Data are presented relative to ATP and L-AA concentrations in tumor cells isolated from vehicle-treated mice. Statistical significance in (A) or (E-I) was determined by a 2-tailed t-test. **p < 0.01, ***p < 0.001, ****p < 0.0001. See also Figures S8 and S9.

Comment in

Similar articles

Cited by

References

    1. Amaravadi RK, Kimmelman AC, Debnath J, 2019. Targeting Autophagy in Cancer: Recent Advances and Future Directions. Cancer Discov. 9, 1167–1181. - PMC - PubMed
    1. An H, Harper JW, 2018. Systematic analysis of ribophagy in human cells reveals bystander flux during selective autophagy. Nat. Cell Biol 20, 135–143. - PMC - PubMed
    1. Bloomfield G, Kay RR, 2016. Uses and abuses of macropinocytosis. J. Cell Sci 129, 2697–2705. - PubMed
    1. Browning DJ, 2014. Pharmacology of Chloroquine and Hydroxychloroquine, in: Hydroxychloroquine and Chloroquine Retinopathy. Springer; New York, New York, NY, pp. 35–63.
    1. Bryant KL, Der CJ, 2019. Blocking autophagy to starve pancreatic cancer. Nat. Rev. Mol. Cell Biol 20, 265. - PubMed

Publication types

MeSH terms