. 2021 Jun 21:519:110619.
doi: 10.1016/j.jtbi.2021.110619. Epub 2021 Mar 16.

Dynamics of adrenergic signaling in cardiac myocytes and implications for pharmacological treatment

Affiliations

Dynamics of adrenergic signaling in cardiac myocytes and implications for pharmacological treatment

Emily E Meyer et al. J Theor Biol. .

Abstract

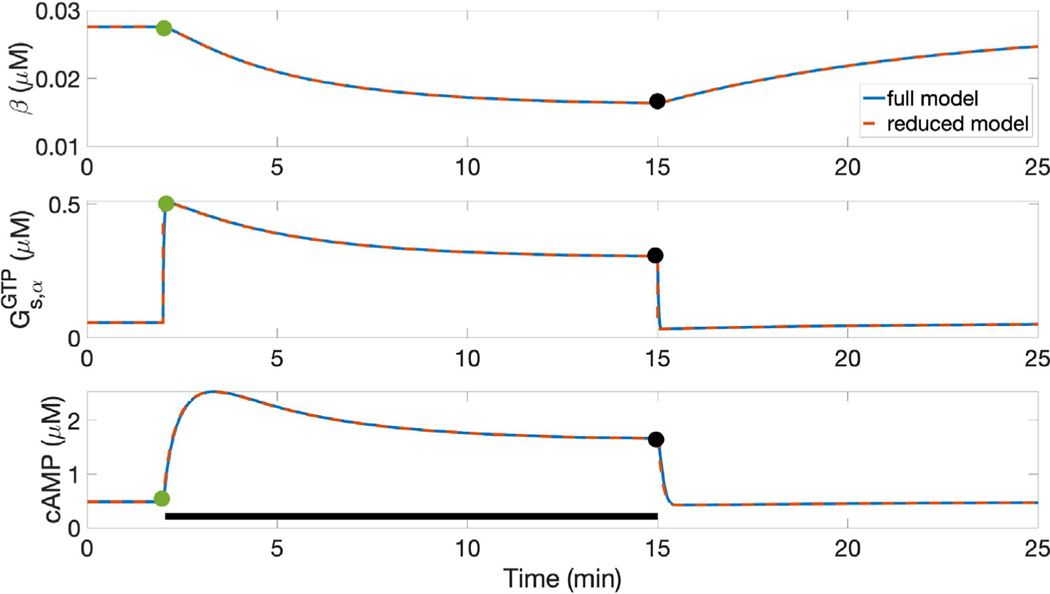
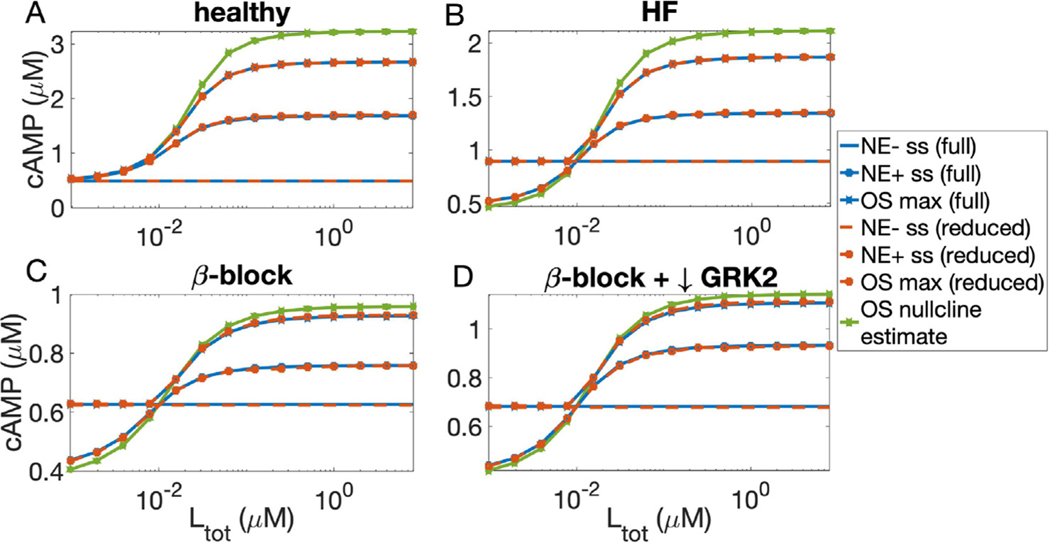
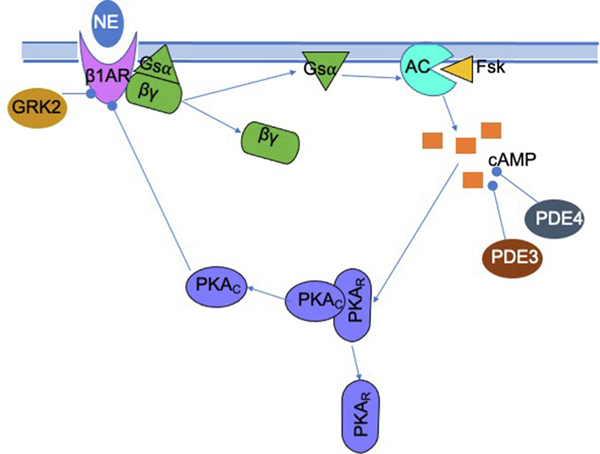
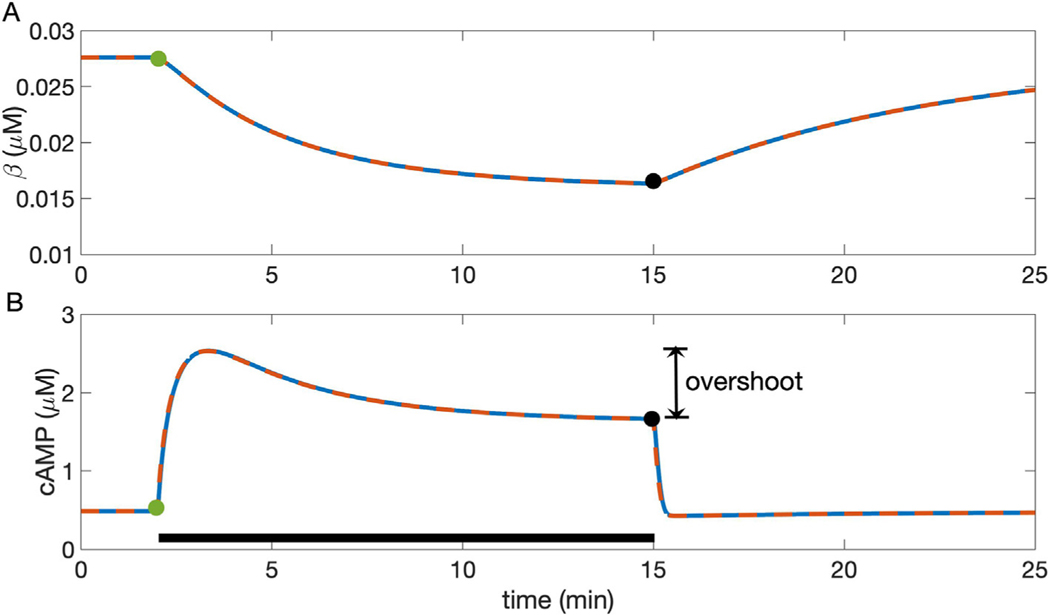
Dense innervation of the heart by the sympathetic nervous system (SNS) allows cardiac output to respond appropriately to the needs of the body under varying conditions, but occasionally the abrupt onset of SNS activity can trigger cardiac arrhythmias. Sympathetic activity leads to the release of norepinephrine (NE) onto cardiomyocytes, activating β1-adrenergic receptors (β1-ARs) and leading to the production of the second messenger cyclic AMP (cAMP). Upon sudden activation of β1-ARs in experiments, intracellular cAMP can transiently rise to a high concentration before converging to a steady state level. Although changes to cellular cAMP concentration are important in modulating the overall cardiovascular response to sympathetic tone, the underlying mechanisms of the cAMP transients and the parameters that control their magnitude are unclear. We reduce a detailed computational model of the β1-adrenergic signaling cascade to a system of two differential equations by eliminating extraneous variables and applying quasi-steady state approximation. The structure of the reduced model reveals that the large cAMP transients associated with abrupt β1-AR activation are generated by the interplay of production/degradation of cAMP and desensitization/resensitization of β1-ARs. The reduced model is used to predict how the dynamics of intracellular cAMP depend on the concentrations of norepinephrine (NE), phosphodiesterases 3 and 4 (PDE3,4), G-protein coupled receptor kinase 2 (GRK2), and β1-AR, in healthy conditions and a simple model of early stages of heart failure. The key findings of the study are as follows: 1) Applying a reduced model of the dynamics of cardiac sympathetic signaling we show that the concentrations of two variables, cAMP and non-desensitized β1-AR, capture the overall dynamics of sympathetic signaling; 2) The key factors influencing cAMP production are AC activity and PDE3,4 activity, while those that directly impact β1-AR phosphorylation are GRK2 and PKA1. Thus, disease states that affect sympathetic control of the heart can be thoroughly assessed by studying AC activity, PDE3,4, GRK2 and PKA activity, as these factors directly impact cAMP production/degradation and β1-AR (de) phosphorylation and are therefore predicted to comprise the most effective pharmaceutical targets in diseases affecting cardiac β1-adrenergic signaling.

Keywords: -blockers; Cyclic AMP; Heart failure; Mathematical model; Sympathetic nervous system.


Conflict of interest statement

Declaration of Competing Interest The authors declare that they have no known competing financial interests or personal relationships that could have appeared to influence the work reported in this paper.

Figures

Fig. A.1.
Fig. A.1.
When the full model is initialized from a steady state with 0 NE, and 1 μM NE is abruptly added, Gs,αGTP adapts to its quasi-steady state value much more rapidly than do cAMP and β1AR concentrations. This justifies the simplification that Gs,αGTP reaches quasi-steady state instantaneously, reducing the system of three variables to a two-dimensional system.
Fig. A.2.
Fig. A.2.
Comparison between the predictions of the full and reduced model across a range of Ltot values in each scenario described in Fig. 5. A: cAMP steady states with 0 μM NE (NE- ss) and a nonzero NE concentration, and overshoot max (OS max) attained from an initial condition at the NE- ss, in the healthy condition (βtot = 0.028 μM, kGRK2 = 1.1e − 3 sec−1). B: as in A, but with NE- cAMP steady states computed using 0.01 μM NE and kGRK2 = 2.2e − 3 sec−1. C: as in B, with βtot = 0.014 μM. D: as in C, with kGRK2 = 1.1e − 3. In all panels, the overshoot max in the full and reduced model are computed from simulations (red and blue curves) and compared with the estimate of overshoot max (green) computed using the value of the cAMP nullcline corresponding to the β concentration at the NE- steady state. The nullclines consistently overestimate the overshoot.
Fig. 1.
Fig. 1.
The release of norepinephrine activates a biochemical signaling pathway that results in intracellular physiological changes in a cardiac myocyte. The adrenergic agonist binds to a β1-AR, which activates the Gsα subunit to stimulate adenylyl cyclases V and VI (AC), which then produces cAMP. cAMP activates PKA, the catalytic subunit (PKAC) of which phosphorylates numerous targets including the β1-AR, potassium channels, calcium channels, ryanodine receptors, phospholamban, and troponin I. Meanwhile, cAMP is degraded by phosphodiesterase 3 and 4 (PDE3, PDE4).
Fig. 2.
Fig. 2.
Predictions for cellular response to a change from basal conditions to 100 nM NE and subsequent return to 0 NE in the full (solid blue line) and reduced (dashed red line) Soltis-Saucerman model. Agonist is applied from 2 to 15 min of the simulation (black bar in B). A: both models predict a slow decrease in β upon application of NE, followed by a slow increase when NE is removed. B: in both models, cyclic AMP concentration transiently increases for 1–2 min and then gradually decays to a steady state in the presence of a high NE concentration. Overlay includes the trajectory from Fig. S1, panel A in Saucerman et al. (2004) and data (circles), taken from Hayes et al. (1980). Vertical double-arrow depicts “overshoot,” the difference between transient maximum and elevated steady state. Removal of NE leads to a small undershoot and return to the basal steady state. The models show nearly identical outputs, indicating that the reduction does not substantially change predictions. Green and black circles indicate steady-state values of variables for NE− and NE+ conditions, just preceding application and removal of NE respectively (see Fig. 3).
Fig. 3.
Fig. 3.
Phase plane for the two-variable reduced model: cAMP nullcline (red) and β nullcline (blue) divide state space into regions where cAMP concentration and active β1-AR concentration increase and decrease (see text). A: high dose, 100 nM NE; B: NE-free condition. Synaptic NE concentration changes the slope of the cAMP nullcline and the position of the β nullcline. Green and black circles are located at the steady states for the NE-free and high-dose NE conditions, respectively, and used as initial data for the alternate condition, producing the trajectories corresponding to the solutions shown in Fig. 2. Vertical arrow depicts the “overshoot,” in which the nearly vertical rise to the cAMP nullcline precedes a slower decay to the NE+ steady state. Note that cAMP concentration changes more rapidly than does the β concentration, leading to overshoot when the cAMP nullcline moves abruptly. The amplitude of the overshoot can be estimated by the height of the cAMP nullcline at the NE- steady state (i.e., vertical distance between green circle and red curve in A). The vertical difference between NE+ and NE− steady states (green and black circles) represents “dynamic range”, i.e. cellular responsiveness to ligand.
Fig. 4.
Fig. 4.
Effects of phosphodiesterase bulk concentration on cAMP overshoot. A: cAMP steady state (blue) and maximum (red), compared to the NE- steady state (gray), with total PDE concentration 0.072 μM as in (Saucerman et al., 2003, 2004). As NE increases through several orders of magnitude, overshoot amplitude increases most sharply between 10 and 100 nM NE. B: cAMP steady state and maximal concentration, as in A, with bulk PDE concentration doubled to 0.144 μM. The steady state and maximal concentrations of cAMP are both reduced. C: c and β nullclines with 1μM NE, and total PDE concentrations 0.072 μM (solid red curve) and 0.144 μM (dashed red curve). The gray curves denote the NE− nullclines, and the blue curve depicts the NE+ β nullcline, which is unaltered by increased PDE. Increased concentration of PDE reduces the slope of the cAMP nullcline, changing the steady state concentrations of both c and β and the amplitude of the cAMP overshoot. D: cAMP steady state (blue) and maximum (red) for 1μM NE, with varying concentrations of total phosphodiesterase (sum of PDE3 and PDE4). As PDE concentration increases over a narrow range of values, the amplitude of cAMP overshoot decreases.
Fig. 5.
Fig. 5.
Putative effects of β-blocker treatment on markers of early heart failure. In all panels, blue curves represent β nullclines and red curves are c nullclines. Solid lines represent 0 NE (NE−) while dashed lines indicate the NE+ cases with varying concentrations of NE. Green curves are trajectories from simulations with initial condition at the NE− steady state transitioning to the NE+ steady state. A: phase plane with 0 and 10 nM NE and default parameters, corresponding to a healthy system. B: phase plane with cAMP and β nullclines for 10 and 100 nM NE, corresponding to elevated catecholamine levels at rest as in early heart failure. C: nullclines for 10 and 100 nM NE, as in early heart failure; additionally, kGRK2 is increased by a factor of 2, corresponding to up-regulation of GRK2. D: phase plane for 10 and 100 nM NE with total β1-AR concentration reduced by half and other parameters at default values. E: phase plane with 10 and 100 nM NE, with β1-AR concentration halved and kGRK2 doubled. F: phase plane with 10 and 100 nM NE with both β1-AR concentration and kGRK2 halved.
Fig. 6.
Fig. 6.
Effects of early heart failure and β1-AR inhibition on cellular cAMP baseline, maximum concentration attained during overshoot, and dynamic range as predicted by nullcline analysis. A: dynamic range in four conditions: healthy (baseline 0 μM NE and “high dose” 10 μM NE; early heart failure (elevated baseline NE [10μM] and elevated “high dose” NE [100 μM]; β-block (as in HF, and with total concentration of β-ARs reduced by 50%); and β-block with concurrent GRK2 downregulation (as in β-block, and with kGRK2 reduced by 50%). B: maximal cAMP concentration attained during overshoot for the amount of NE required to achieve a dynamic range of 0.26μM cAMP, compared across the “healthy”, “HF”, and “β-block + ↓ GRK2” scenarios.

Similar articles

Cited by

References

    1. Amanfu RK, Saucerman JJ, 2014. Modeling the effects of β1-adrenergic receptor blockers and polymorphisms on cardiac myocyte Ca2+ handling. Molecular Pharmacology 86 (2), 222–230. - PMC - PubMed
    1. Banyasz T, Jian Z, Horvath B, Khabbaz S, Izu LT, Chen-Izu Y, 2014. Beta-adrenergic stimulation reverses the I Kr–I Ks dominant pattern during cardiac action potential. Pflugers Archiv European Journal of Physiology 466 (11), 2067–2076. - PMC - PubMed
    1. Bers DM, 2008. Calcium cycling and signaling in cardiac myocytes. Annual Review of Physiology 70 (1), 23–49. URL:http://www.annualreviews.org/doi/10.1146/annurev.physiol.70.113006.100455. - DOI - PubMed
    1. Bohm M, Maack C, 2000. Treatment of heart failure with beta-blockers. Mechanisms and results. Basic Research in Cardiology 95, 38. - PubMed
    1. Bouzamondo A, Hulot J-S, Sanchez P, Lechat P, 2003. Beta-blocker benefit according to severity of heart failure. European Journal of Heart Failure 5 (3), 281–289. URL: http://doi.wiley.com/10.1016/S1388-9842%2803%2900042-4. - DOI - PubMed

Publication types