. 2021 Apr 1;108(4):608-619.
doi: 10.1016/j.ajhg.2021.03.004. Epub 2021 Mar 18.

The landscape of autosomal-recessive pathogenic variants in European populations reveals phenotype-specific effects

Affiliations

The landscape of autosomal-recessive pathogenic variants in European populations reveals phenotype-specific effects

Hila Fridman et al. Am J Hum Genet. .

Abstract

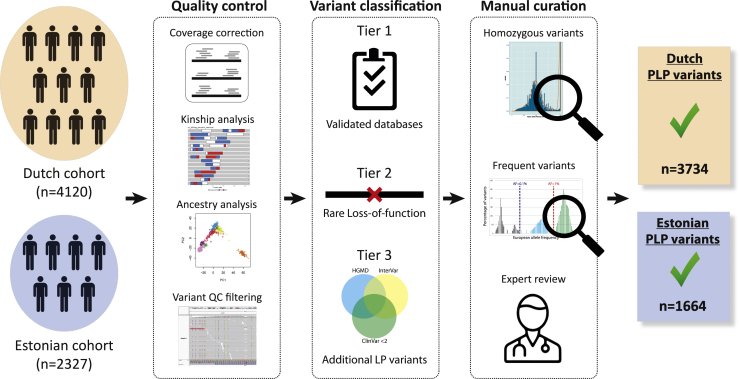
The number and distribution of recessive alleles in the population for various diseases are not known at genome-wide-scale. Based on 6,447 exome sequences of healthy, genetically unrelated Europeans of two distinct ancestries, we estimate that every individual is a carrier of at least 2 pathogenic variants in currently known autosomal-recessive (AR) genes and that 0.8%-1% of European couples are at risk of having a child affected with a severe AR genetic disorder. This risk is 16.5-fold higher for first cousins but is significantly more increased for skeletal disorders and intellectual disabilities due to their distinct genetic architecture.

Keywords: at-risk couples; autosomal recessive disorders; carrier frequency; pre-conception carrier screening; selection.


Conflict of interest statement

S.C. is a paid consultant to MyHeritage. All other authors declare no competing interests.

Figures

Figure 1
Figure 1
Overview of the selection of PLP variants From left to right, variants were selected from two exome-sequencing cohorts of healthy individuals from two different European populations. Samples and variants were subjected to stringent quality control. Samples were filtered for kinship and ethnicity. Variants were filtered for quality and selected from consistently well-covered regions. For variant classification, variants were classified as PLP based on curated publicly available databases and/or on their predicted loss of function effect. For manual curation, we performed manual curation steps at both the gene and the variant level, to confirm the validity of our PLP classification selection process. Detailed information is in the subjects and methods and Figure S1.
Figure 2
Figure 2
PLP variants in the Dutch and Estonian cohorts: robustness of variant classification (A) The number of PLPs in each cohort and their overlap. (B) Genes ranked by PLP frequency: correlation between the Dutch and the Estonian cohorts. The lower the rank number, the higher the number of PLPs observed in that gene (i.e., a gene ranked 1 has the largest number of PLPs); genes with no PLPs in both cohorts were excluded (449 genes); gene names are written for genes in the top 10 ranking: blue, Estonian only top 10; orange, Dutch only top 10; purple, Dutch and Estonian top 10. The dots sizes represent the number of genes with this rankings combination. Spearman correlation coefficient: 0.69; p value < 0.00001. (C) Comparison of disease carrier frequency estimates to published data of the Dutch neonatal screening program from 2016 and 2017. Spearman correlation coefficient 0.85; p value = 0.0005; full diseases and gene names are in Table S11.
Figure 3
Figure 3
Effect of consanguinity on ARCs rates for different disease categories (A) Rates of ARCs per 100,000 couples (on the y axis) for different disorders (on the x axis) in the Dutch cohort (orange) and Estonian cohort (blue) for non-consanguineous couples. (B) Same as in (A) but for first-cousin couples. (C) Consanguinity-ratio (CR) scores. Scores in red are significantly higher compared to a random set of AR genes with the same coding bp length. (D) Correlation of first-cousin CRs between the Dutch and Estonian cohorts for different disorders. x axis shows the rank in the Dutch cohort; y axis shows the rank in the Estonian cohort. The lower the rank number, the higher the CR in that gene panel (i.e., a gene-panel ranked 1 has the highest CR). The size of the dots indicates the number of genes in the gene panel. The red color indicates gene panels with statistically significant higher CRs compared to a random set of AR genes with the same coding bp length. Rankings excluding common variants in GJB2 (deafness) and CLCN1 (neuromuscular) are marked with an asterisk.
Figure 4
Figure 4
Effect of consanguinity on affected offspring rates for different disorders The expected number of affected children for different disorders per 100,000 births, in non-consanguineous and first-cousin couples. The red outer arch represents disorders with significantly higher CR scores. The difference between the cohorts for the metabolic gene panel is mostly attributed to a high carrier frequency in two genes (CFTR and SERPINA1) in the Dutch cohort.
Figure 5
Figure 5
Coding singleton density in coding regions based on 1000 Genomes data (European populations) for the different gene panels Violin plots of the distribution of coding singleton density scores for different gene panels. Gray colors indicate external reference gene sets, whereas colored violin plots are gene sets as defined in this manuscript. Tested differences of the median are indicated by braces, giving rise to a p value of 1.8·10−4 for ID/skeletal gene set compared to “other disorders” gene set, using a Wilcoxon rank sum test with Bonferroni correction (Table S14).

Similar articles

Cited by

References

    1. Muller H.J. Our load of mutations. Am. J. Hum. Genet. 1950;2:111–176. - PMC - PubMed
    1. Morton N.E., Crow J.F., Muller H.J. AN ESTIMATE OF THE MUTATIONAL DAMAGE IN MAN FROM DATA ON CONSANGUINEOUS MARRIAGES. Proc. Natl. Acad. Sci. USA. 1956;42:855–863. - PMC - PubMed
    1. Kondrashov A.S. Contamination of the genome by very slightly deleterious mutations: why have we not died 100 times over? J. Theor. Biol. 1995;175:583–594. - PubMed
    1. Gao Z., Waggoner D., Stephens M., Ober C., Przeworski M. An estimate of the average number of recessive lethal mutations carried by humans. Genetics. 2015;199:1243–1254. - PMC - PubMed
    1. Bell C.J., Dinwiddie D.L., Miller N.A., Hateley S.L., Ganusova E.E., Mudge J., Langley R.J., Zhang L., Lee C.C., Schilkey F.D. Carrier testing for severe childhood recessive diseases by next-generation sequencing. Sci. Transl. Med. 2011;3:65ra4. - PMC - PubMed

Publication types

LinkOut - more resources