

Establishment of reference intervals of clinical chemistry analytes for the adult population in Egypt
- PMID: 33740794
- PMCID: PMC7979267
- DOI: 10.1371/journal.pone.0236772
Establishment of reference intervals of clinical chemistry analytes for the adult population in Egypt
Abstract
Background: This is the first Egyptian nationwide study for derivation of reference intervals (RIs) for 34 major chemistry analytes. It was conducted as a part of the global initiative by the IFCC Committee on Reference Intervals and Decision Limits (C-RIDL) for establishing country-specific RIs based on a harmonized protocol.
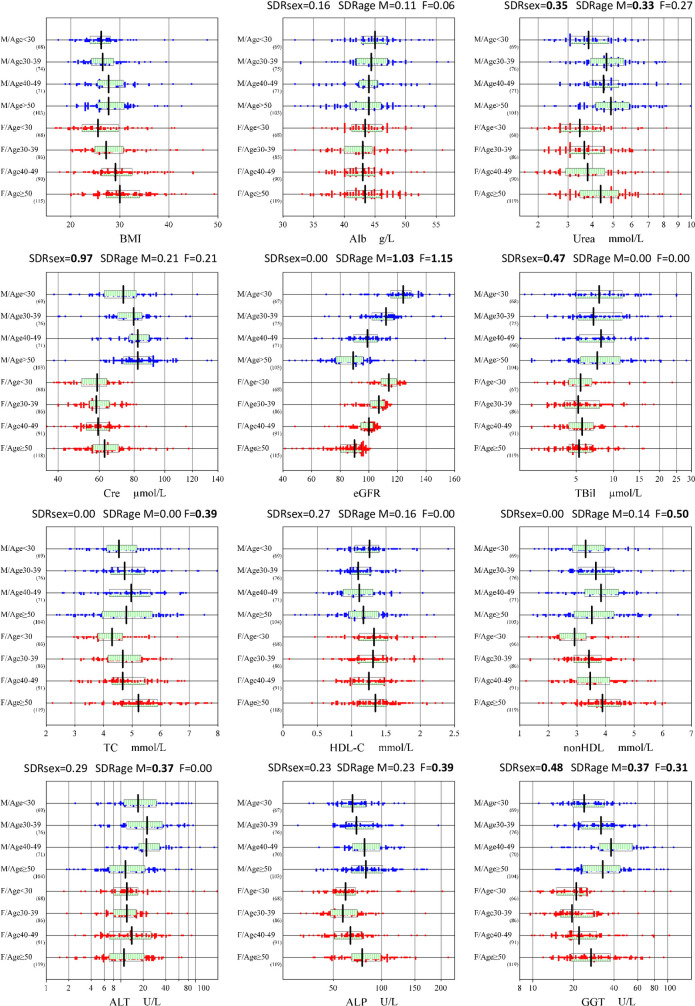
Methods: 691 apparently healthy volunteers aged ≥18 years were recruited from multiple regions in Egypt. Serum specimens were analyzed in two centers. The harmonization and standardization of test results were achieved by measuring value-assigned serum panel provided by C-RIDL. The RIs were calculated by parametric method. Sources of variation of reference values (RVs) were evaluated by multiple regression analysis. The need for partitioning by sex, age, and region was judged primarily by standard deviation ratio (SDR).
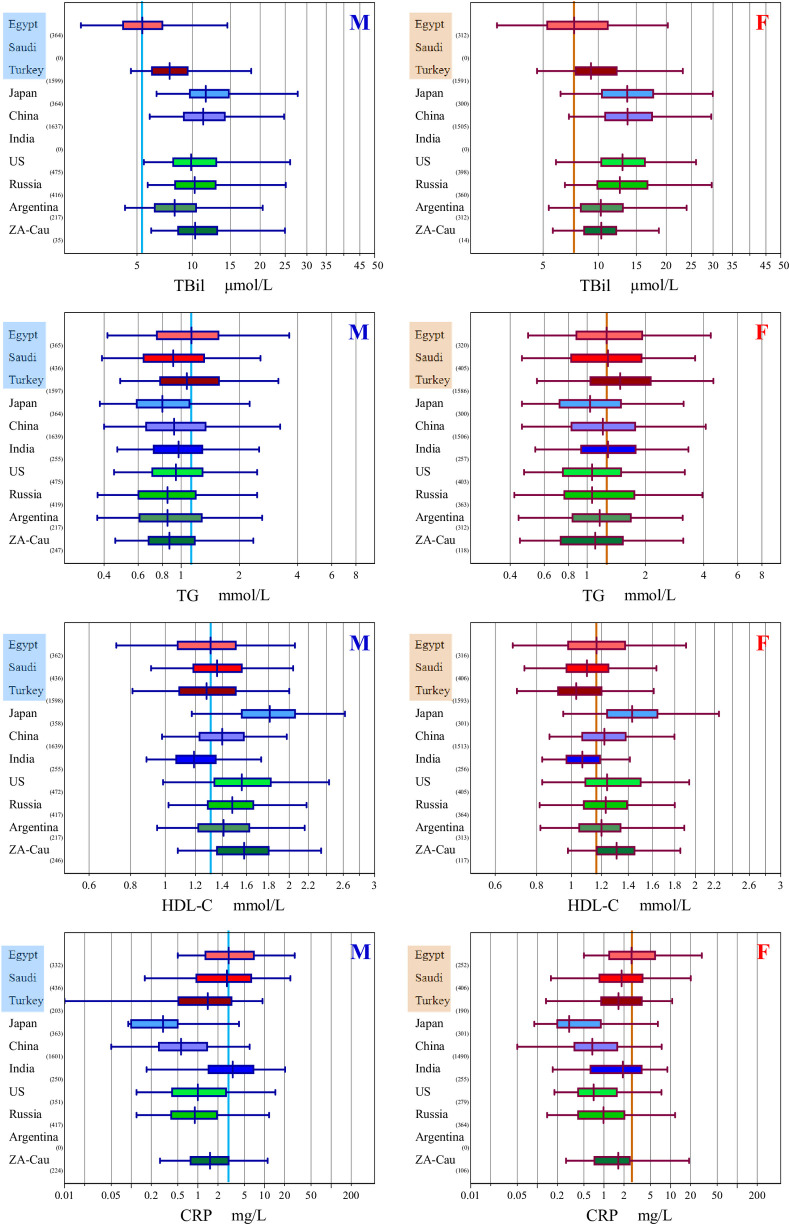
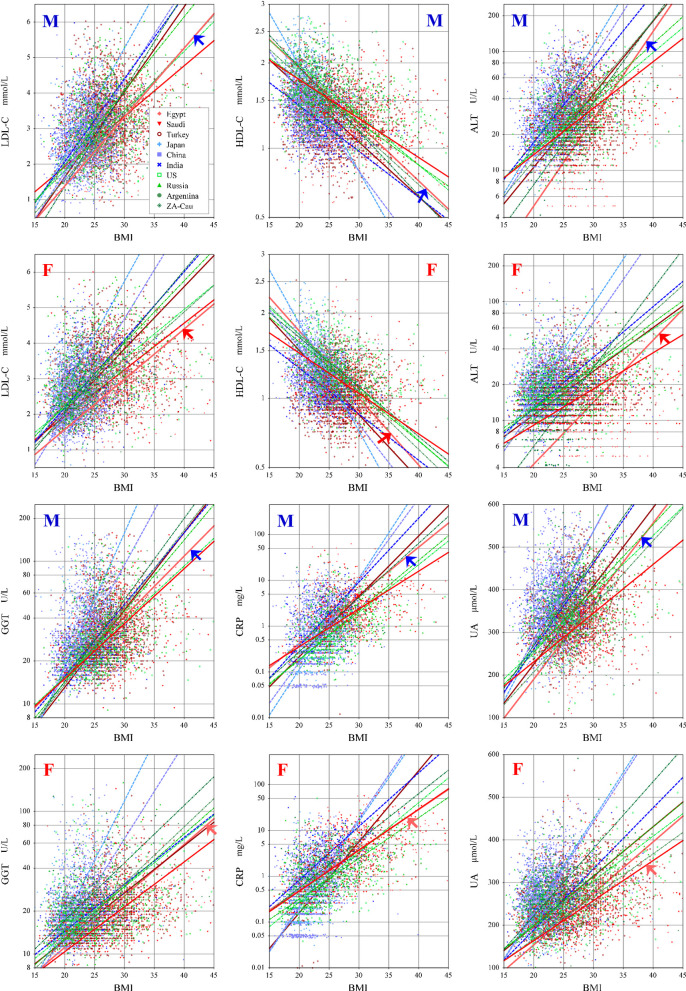
Results: Gender-specific RIs were required for six analytes including total bilirubin (TBil), aspartate and alanine aminotransferase (AST, ALT). Seven analytes required age-partitioning including glucose and low-density lipoprotein cholesterol (LDL-C). Regional differences were observed between northern and southern Egypt for direct bilirubin, glucose, and high-density-lipoprotein cholesterol (HDL-C) with all their RVs lower in southern Egypt. Compared with other collaborating countries, the features of Egyptian RVs were lower HDL-C and TBil and higher TG and C-reactive protein. In addition, BMI showed weak association with most of nutritional markers. These features were shared with two other Middle Eastern countries: Saudi Arabia and Turkey.
Conclusion: The standardized RIs established by this study can be used as common Egyptian RI, except for a few analytes that showed regional differences. Despite high prevalence of obesity among Egyptians, their RVs of nutritional markers are less sensitive to increased BMI, compared to other collaborating countries.
Conflict of interest statement
No authors have competing interests.
Figures
Similar articles
-
Derivation of sex and age-specific reference intervals for clinical chemistry analytes in healthy Ghanaian adults.Clin Chem Lab Med. 2022 Jul 4;60(9):1426-1439. doi: 10.1515/cclm-2022-0293. Print 2022 Aug 26. Clin Chem Lab Med. 2022. PMID: 35786502
-
Establishing reference intervals for major biochemical analytes for the Russian population: a research conducted as a part of the IFCC global study on reference values.Clin Biochem. 2020 Jul;81:47-58. doi: 10.1016/j.clinbiochem.2020.04.001. Epub 2020 Apr 9. Clin Biochem. 2020. PMID: 32278594
-
Establishment of reference intervals for immunoassay analytes of adult population in Saudi Arabia.Clin Chem Lab Med. 2020 Jul 28;58(8):1302-1313. doi: 10.1515/cclm-2019-1049. Clin Chem Lab Med. 2020. PMID: 32160154
-
Distinguishing reference intervals and clinical decision limits - A review by the IFCC Committee on Reference Intervals and Decision Limits.Crit Rev Clin Lab Sci. 2018 Sep;55(6):420-431. doi: 10.1080/10408363.2018.1482256. Epub 2018 Jul 26. Crit Rev Clin Lab Sci. 2018. PMID: 30047297 Review.
-
The theory of reference values: an unfinished symphony.Clin Chem Lab Med. 2013 Jan;51(1):47-64. doi: 10.1515/cclm-2012-0682. Clin Chem Lab Med. 2013. PMID: 23183761 Review.
Cited by
-
Establishment of reference interval for hemoglobin A1C and other hemoglobin subfractions for healthy Saudi adults.PLoS One. 2024 Mar 25;19(3):e0300028. doi: 10.1371/journal.pone.0300028. eCollection 2024. PLoS One. 2024. PMID: 38527010 Free PMC article.
-
The BioRef Infrastructure, a Framework for Real-Time, Federated, Privacy-Preserving, and Personalized Reference Intervals: Design, Development, and Application.J Med Internet Res. 2023 Oct 18;25:e47254. doi: 10.2196/47254. J Med Internet Res. 2023. PMID: 37851984 Free PMC article.
-
Variation in normative values of major clinical biochemistry analytes in healthy reproductive-age women in India: A subset of data from a National Indian Council of Medical Research-Polycystic Ovary Syndrome task force study.Indian J Pharmacol. 2023 Mar-Apr;55(2):76-88. doi: 10.4103/ijp.ijp_694_22. Indian J Pharmacol. 2023. PMID: 37313933 Free PMC article.
-
Clinical laboratory reference values in adults in Kisumu County, Western Kenya; hematology, chemistry and CD4.PLoS One. 2021 Mar 30;16(3):e0249259. doi: 10.1371/journal.pone.0249259. eCollection 2021. PLoS One. 2021. PMID: 33784358 Free PMC article.
-
Establishment of reference intervals for hematological parameters of adult population in the western region of Saudi Arabia.PLoS One. 2023 Feb 8;18(2):e0281494. doi: 10.1371/journal.pone.0281494. eCollection 2023. PLoS One. 2023. PMID: 36753498 Free PMC article.
References
Publication types
MeSH terms
Substances
LinkOut - more resources
Full Text Sources
Other Literature Sources
Medical
Research Materials
Miscellaneous
