. 2021 Mar 19;17(1):29.
doi: 10.1186/s13007-021-00730-9.

A label-free, fast and high-specificity technique for plant cell wall imaging and composition analysis

Affiliations

A label-free, fast and high-specificity technique for plant cell wall imaging and composition analysis

Huimin Xu et al. Plant Methods. .

Abstract

Background: New cell wall imaging tools permit direct visualization of the molecular architecture of cell walls and provide detailed chemical information on wall polymers, which will aid efforts to use these polymers in multiple applications; however, detailed imaging and quantification of the native composition and architecture in the cell wall remains challenging.

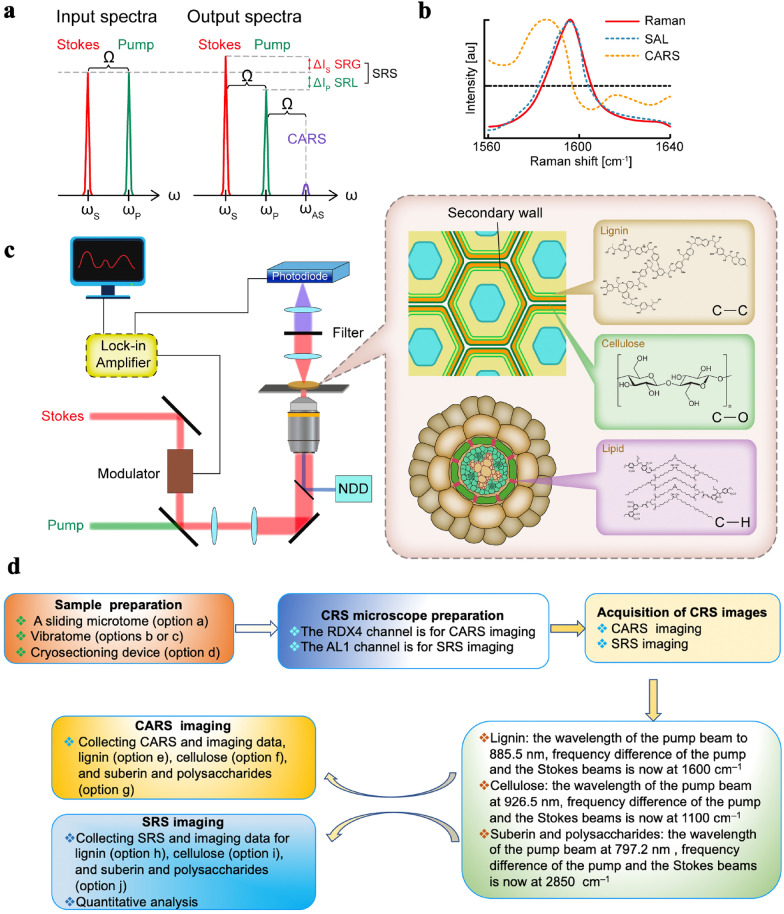
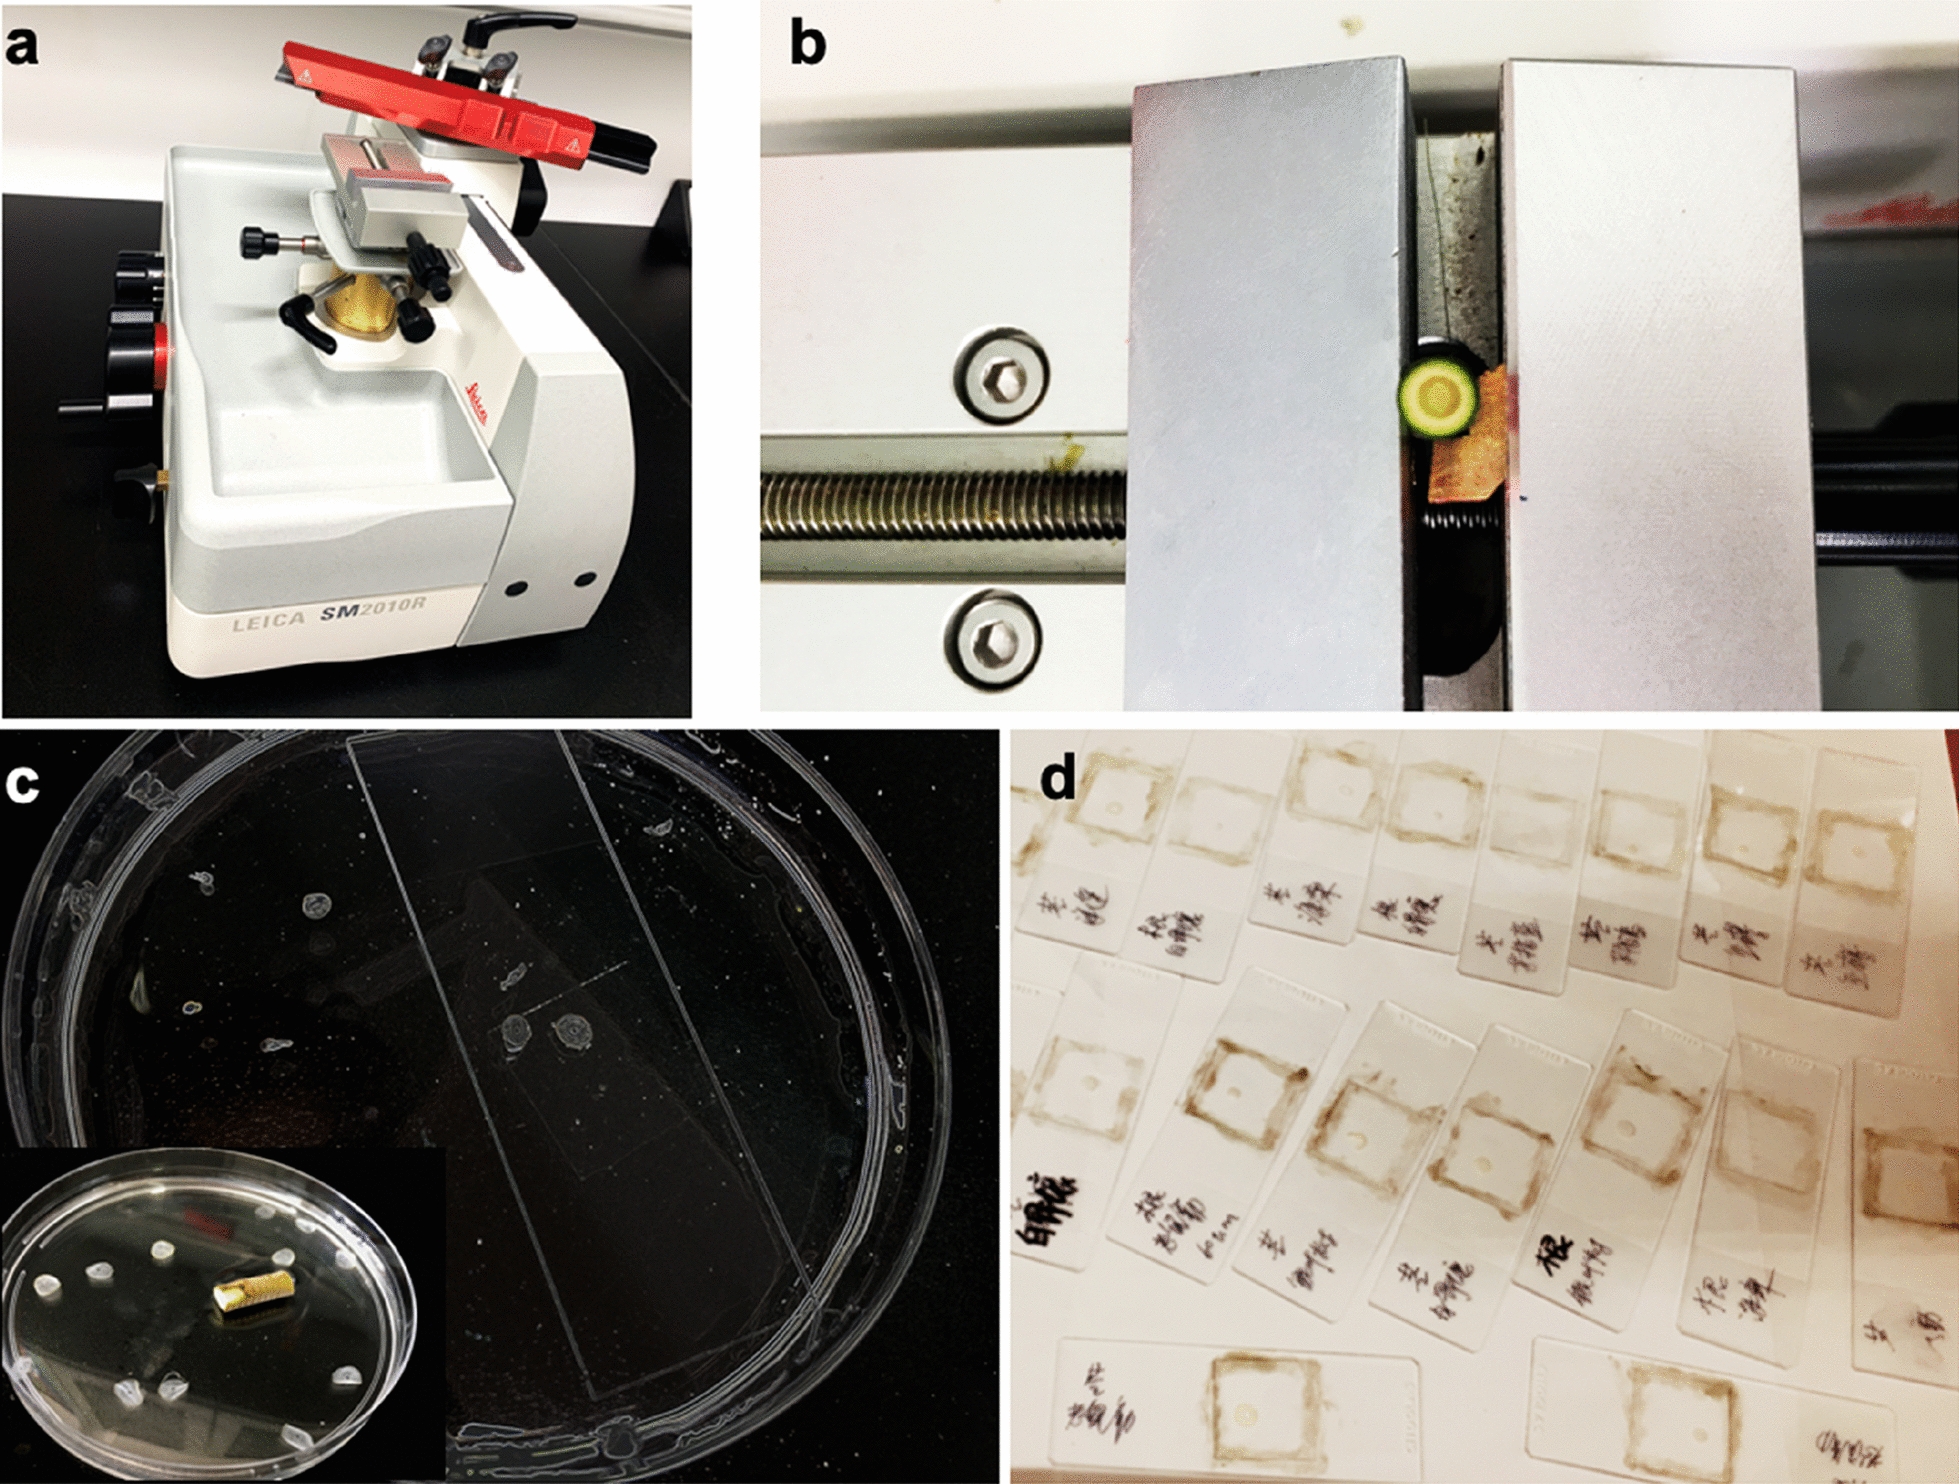
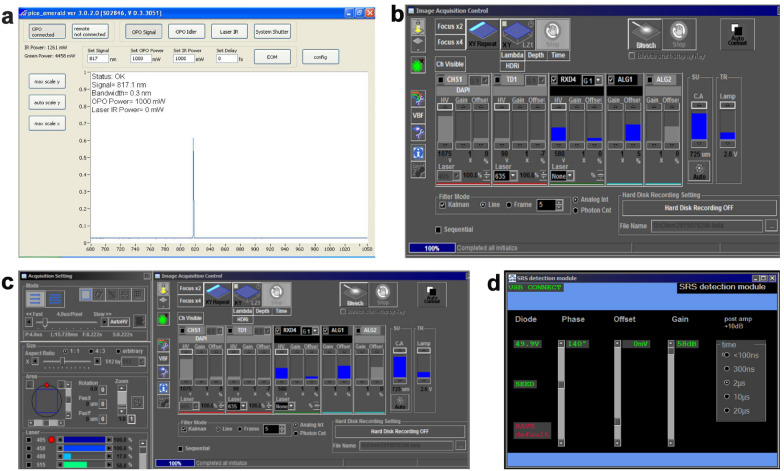
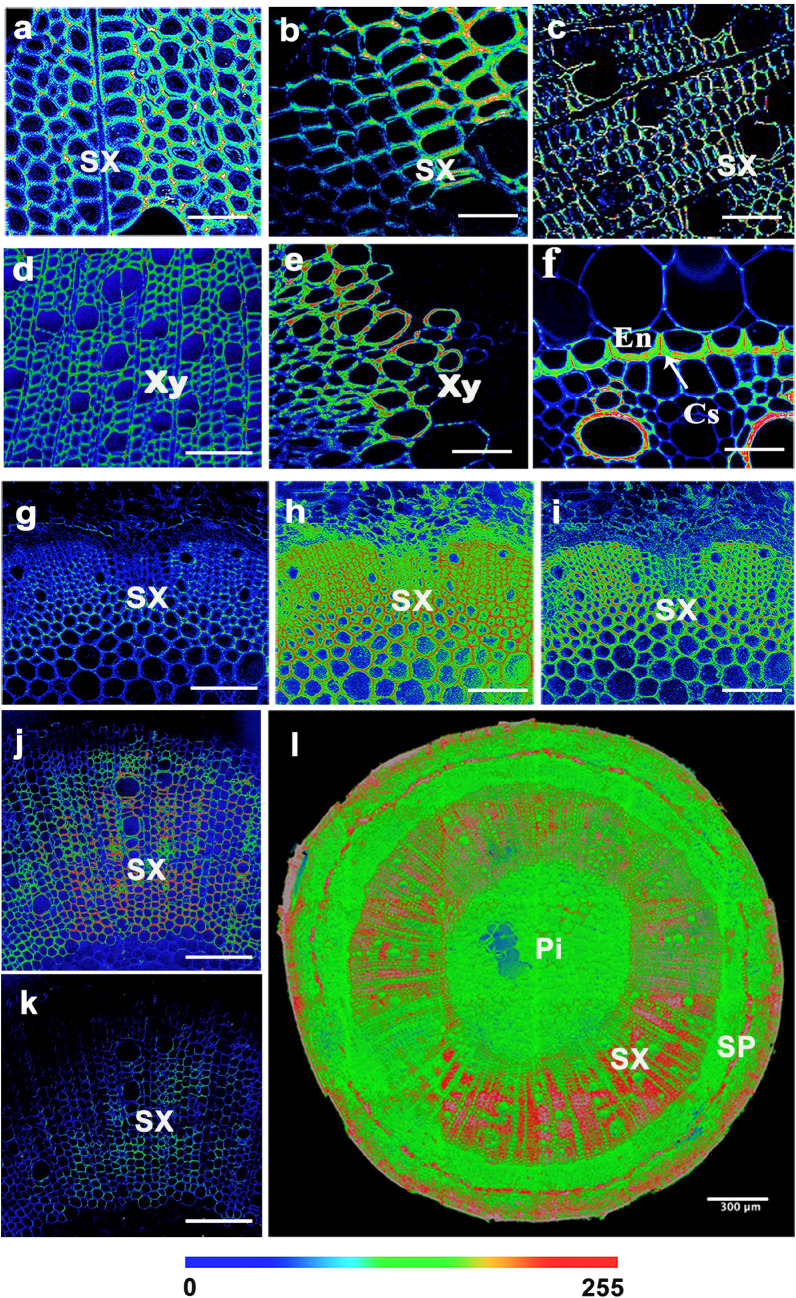
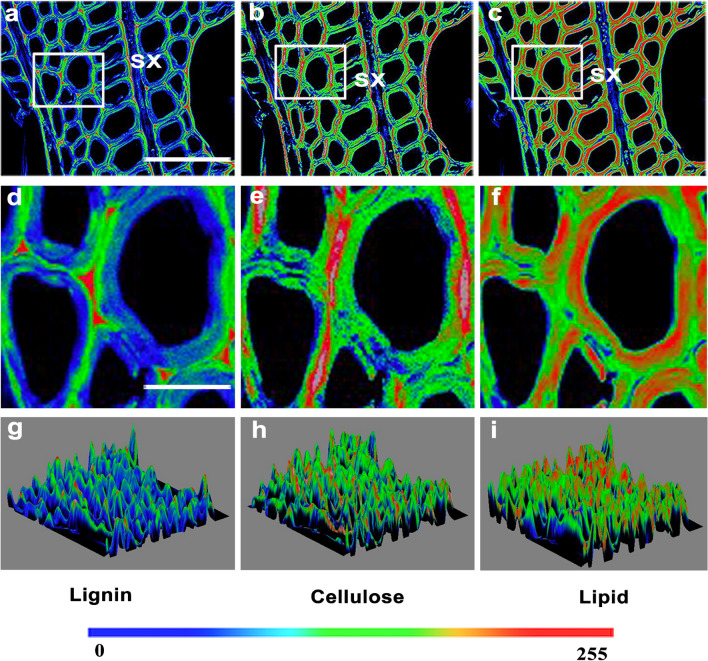
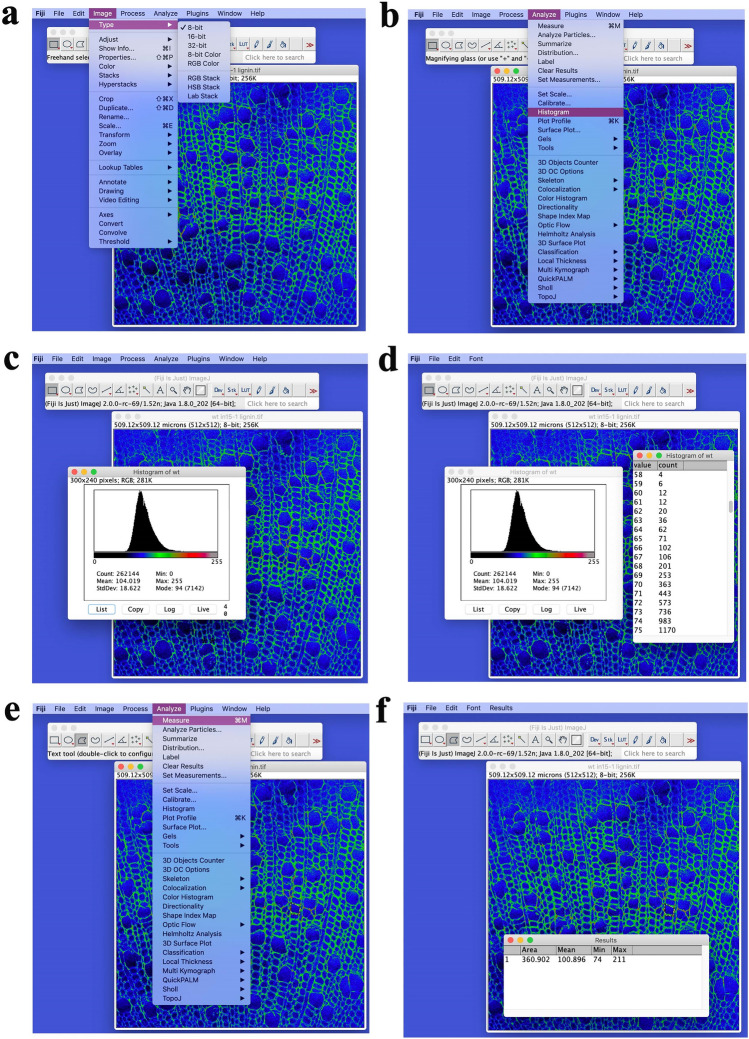
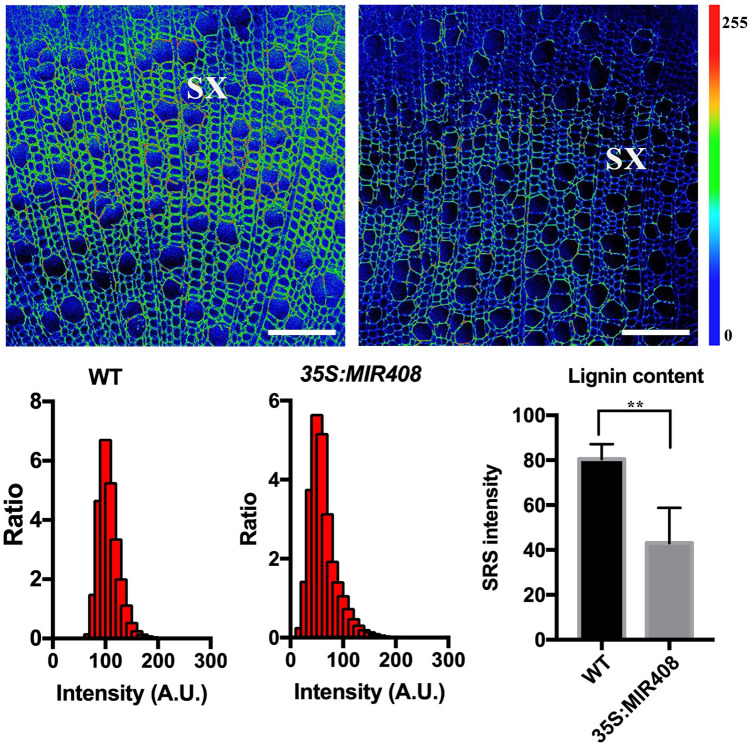
Results: Here, we describe a label-free imaging technology, coherent Raman scattering (CRS) microscopy, including coherent anti-Stokes Raman scattering (CARS) microscopy and stimulated Raman scattering (SRS) microscopy, which can be used to visualize the major structures and chemical composition of plant cell walls. We outline the major steps of the procedure, including sample preparation, setting the mapping parameters, analysis of spectral data, and image generation. Applying this rapid approach will help researchers understand the highly heterogeneous structures and organization of plant cell walls.

Conclusions: This method can potentially be incorporated into label-free microanalyses of plant cell wall chemical composition based on the in situ vibrations of molecules.

Keywords: Cell wall; Chemical composition; Coherent Raman scattering; Coherent anti-Stokes Raman scattering; Label-free imaging; Stimulated Raman scattering.


Conflict of interest statement

The authors declare that they have no competing interests.

Figures

Fig. 1
Fig. 1
Principle and design of CRS microscopy. Modified from Freudiger et al. [33]. CRS microscopy mainly includes two sub-types, coherent anti-Stokes Raman scattering (CARS) microscopy and stimulated Raman scattering (SRS) microscopy, both of which can be performed by setting the wavelength of the pump beam in a single setup. a The principle of SRS microscopy. Two input beams (Stokes and pump) are focused on the sample; when the difference in energy between the two beams (Ω) matches that of a specific chemical bond in the sample, then an additional signal is produced. Input and output spectra of SRS and CARS is shown. SRS leads to an intensity increase in the Stokes beam (SRG) and an intensity decrease in the pump beam (SRL). Also shown (not to scale) is the CARS signal generated at the anti-Stokes frequency ωAS when the energy difference between the pump beam photon and the Stokes beam photon matches the vibrational frequency (Ωvib) of a specific chemical bond. b Agreement of the SRL spectrum (red circles) with the spontaneous Raman spectrum (black line) of the Raman peak (1595 cm−1) of 10 mM retinol in ethanol. The distorted CARS spectrum (blue squares) exhibits a typical peak shift, a dispersive shape, and non-resonant background. c Plant cell wall imaging of the chemical composition of stem and root tissues. A CRS microscope with forward and epi detection is illustrated. The Stokes beam is modulated by an electro-optic modulator. The transmitted or reflected pump beam is filtered and detected by a large-area photodiode. The SRL is measured by a lock-in amplifier to provide a pixel of the image. The CARS signal is detected by the NDD. d Schematic of the process of CRS imaging of plant cell wall composition
Fig. 2
Fig. 2
Micro cuttings can be obtained with conventional techniques. a Sliding microtome. b The plant samples were cut into 10-μm-thick slices, and these cross-sections were gently washed using distilled water, then were transferred from the buffer tray into a glass beaker and then to a clear Petri plate (c). d The sections were transferred to the slide, with a coverslip and sealed
Fig. 3
Fig. 3
Detection and acquisition of CRS images. a Control software setting. Turn on the key switch and power switch of the laser control unit. Then turn on the power switch of the chiller and check whether the water-cooled pipe joint is leaking. Set the temperature to 23 ℃. Wait about 0.5 h for the temperature to stabilize. b Dialog window for detection channel settings. Switch on the panel PC. The control software (picoEmerald ver 3.0.2.0) will start automatically (a). Confirm by clicking “YES” when the system asks you whether to start the laser. This takes about 0.5 h to warm up and light the laser. c Dialog window for image settings. Turn on the main power switch, key switch, scanning module, and motorized translation stage of the microscope. d Dialog window for SRS detection settings. Open the FV10-ASW3.0 software of the microscope by double-clicking the FV10-ASW3.0 icon. The RDX4 channel is for CARS imaging, while the AL1 channel is for SRS imaging
Fig. 4
Fig. 4
CRS images of lignin, cellulose, and lipids in xylem cell walls. ac CARS images of lignin, cellulose, and lipids in poplar, respectively. d, e SRS images of lignin of stem xylem in poplar and cellulose of stem xylem in Arabidopsis. f SRS image of the cell walls in the Casparian strip of a maize root. gi SRS images of lignin, cellulose, and lipids in the secondary xylem cell wall of Bruguiera sexangula stem tissue, respectively. jl SRS images of lignin, cellulose, and lipids in the secondary xylem cell walls of Derris trifoliata. SX secondary xylem, Xy xylem, Cs Casparian strip, En endodermis, SP secondary phloem, Pi pith. Scale bars = 50 µm in ak, 300 µm in l
Fig. 5
Fig. 5
SRS images of lignin, cellulose, and lipids in xylem cell walls. ac SRS images of lignin, cellulose, and lipids in the secondary xylem cell walls of poplar, respectively. The white boxes are magnified in df. The 3D surface plots are shown in gi. SX secondary xylem; Scale bars = 50 µm in af
Fig. 6
Fig. 6
Quantitative analysis of SRS images of lignin in secondary xylem cell walls in poplar. a Image settings. Intensity analyses for specific types of cell walls can be performed in Fiji software. Open the selected picture and change the image to 8 bit. b Calculate the average photon counts for all measurements. Click on “Analyze” and select “Histogram” to calculate the average photon counts for all measurements. c, d Obtain the ratio of the intensity value. Click on “List” to view the intensity values and counts. The total intensity values will be divided into 256 parts. From the 0 to 255 value, the intensity counts will be calculated for every tenth value. Then the ratio of the intensity value will be obtained by dividing the sum of ten counts by the total counts. e, f Calculate the average intensity for selected cells. For each type of plant sample, at least three images were selected for intensity analysis. About 50 cells were selected for further analysis. Click on “Analyze” and select “Measure” to calculate the average intensity for selected cells. Lignin (1600 cm−1) signals in each pixel are plotted
Fig. 7
Fig. 7
Example of quantification of lignin in stems using SRS images. SRS images of wild-type (WT) and 35S:MIR408-overexpressing poplar plants acquired at 1600 cm−1, showing the lignin distribution. Color code indicates an increase of the signal intensity from blue to red. Scale bars = 50 µm

Similar articles

Cited by

References

    1. Saar BG, Zeng Y, Freudiger CW, Liu YS, Himmel ME, Xie XS, et al. Label-free, real-time monitoring of biomass processing with stimulated Raman scattering microscopy. Angew Chem Inter Edit. 2010;49:5476–5479. doi: 10.1002/anie.201000900. - DOI - PubMed
    1. Sarkar P, Bosneaga E, Auer M. Plant cell walls throughout evolution: towards a molecular understanding of their design principles. J Exp Bot. 2009;60:3615–3635. doi: 10.1093/jxb/erp245. - DOI - PubMed
    1. Zeng YN, Himmel ME, Ding SY. Visualizing chemical functionality in plant cell walls. Biotechnol Biofuels. 2017;10:263. doi: 10.1186/s13068-017-0953-3. - DOI - PMC - PubMed
    1. Ding SY, Himmel ME. The maize primary cell wall microfibril: a new model derived from direct visualization. J Agric Food Chem. 2006;54:597–606. doi: 10.1021/jf051851z. - DOI - PubMed
    1. Lee KJD, Marcus SE, Knox JP. Cell wall biology: perspectives from cell wall imaging. Mol Plant. 2011;4:212–219. doi: 10.1093/mp/ssq075. - DOI - PubMed

LinkOut - more resources