. 2021 Mar 19;40(1):106.
doi: 10.1186/s13046-021-01907-9.

MZ1 co-operates with trastuzumab in HER2 positive breast cancer

Affiliations

MZ1 co-operates with trastuzumab in HER2 positive breast cancer

María Del Mar Noblejas-López et al. J Exp Clin Cancer Res. .

Abstract

Background: Although the anti-HER2 antibody trastuzumab augments patient survival in HER2+ breast cancer, a relevant number of patients progress to this treatment. In this context, novel drug combinations are needed to increase its antitumor activity. In this work, we have evaluated the efficacy of proteolysis targeting chimera (PROTAC) compounds based on BET inhibitors (BETi) to augment the activity of trastuzumab in HER2+ breast cancer models.

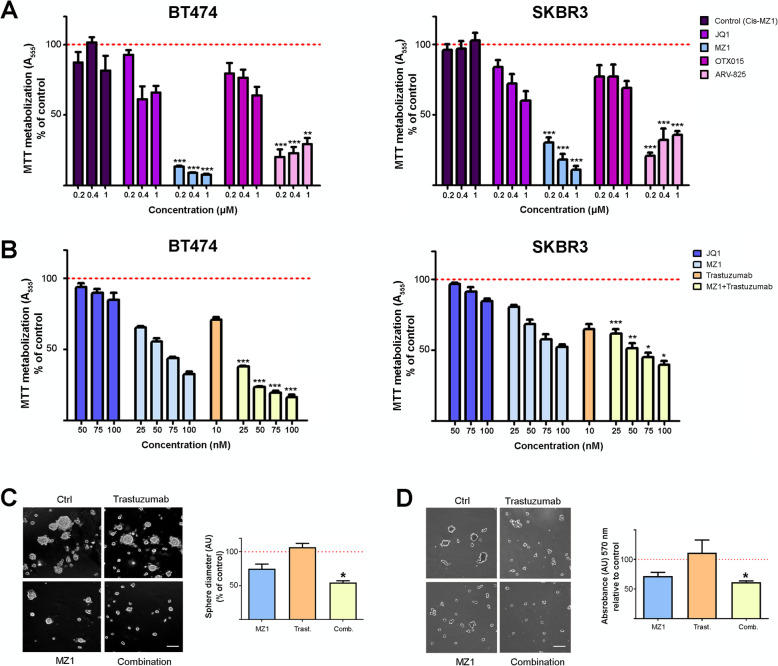
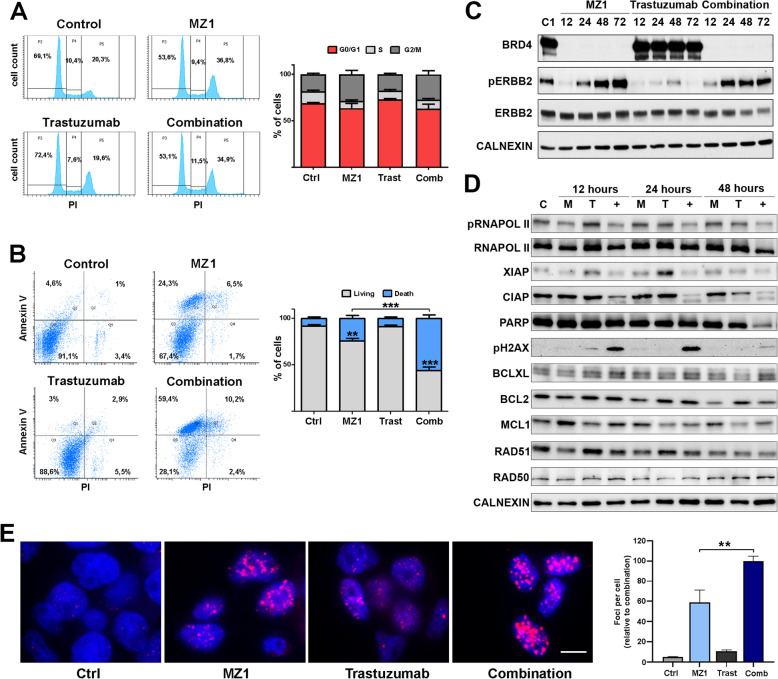
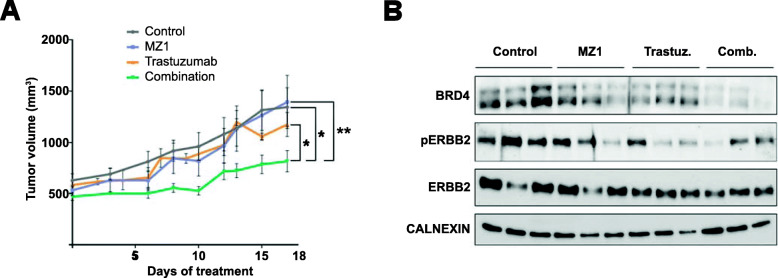
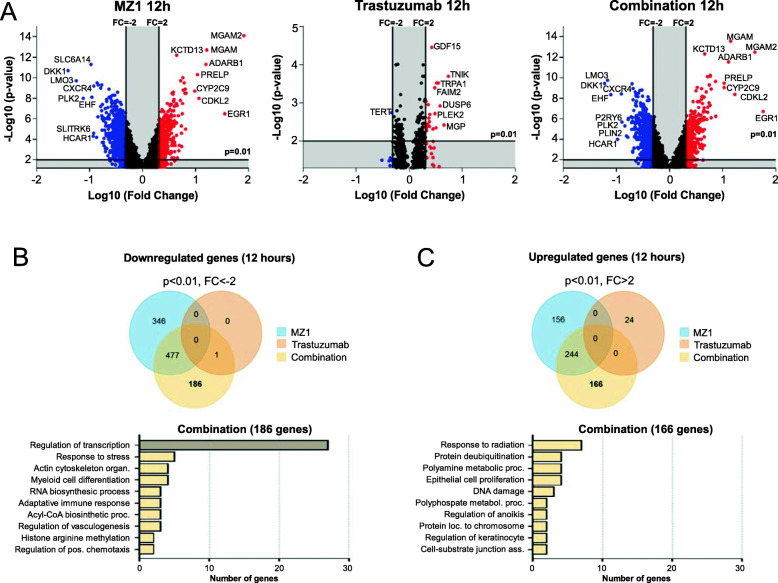
Methods: BT474 and SKBR3 HER2+ breast cancer cell lines were used. The effects of trastuzumab and the BET-PROTAC MZ1 either alone or in combination, were evaluated using MTT proliferation assays, three-dimensional invasion and adhesion cultures, flow cytometry, qPCR and Western blot. In vivo studies were carried out in a xenografted model in mice. Finally, a Clariom_S_Human transcriptomic array was applied to identify deregulated genes after treatments.

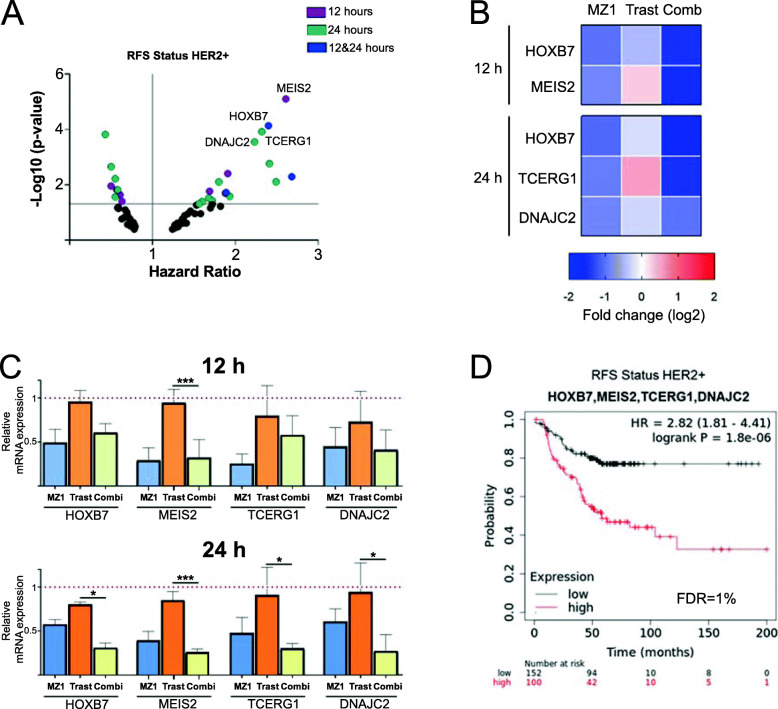
Results: MZ1 induced a higher antiproliferative effect compared to the BETi JQ1. The combination of MZ1 and -trastuzumab significantly decreased cell proliferation, the formation of three-dimensional structures and cellular invasion compared to either of the drugs alone. Evaluation of apoptosis resulted in an increase of cell death following treatment with the combination, and biochemical studies displayed modifications of apoptosis and DNA damage components. In vivo administration of agents alone or combined, to tumors orthotopically xenografted in mice, resulted in a decrease of the tumor volume only after MZ1-Trastuzumab combination treatment. Results from a transcriptomic array indicated a series of newly described transcription factors including HOXB7, MEIS2, TCERG1, and DNAJC2, that were associated to poor outcome in HER2+ breast cancer subtype and downregulated by the MZ1-trastuzumab combination.

Conclusions: We describe an active novel combination that includes the BET-PROTAC MZ1 and trastuzumab, in HER2+ tumors. Further studies should be performed to confirm these findings and pave the way for their future clinical development.

Keywords: ERBB2; HER2+ breast cancer; MZ1; PROTACs; Trastuzumab.


Conflict of interest statement

The authors declare no conflict of interest.

Figures

Fig. 1
Fig. 1
Evaluation of antitumoral activities of MZ1 and the MZ1-Trastuzumab combination in HER2+ breast cancer lines. a Cell viability evaluated by MTT assays for BT474 (left) and SKBR3 (right) cells treated with JQ1, OTX015, and their respective PROTACs (MZ1 and ARV-825) at the doses indicated (72 h). Cis-MZ1 was used as control. b Cell viability evaluated by MTT assays for BT474 (left) and SKBR3 (right) cells treated with JQ1, MZ1, trastuzumab and the MZ1-trastuzumab combination at the doses indicated (72 h). c BT474 cells were seeded in a Matrigel matrix and treated with MZ1 (100 nM), trastuzumab (10 nM) or the MZ1-trastuzumab combination treatments were applied (72 h). Invasion capacity was assessed by measuring sphere diameters of invading 3D structures, and results are presented as percentage referred to untreated cells. Scale bar = 100 μm. d Cell adhesion to poly-lysine substrate after 24 h exposure to MZ1 (100 nM), trastuzumab (10 nM) and the MZ1-trastuzumab combination. BT474 cells were treated, trypsinized, and seeded, and percentage of cells adhered to plaque referred to untreated cells after 1 h is presented. Scale bar = 100 μm. *p < 0.05; **p < 0.01; ***p < 0.001
Fig. 2
Fig. 2
Mechanism of action of MZ1-Trastuzumab combination. a BT474 cells were treated with MZ1 (100 nM), trastuzumab (10 nM) or the MZ1-trastuzumab combination for 24 h and cell cycle was evaluated by flow cytometry. Left, flow cytometry plots (Annexin V (AV, y axis) and propidium iodure (PI, x axis). Right, bar graphs show the percentage of cells in G0/G1, S, or G2/M cell cycle phases. b BT474 cells were treated with MZ1 (100 nM), trastuzumab (10 nM) or the MZ1-trastuzumab combination for 72 h and cell death was evaluated by flow cytometry with Annexin V (AV) and propidium iodure (PI) staining. Left, flow cytometry plots (Q3, living (AV -, PI -); Q1, early apoptosis (AV +, PI -); Q2, late apoptosis (AV +, PI +); Q4, necrotic (AV-, PI+). Right, bar graphs show the percentage of cells classified in living (AV -, PI -), and death (AV +, PI -, AV +, PI +, AV-, PI+). c Western blot showing expression levels of BRD4, pERBB2 and ERBB2 in BT474 cells treated with MZ1, trastuzumab, combination or left untreated at the times indicated. d Western blot showing expression level of proteins related to apoptosis and DNA damage in BT474 cells treated with MZ1, trastuzumab, combination or left untreated after 12, 24 and 48 h. e Fluorescence images showing pH2AX immunoreactivity (magenta) and DNA staining (blue) were obtained by epifluorescence microscopy after MZ1 (100 nM), trastuzumab (10 nM) or the MZ1-trastuzumab combination treatment in BT474 cells. Bar graphs indicate the number of pH2AX foci per cell quantified using ImageJ. Scale bar = 10 μm. *p < 0.05, **p < 0.01, ***p < 0.001
Fig. 3
Fig. 3
In vivo analysis of xenografted tumors treated with MZ1, trastuzumab or MZ1-trastuzumab. a Graphical representation of the tumor volumes (mm3) of BT474-derived tumors treated with either MZ1 (10 mg/kg), trastuzumab (30 mg/Kg) or MZ1-trastuzumab combination along the days of treatment. Mean of tumor volume ± SEM is indicated. b Western blot showing the expression levels of BRD4, pERBB2 and ERBB2 in tumors treated with MZ1, trastuzumab, combination or left untreated. *p < 0.05; **p < 0.01 (t-test one-tail, unpaired)
Fig. 4
Fig. 4
Analysis of a transcriptomic array in cells treated with MZ1, trastuzumab or MZ1-trastuzumab (12 h). a Volcano plots (p-value (−log 10) vs Fold Change (log10)) of BT474 cells gene expression profile after 12 h treatment with MZ1, trastuzumab, and combination. Upregulated genes (FC > 2) are show in red and downregulated genes (FC < -2) are show in blue. b Venn diagram showing the number of downregulated genes in each treatment condition using p-value< 0.01 and FC < -2 as threshold. Bottom bar graph, functional analyses of the 186 altered genes after combination treatment using EnrichR Online Tool. Biological process gene ontologies (p < 0.01) grouped are shown. c Venn diagram showing the number of upregulated genes in each treatment condition using p-value < 0.01 and FC < -2 as threshold. Bottom bar graph, functional analyses of the 166 altered genes after combination treatment using EnrichR Online Tool. Biological process gene ontologies (p < 0.01) grouped are shown
Fig. 5
Fig. 5
Identification of transcription factors downregulated with the combination. a p Value vs Hazard Ratio graph indicating transcription factors altered after combination treatment at 12, 24 h or both. Relapse Free Survival (RFS) for HER2+ status on the online tool Kaplan-Meier plotter was applied. Genes with no association prognosis value (p > 0.05) are shown in black. b Expression level heat map of the transcription factors identified (HOXB7, MEIS2, TCERG1, DNAJC2) after 12 and/or 24 h of treatment with MZ1, trastuzumab, and combination. c, mRNA expression levels of transcription factor identified genes after 12 or 24 h of treatment with the MZ1, trastuzumab, and combination. *p < 0.05; **p < 0.01; ***p < 0.005. d Kaplan-Meier survival plots of the combined selected genes (HOXB7, MEIS2, TCERG1, DNAJC2) signature expression level and patient prognosis in RFS and HER2+ status conditions

Similar articles

Cited by

References

    1. Slamon DJ, Godolphin W, Jones LA, Holt JA, Wong SG, Keith DE, Levin W, Stuart S, Udove J, Ullrich A, et al. Studies of the HER-2/neu proto-oncogene in human breast and ovarian cancer. Science. 1989;244(4905):707–712. doi: 10.1126/science.2470152. - DOI - PubMed
    1. Ocaña A, Pandiella A. Targeting HER receptors in cancer. Curr Pharm Des. 2013;19(5):808–817. doi: 10.2174/138161213804547303. - DOI - PubMed
    1. García-Alonso S, Ocaña A, Pandiella A. Trastuzumab emtansine: mechanisms of action and resistance, clinical progress, and beyond. Trends Cancer. 2020;6(2):130–146. doi: 10.1016/j.trecan.2019.12.010. - DOI - PubMed
    1. Shu S, Polyak K. BET bromodomain proteins as cancer therapeutic targets. Cold Spring Harb Symp Quant Biol. 2016;81:123–129. doi: 10.1101/sqb.2016.81.030908. - DOI - PubMed
    1. Khandekar D, Tiriveedhi V. Role of BET inhibitors in triple negative breast cancers. Cancers. 2020;12(4). 10.3390/cancers12040784. - PMC - PubMed