Observational Study
. 2021 Mar 19;25(1):112.
doi: 10.1186/s13054-021-03520-w.

Identification of novel sublingual parameters to analyze and diagnose microvascular dysfunction in sepsis: the NOSTRADAMUS study

Affiliations
Observational Study

Identification of novel sublingual parameters to analyze and diagnose microvascular dysfunction in sepsis: the NOSTRADAMUS study

Alexandros Rovas et al. Crit Care. .

Abstract

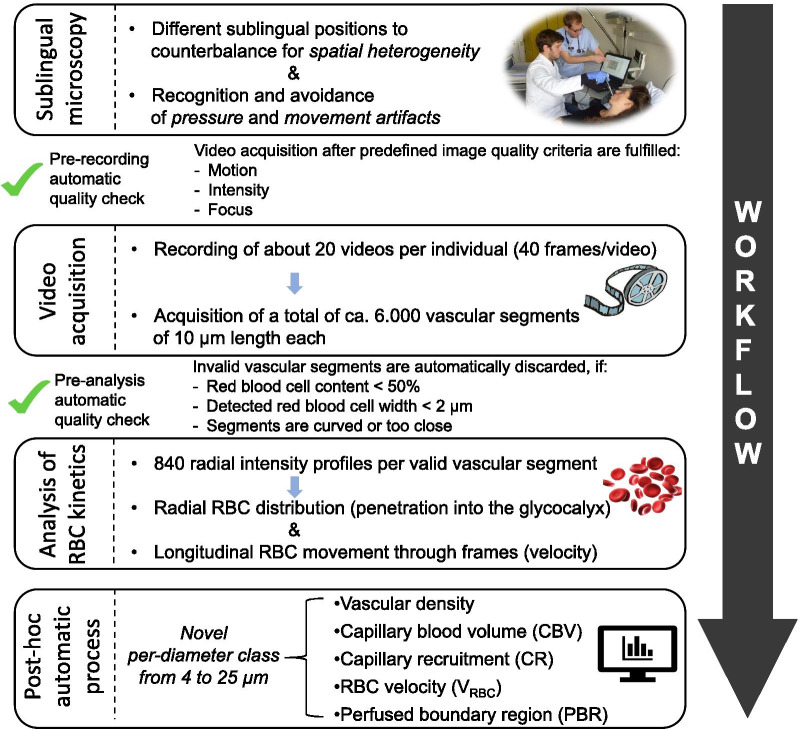
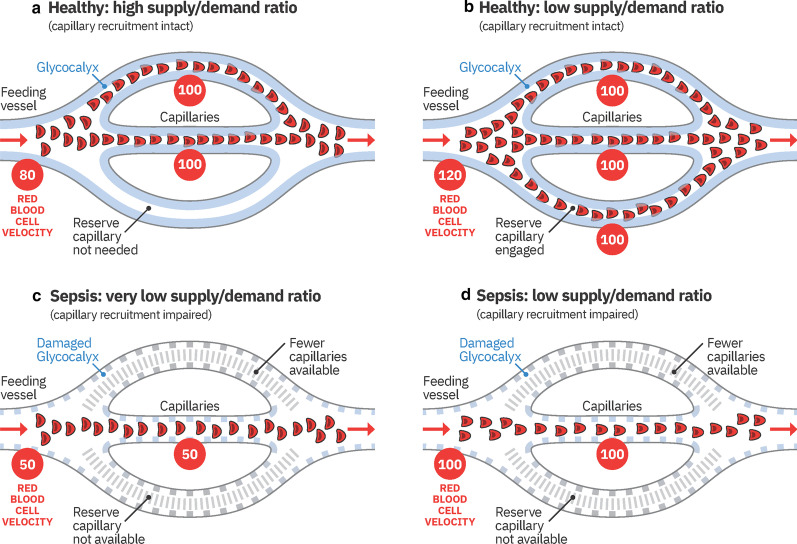
Background: The availability of handheld, noninvasive sublingual video-microscopes allows for visualization of the microcirculation in critically ill patients. Recent studies demonstrate that reduced numbers of blood-perfused microvessels and increased penetration of erythrocytes into the endothelial glycocalyx are essential components of microvascular dysfunction. The aim of this study was to identify novel microvascular variables to determine the level of microvascular dysfunction in sepsis and its relationship with clinical variables.

Methods: This observational, prospective, cross-sectional study included 51 participants, of which 34 critically ill sepsis patients were recruited from intensive care units of a university hospital. Seventeen healthy volunteers served as controls. All participants underwent sublingual videomicroscopy by sidestream darkfield imaging. A new developed version of the Glycocheck™ software was used to quantify vascular density, perfused boundary region (PBR-an inverse variable of endothelial glycocalyx dimensions), red blood cell (RBC) velocity, RBC content, and blood flow in sublingual microvessels with diameters between 4 and 25 µm.

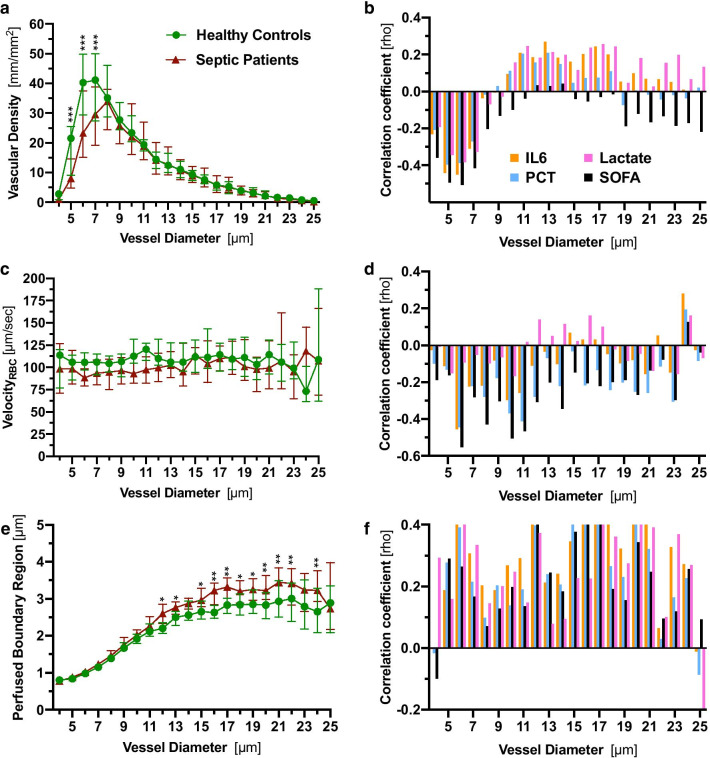
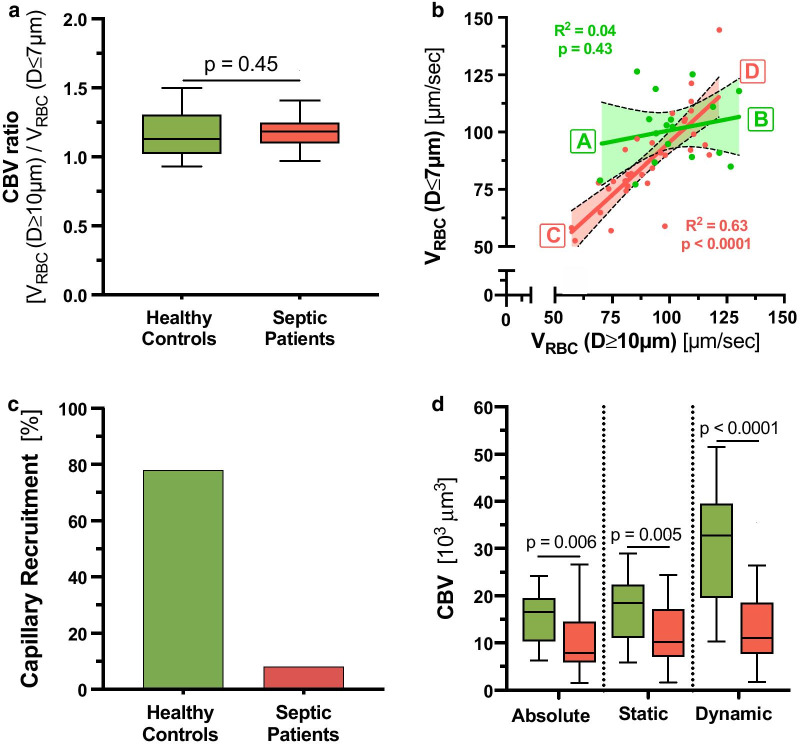
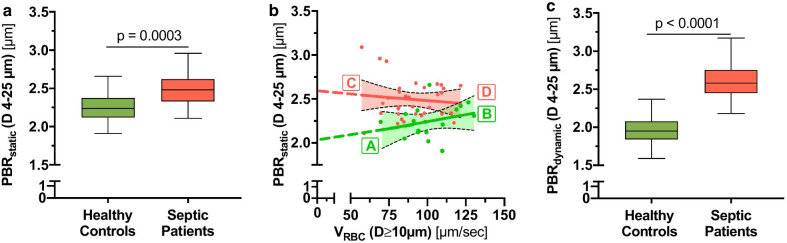
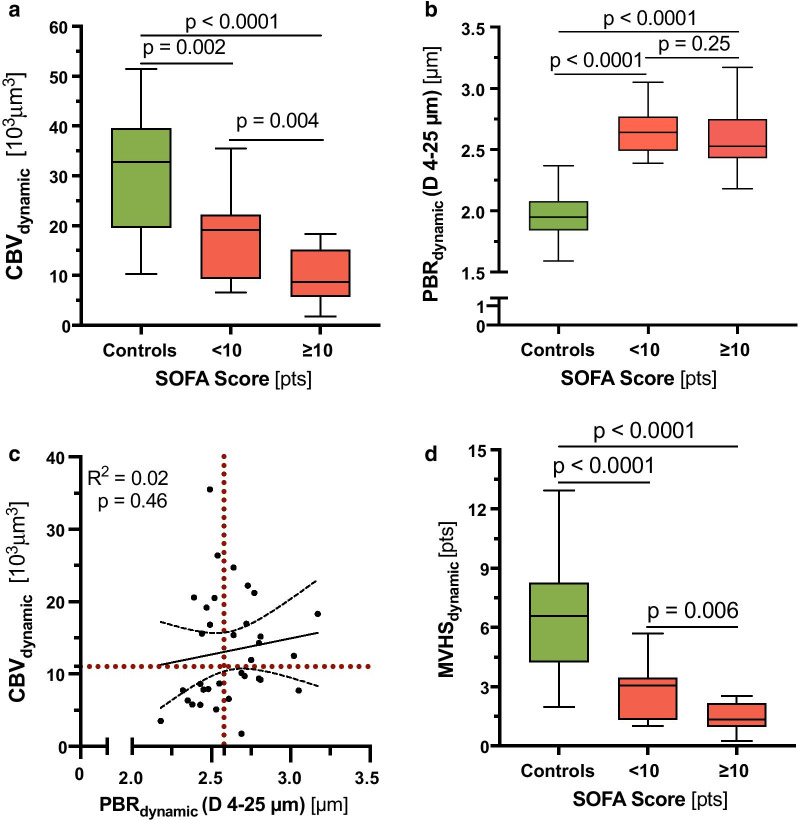
Results: A detailed analysis of adjacent diameter classes (1 µm each) of vessels between 4 and 25 µm revealed a severe reduction of vascular density in very small capillaries (5-7 µm), which correlated with markers of sepsis severity. Analysis of RBC velocity (VRBC) revealed a strong dependency between capillary and feed vessel VRBC in sepsis patients (R2 = 0.63, p < 0.0001) but not in healthy controls (R2 = 0.04, p = 0.43), indicating impaired capillary (de-)recruitment in sepsis. This finding enabled the calculation of capillary recruitment and dynamic capillary blood volume (CBVdynamic). Moreover, adjustment of PBR to feed vessel VRBC further improved discrimination between sepsis patients and controls by about 50%. By combining these dynamic microvascular and glycocalyx variables, we developed the microvascular health score (MVHSdynamic™), which decreased from 7.4 [4.6-8.7] in controls to 1.8 [1.4-2.7] in sepsis patients (p < 0.0001) and correlated with sepsis severity.

Conclusion: We introduce new important diameter-specific quantification and differentiated analysis of RBC kinetics, a key to understand microvascular dysfunction in sepsis. MVHSdynamic, which has a broad bandwidth to detect microvascular (dys-) function, might serve as a valuable tool to detect microvascular impairment in critically ill patients.

Keywords: Capillary recruitment; Endothelial glycocalyx; Microvascular health score; Perfused boundary region; Sepsis.


Conflict of interest statement

AR, JS, JR, SK, HP, and PK declare that they have no competing interests. HV is Chief Science Officer of GlycoCheck™ BV, The Netherlands. GlycoCheck™ and MVHS™ are trademarks registered by Microvascular Health Solutions LLC (Alpine, UT, United States).

Figures

Fig. 1
Fig. 1
Flowchart showing the process of video acquisition and data analysis. D = Vessel Diameter, in µm
Fig. 2
Fig. 2
Analysis of sublingual microcirculation according to vessel diameter class. a, c, e Median and IQR values of vascular density, PBRstatic values and RBC velocity of healthy controls and sepsis patients according to diameter class from 4 to 25 µm. b, d, f Bar charts showing the correlation coefficient (Spearman) between microvascular and clinical variables. IQR inter quartile range, IL6 interleukin 6, PBR perfused boundary region, PCT procalcitonin, RBC red blood cell, SOFA score sequential organ failure assessment score. Q value (adjusted p value): *q < 0.05, **q < 0.01, ***q < 0.001
Fig. 3
Fig. 3
Derivation of capillary recruitment and dynamic capillary blood volume. a Box plots showing capillary blood volume (CBV) ratio in healthy controls (green) and sepsis patients (red). CBV ratio denotes the RBC velocity (VRBC) in feed vessels (D ≥ 10 µm) over VRBC in capillaries (D ≤ 7 µm). b Scatter dot plots and simple linear regression (slope) with 95% confidence intervals of VRBC in capillaries (D ≤ 7 µm) plotted against VRBC in feed vessels (D ≥ 10 µm). Different states at the ends of the slope lines (indicated by green/red bold letters A-D) are further explained in Fig. 5. c Bar charts showing the capillary recruitment (CR), defined as 1 − slope (VRBC (D ≤ 7 µm) vs. VRBC (D ≥ 10 µm)) per group. d Box plots showing the development of different measures and estimates of CBV. Left: CBVabsolute is determined from the number of capillary segments multiplied by capillary segment length (i.e., capillary density (mm/mm2)) and segment-specific capillary cross-sectional area (π * radius2). Briefly, as each vascular segment can be considered a cylinder, the segment-specific capillary cross-sectional area can be calculated with the mathematical type π * radius2 (circle’s area). The radius is estimated every 10 µm (segment’s length) and recorded accordingly. Middle: CBVstatic is calculated as CBVabsolute * VRBC (D ≥ 10 µm)/VRBC (D ≤ 7 µm). Right: CBVdynamic is defined as CBVstatic * (1 + CR). RBC red blood cell, CBV capillary blood volume, CR capillary recruitment, D diameter, V velocity
Fig. 4
Fig. 4
Derivation of an RBC velocity-adjusted perfused boundary region. a Box plots showing PBRstatic (D 4 to 25 µm) in healthy controls (green) and sepsis patients (red). b Scatter dot plots and simple linear regression (slope) with 95% confidence intervals of PBRstatic (D 4 to 25 µm) plotted against VRBC in feed vessels (D ≥ 10 µm). Different states at the ends of the slope lines (indicated by green/red bold letters A-D) are further explained in Fig. 6. c Box plots of PBRdynamic, a velocity-adjusted estimate of the PBR where the VRBC (D ≥ 10 µm) was set to 0 µm/s. RBC red blood cell, CBV capillary blood volume, D diameter, V velocity
Fig. 5
Fig. 5
Association of the CBVdynamic, PBRdynamic and dynamic Microvascular Health Score (MVHSdynamic) with disease severity. Association of a CBVdynamic and b PBRdynamic with sequential organ failure assessment score (SOFA) score after dichotomizing (median) the sepsis group. c Scatter dot plots and simple linear regression (slope) with 95% confidence intervals of CBVdynamic plotted against PBRdynamic (D 4 to 25 µm) in the septic population. The red dotted lines represent the median values of CBV and PBR, respectively. d Association of MVHSdynamic with sequential organ failure assessment score (SOFA) score after dichotomizing (median) the group
Fig. 6
Fig. 6
Cartoon showing the pathophysiologic concept of capillary (de-)recruitment in healthy conditions (a, b) and during sepsis (c, d). The respective ends of the spectrum of actual measured RBC velocities are indicated in the red circles. Conditions shown in A-D refer to corresponding green/red bold letters in Fig. 3B). In theory, higher RBC velocity states (low supply demand ratio, b, d) should go along with slightly thicker glycocalyx than lower RBC velocity states (high supply demand ration a, b). Furthermore, RBC flux is actually controlled by arterioles rather than precapillary sphincters. These details have been omitted for the sake of clarity

Comment in

  • [Focus general intensive care medicine. Intensive care studies from 2020/2021].
    Dietrich M, Beynon C, Fiedler MO, Bernhard M, Kümpers P, Hecker A, Jungk C, Nusshag C, Michalski D, Brenner T, Weigand MA, Reuß CJ. Dietrich M, et al. Anaesthesist. 2021 Oct;70(10):888-894. doi: 10.1007/s00101-021-00976-x. Epub 2021 Jul 29. Anaesthesist. 2021. PMID: 34324037 Free PMC article. German. No abstract available.

References

    1. Ince C, De Backer D, Mayeux PR. Microvascular Dysfunction in the Critically Ill. Crit Care Clin. 2020;36(2):323–331. doi: 10.1016/j.ccc.2019.11.003. - DOI - PubMed
    1. Pool R, Gomez H, Kellum JA. Mechanisms of Organ Dysfunction in Sepsis. Crit Care Clin. 2018;34(1):63–80. doi: 10.1016/j.ccc.2017.08.003. - DOI - PMC - PubMed
    1. Rossaint J, Zarbock A. Pathogenesis of Multiple Organ Failure in Sepsis. Crit Rev Immunol. 2015;35(4):277–291. doi: 10.1615/critrevimmunol.2015015461. - DOI - PubMed
    1. Bezemer R, Bartels SA, Bakker J, Ince C. Clinical review: Clinical imaging of the sublingual microcirculation in the critically ill–where do we stand? Crit Care. 2012;16(3):224. doi: 10.1186/cc11236. - DOI - PMC - PubMed
    1. De Backer D. Is microcirculatory assessment ready for regular use in clinical practice? Curr Opin Crit Care. 2019;25(3):280–284. doi: 10.1097/MCC.0000000000000605. - DOI - PubMed

Publication types