. 2021:30:102600.
doi: 10.1016/j.nicl.2021.102600. Epub 2021 Mar 16.

Brain/MINDS beyond human brain MRI project: A protocol for multi-level harmonization across brain disorders throughout the lifespan

Affiliations

Brain/MINDS beyond human brain MRI project: A protocol for multi-level harmonization across brain disorders throughout the lifespan

Shinsuke Koike et al. Neuroimage Clin. 2021.

Abstract

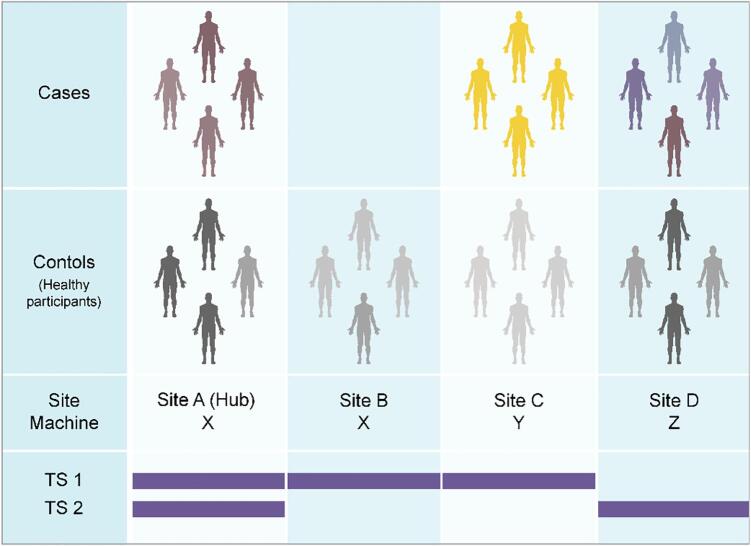
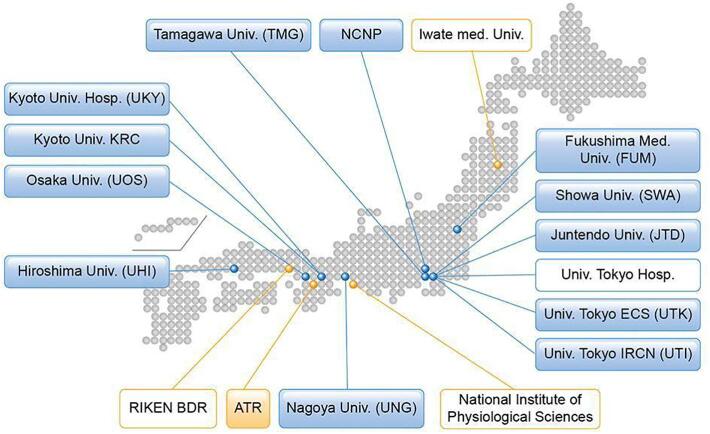
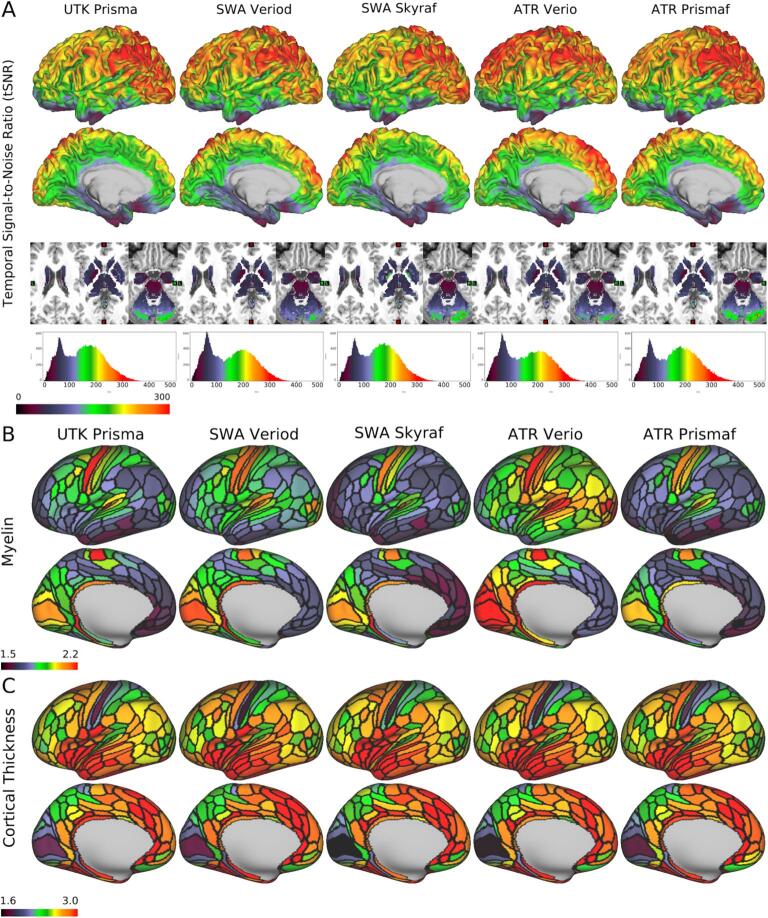
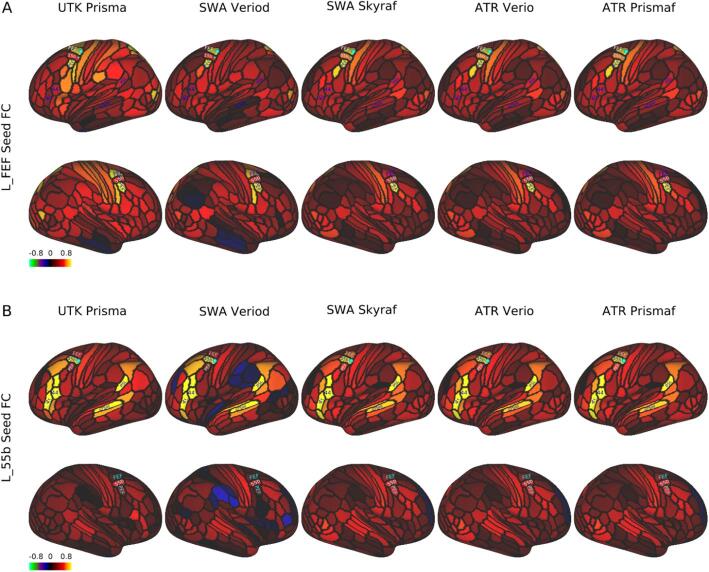
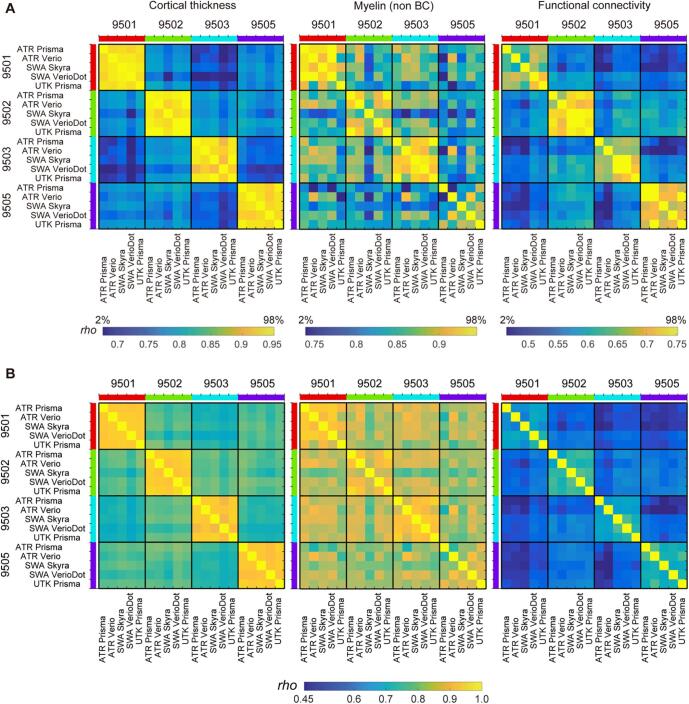
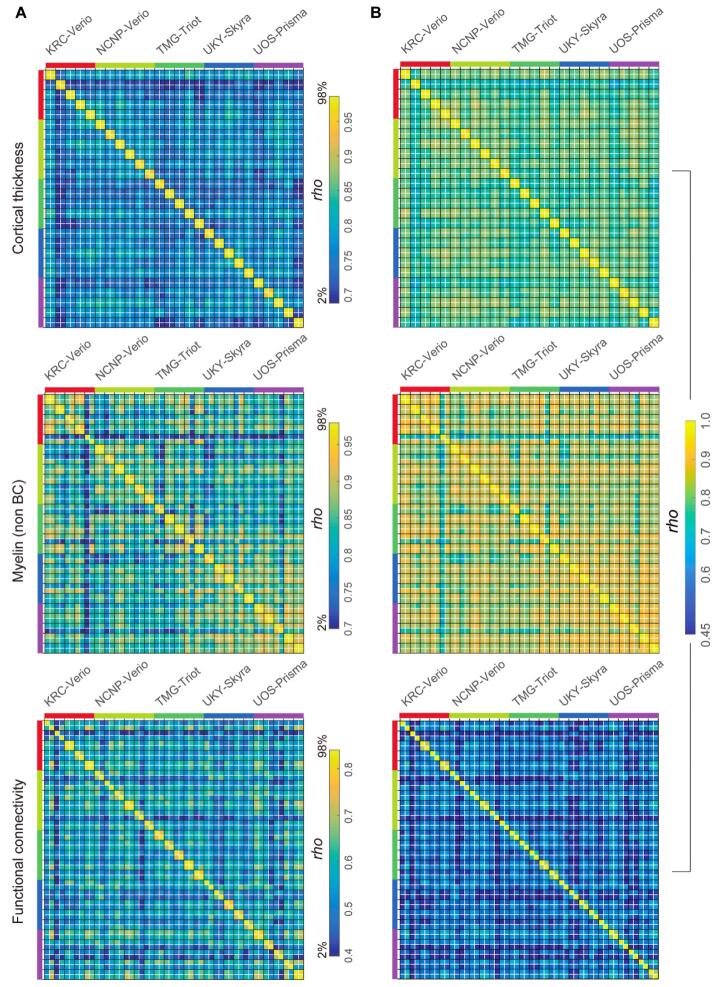
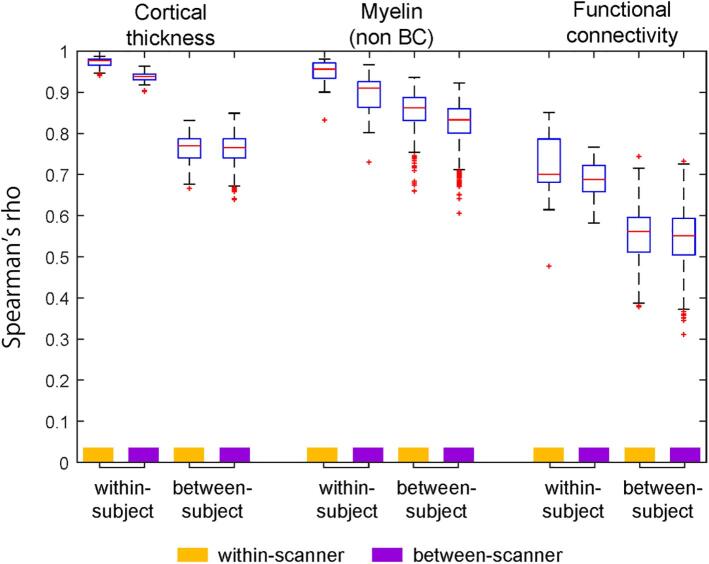
Psychiatric and neurological disorders are afflictions of the brain that can affect individuals throughout their lifespan. Many brain magnetic resonance imaging (MRI) studies have been conducted; however, imaging-based biomarkers are not yet well established for diagnostic and therapeutic use. This article describes an outline of the planned study, the Brain/MINDS Beyond human brain MRI project (BMB-HBM, FY2018 ~ FY2023), which aims to establish clinically-relevant imaging biomarkers with multi-site harmonization by collecting data from healthy traveling subjects (TS) at 13 research sites. Collection of data in psychiatric and neurological disorders across the lifespan is also scheduled at 13 sites, whereas designing measurement procedures, developing and analyzing neuroimaging protocols, and databasing are done at three research sites. A high-quality scanning protocol, Harmonization Protocol (HARP), was established for five high-quality 3 T scanners to obtain multimodal brain images including T1 and T2-weighted, resting-state and task functional and diffusion-weighted MRI. Data are preprocessed and analyzed using approaches developed by the Human Connectome Project. Preliminary results in 30 TS demonstrated cortical thickness, myelin, functional connectivity measures are comparable across 5 scanners, suggesting sensitivity to subject-specific connectome. A total of 75 TS and more than two thousand patients with various psychiatric and neurological disorders are scheduled to participate in the project, allowing a mixed model statistical harmonization. The HARP protocols are publicly available online, and all the imaging, demographic and clinical information, harmonizing database will also be made available by 2024. To the best of our knowledge, this is the first project to implement a prospective, multi-level harmonization protocol with multi-site TS data. It explores intractable brain disorders across the lifespan and may help to identify the disease-specific pathophysiology and imaging biomarkers for clinical practice.

Keywords: HCP-style brain imaging; Harmonization protocol; Multi-site study; Neurological disorders; Psychiatric disorders; Traveling subjects.


Figures

Fig. 1
Fig. 1
Case-control studies and traveling subject approach. (Top) When we analyze multi-site data from a set of case-control MRI studies, we must consider machine and protocol-derived bias (measurement bias) as well as sampling bias (from biological differences in the sampled populations). Even if the scanner and protocol are the same between sites (e.g. Sites A and B), measurement bias may still occur because of slight differences in the magnetic or radiofrequency fields, etc. Sampling bias should be considered for patient groups as well as control groups, given that the control participants were recruited according to the demographics in the patient group. (Bottom) The traveling subject (TS) harmonization approach enables us to combine with case-control datasets by differentiating between measurement and sampling biases (Yamashita et al., 2019). To reduce the effort of TS participants and participating sites, the current project applies a hub-and-spoke design to the TS project. With this approach, multiple sets of participants, scanner, protocol data can be efficiently collected, and measurement bias is properly estimated using a GLMM for grouped and repeated datasets (TS 1 and 2).
Fig. 2
Fig. 2
Brain/MINDS Beyond human brain MRI project. Institutes in the blue boxes show measurement and analysis sites for neuropsychiatric disorders, and those in the orange boxes show analysis support sites. Institutes listed in boxes with a colored background represent participation in the traveling subject project. (For interpretation of the references to color in this figure legend, the reader is referred to the web version of this article.)
Fig. 3
Fig. 3
Expected and current data connection of the traveling subjects (TS). Data connections in the traveling subject project (TS) that were initially planned (A) and the actual connections as of March 2020 (B). Hub sites using Prisma and other sites using Prisma, Skyra, Trio A Tim, Verio Dot, and Verio are illustrated in red, orange, blue, green, purple, and pink, respectively. (For interpretation of the references to color in this figure legend, the reader is referred to the web version of this article.)
Fig. 4
Fig. 4
Data storage, preprocessing, quality check, and data sharing. MRI (black line) and clinical (blue line) data from G1-1D and G1-1A sites are sent to the XNAT server and a data server at ATR and UTI, respectively. All data from G1-1S sites are sent to an XNAT server and a data server managed by NCNP, as this group applied a standard clinical assessment protocol to the project following a previous multi-site study. Traveling subject data from G1-1S sites are also sent to the XNAT server in ATR (dot line). XNAT servers at NCNP, ATR, and RIKEN BDR are linked by Amazon AWS to share the imaging data. NCNP manages a separate server for storing clinical data (Clin DB) being collected from the participants in this project. All MR images are preprocessed at RIKEN BDR. All MR images are preprocessed at RIKEN BDR. All the raw and preprocessed data will be stored and provided to the users in a distribution server. A backup server will be placed at a different site. (For interpretation of the references to color in this figure legend, the reader is referred to the web version of this article.)
Fig. 5
Fig. 5
Quality of MRI and preliminary cortical structures obtained by HARP in a single traveling subject across scanners/sites. A) Temporal signal-to-noise ratio (tSNR) obtained in a single subject (ID = 9503) across different scanners/sites by a harmonized MRI protocol (a sequence of functional MRI in HARP using a multi-band echo planar imaging with TR/TE = 800/34.4 ms; see Supplementary Table S1 for other details). The images from top to bottom show color-coded tSNR maps in 32 k greyordinates (see main text) overlaid on the lateral and medial surface of the mid-thickness surface of the left hemisphere, the subcortical sections of the T1w image, and the histogram of the tSNR values. B) Cortical myelin contrast (T1w/T2w ratio) across different scanners. The myelin contrast is not corrected for the biasfield and parcellated by the HCP MMP v1.0 (Glasser et al., 2016a). C) The map shows cortical thickness across different scanners. Cortical thickness is corrected by curvature and parcellated by the HCP MMP v1.0. The tSNR, myelin map and cortical thickness are comparable across scanners. Data at https://balsa.wustl.edu/7q4P9 and https://balsa.wustl.edu/6Vvqv.
Fig. 6
Fig. 6
Seed-based resting-state functional connectivity in a single traveling subject across scanners/sites. In a single subject (ID = 9503), the resting-state fMRI scans (5 min × 4) were collected using a scanning protocol of HARP across different scanners/sites (see Supplementary Table S1), preprocessed, and denoised by a surface-based analysis to generate parcellated functional connectivity (FC) using the HCP MMP v1.0 (Glasser et al., 2016a). A) FC seeded from the left frontal eye field (FEF), which was distributed symmetrically in the bilateral premotor eye field (PEF) and comparable across scanners/sites. B) FC seeded from the left area 55b, which showed an asymmetric language network predominant in the left hemisphere that was comparable across scanners/sites. The language network is distributed in the areas of 44/45, superior temporal sulcus, dorsal posterior part (STSdp), and perisylvian language (PSL). Data at https://balsa.wustl.edu/1B9VG and https://balsa.wustl.edu/5Xr71.
Fig. 7
Fig. 7
Similarity of the cortical metrics across subjects and sites/scanners in preliminary travelling subject study. From left to right shows the correlation matrices of the parcellated cortical thickness, myelin (non BC) and functional connectivity in four travelling subjects (TS), scanned by five scanners/sites. In the upper row (A), color ranges are scaled by the distribution of the correlation coefficients (2% to 98% of histogram) to highlight the contrast between ‘within-subject’ similarities and ‘across-subject’ similarities, while in the lower row (B) color ranges are scaled by the same absolute values across all three modalities. There were 360 parcellated values for thickness and myelin and 129,240 parcellated values for functional connectivity, which cover the cerebral cortex in both hemispheres. Spearman’s correlation coefficient (rho) is shown using a color bar placed at the bottom. Non BC: non biasfield corrected.
Fig. 8
Fig. 8
Test-retest and cross-subject similarity of cortical thickness, myelin (non BC) and resting-state functional connectivity (FC). The matrices show the similarity for each brain metric (top cortical thickness; middle, myelin (no bias corrected, BC); bottom, functional connectivity) using a total N = 26 traveling subjects obtained at five sites/scanners. The black line separates different subjects’ data, while white line test–retest (within-subject) data. The left column in (A) shows matrices with color ranges scaled by the distribution of the correlation coefficients (2% to 98% of histogram) to highlight contrast of ‘test-retest’ similarities as compared with those of ‘between-scanner or between-subject’. The right column (B) shows those with color-range scaled by the same absolute values across three modalities. Note that 2x2 correlation matrix that is within a black square and is adjacent to the diagonal indicates similarity of a single subject’s test–retest data and is excellent in structure (thickness and myelin) and fairly good in FC. The different sites are colored along the left and top edges.
Fig. 9
Fig. 9
The summarized plots of similarity of cortical metrics in TS30. The plot summarizes the similarity (Spearman’s rho) of the cortical metrics. The similarity measures were from those in Fig. 7, Fig. 8, and classified into four types: within-subject & within-scanner (Subject N = 26, combination n = 16); within-subject & between-scanner (Subject N = 4, combination n = 40); between-subject & within-scanner (Subject N = 30, combination n = 250); and between-subject & between-scanner (Subject N = 30, combination n = 1200), where the combination n denotes a total number of similarity values used for statistics in the matrices in Fig. 7, Fig. 8. Non BC: non biasfield corrected.

Similar articles

Cited by

References

    1. Amiez C., Petrides M. Anatomical organization of the eye fields in the human and non-human primate frontal cortex. Prog. Neurobiol. 2009;89:220–230. - PubMed
    1. Andersson J.L., Skare S., Ashburner J. How to correct susceptibility distortions in spin-echo echo-planar images: application to diffusion tensor imaging. Neuroimage. 2003;20:870–888. - PubMed
    1. Andersson J.L.R., Graham M.S., Drobnjak I., Zhang H., Campbell J. Susceptibility-induced distortion that varies due to motion: correction in diffusion MR without acquiring additional data. Neuroimage. 2018;171:277–295. - PMC - PubMed
    1. Andersson J.L.R., Graham M.S., Drobnjak I., Zhang H., Filippini N., Bastiani M. Towards a comprehensive framework for movement and distortion correction of diffusion MR images: within volume movement. Neuroimage. 2017;152:450–466. - PMC - PubMed
    1. Andersson J.L.R., Sotiropoulos S.N. An integrated approach to correction for off-resonance effects and subject movement in diffusion MR imaging. Neuroimage. 2016;125:1063–1078. - PMC - PubMed

Publication types