Review
. 2021 Apr 23;8(2):ENEURO.0418-20.2020.
doi: 10.1523/ENEURO.0418-20.2020. Print 2021 Mar-Apr.

Neuronal Network Excitability in Alzheimer's Disease: The Puzzle of Similar versus Divergent Roles of Amyloid β and Tau

Affiliations
Review

Neuronal Network Excitability in Alzheimer's Disease: The Puzzle of Similar versus Divergent Roles of Amyloid β and Tau

Syed Faraz Kazim et al. eNeuro. .

Abstract

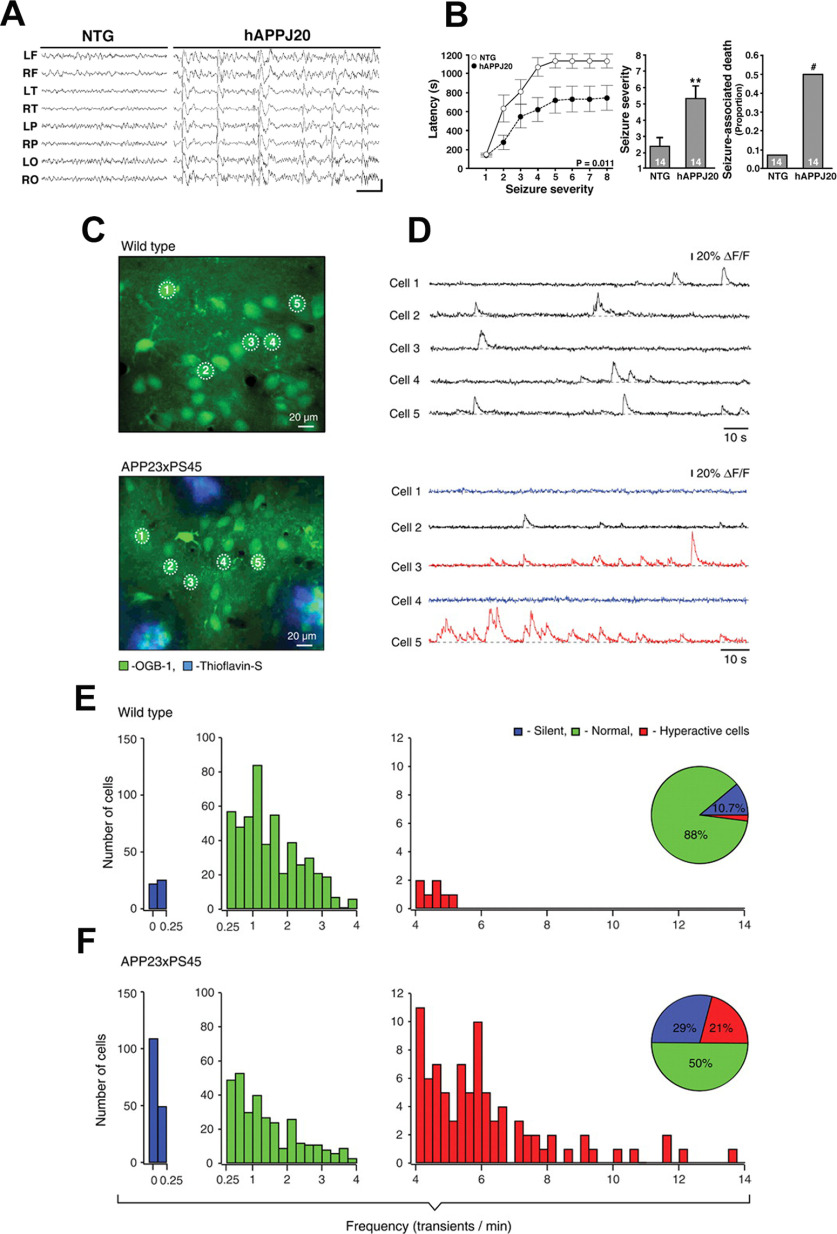
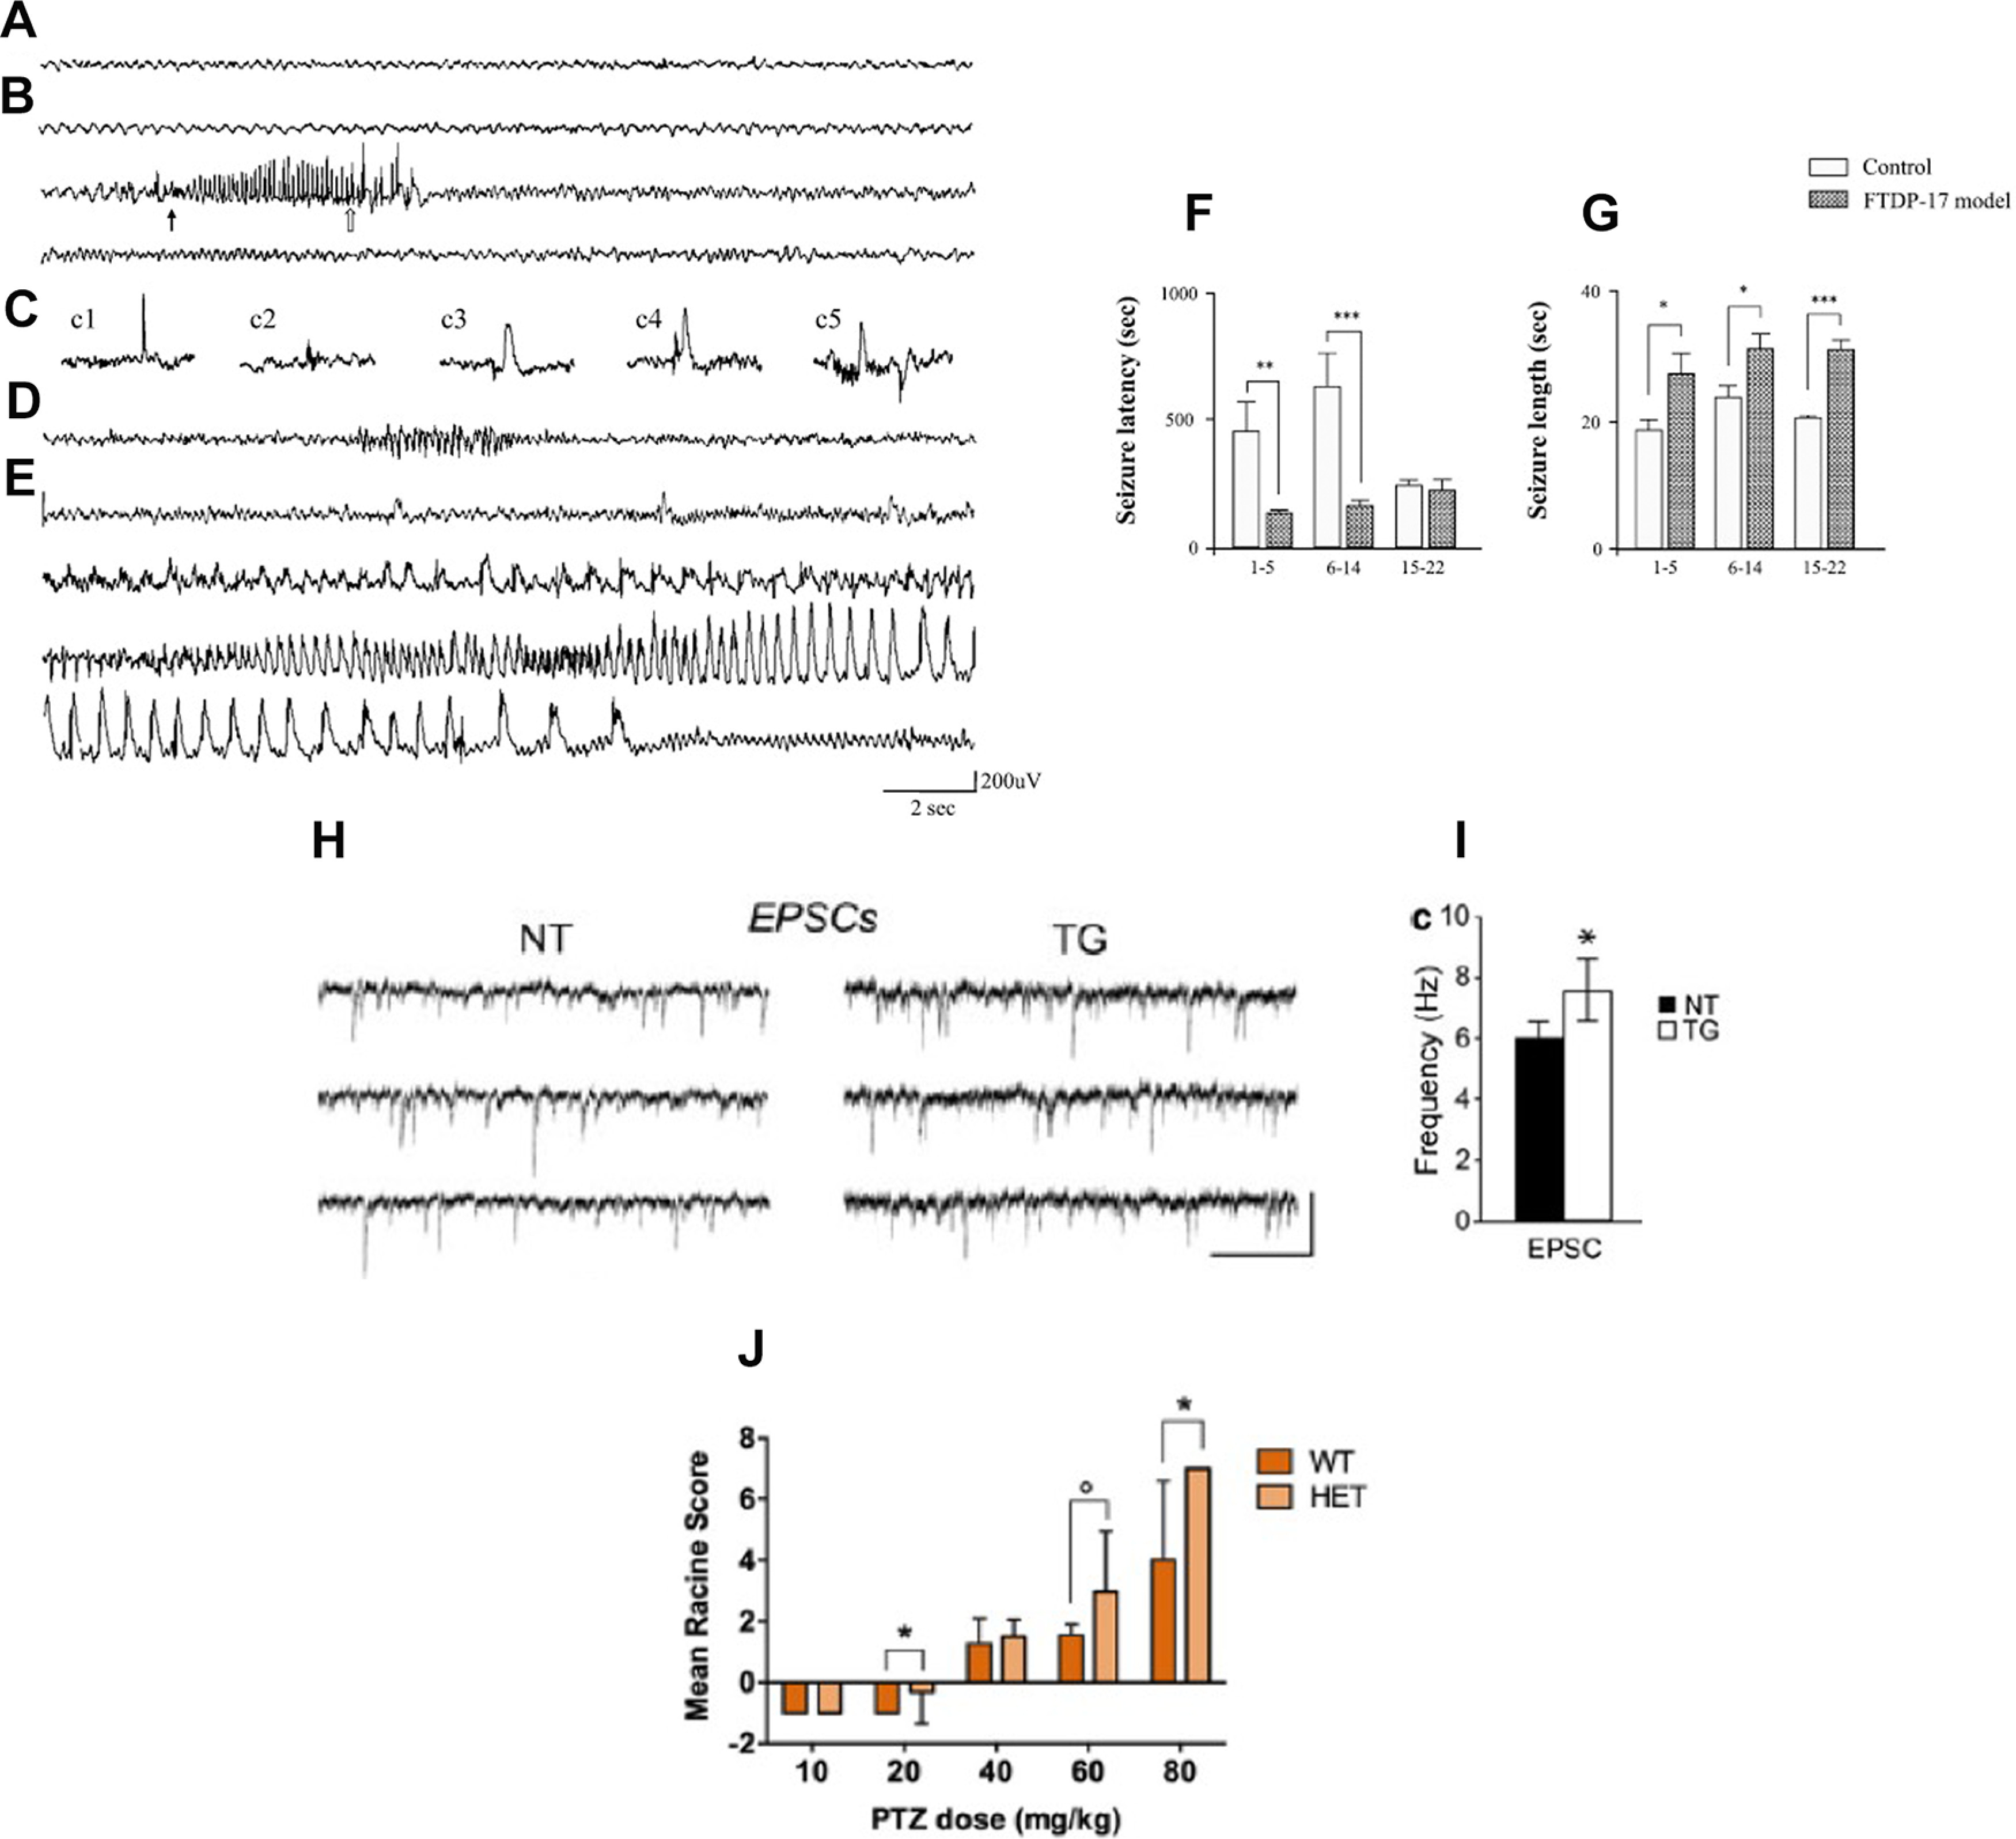
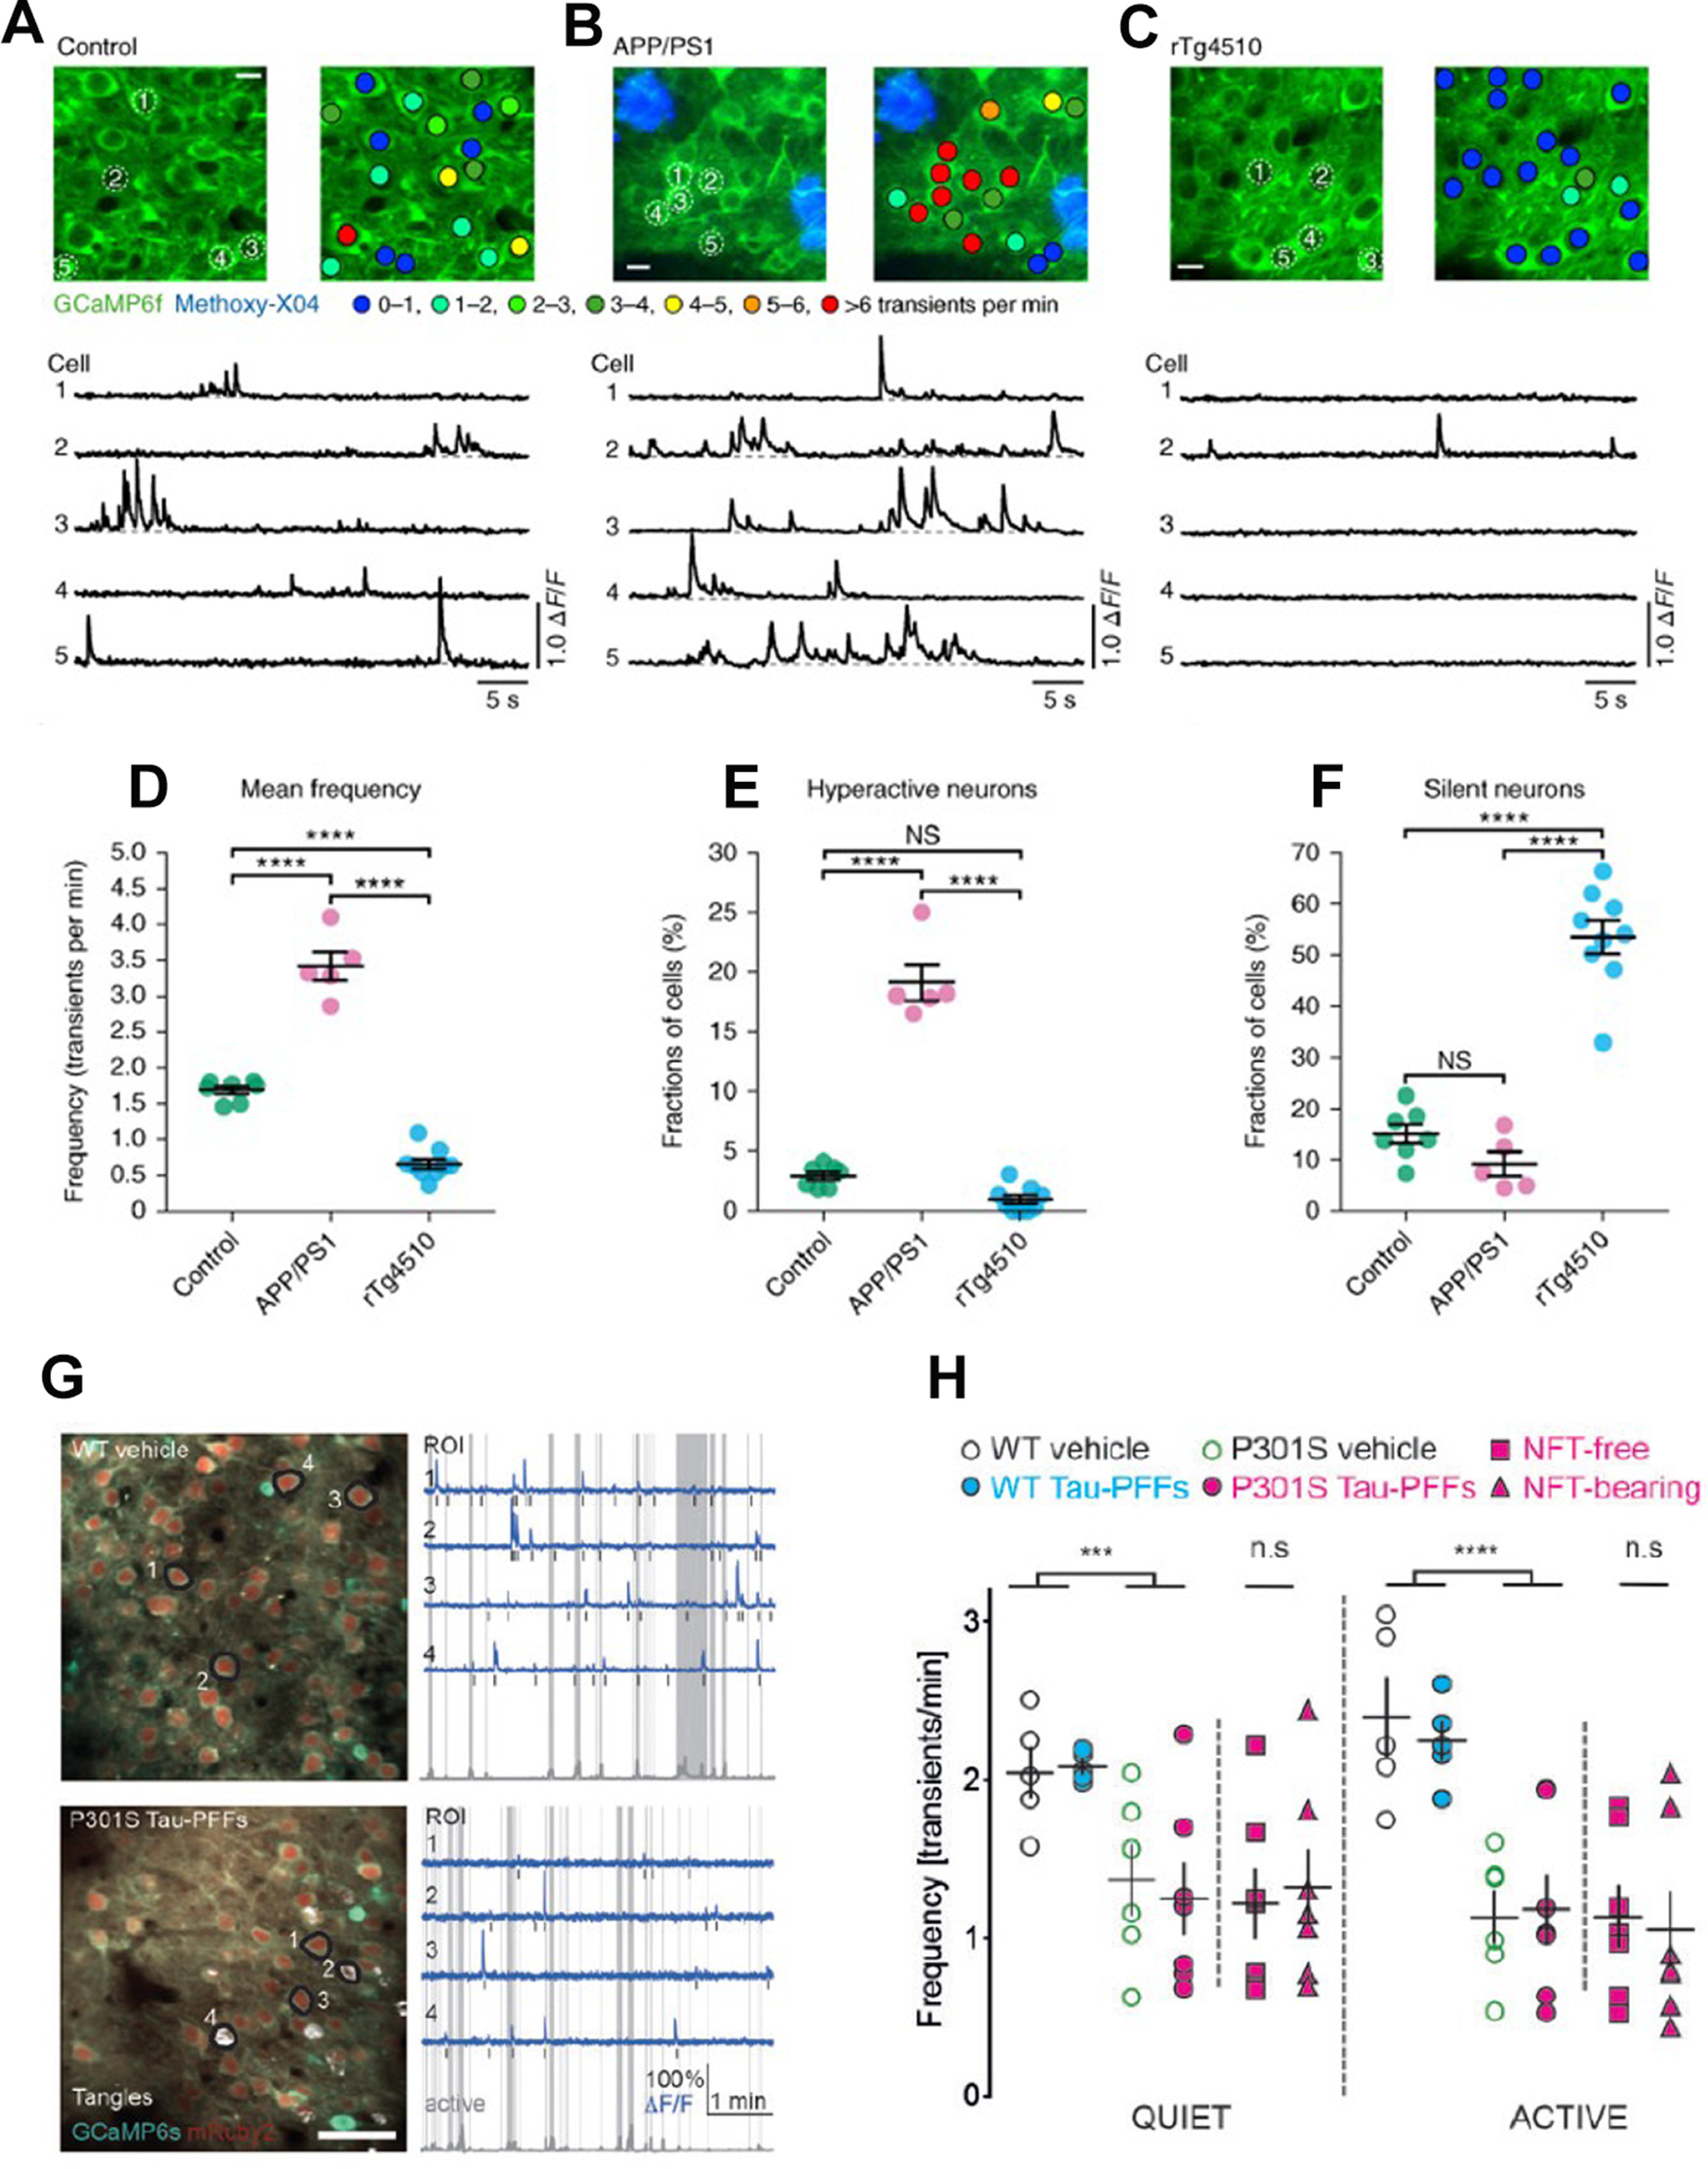
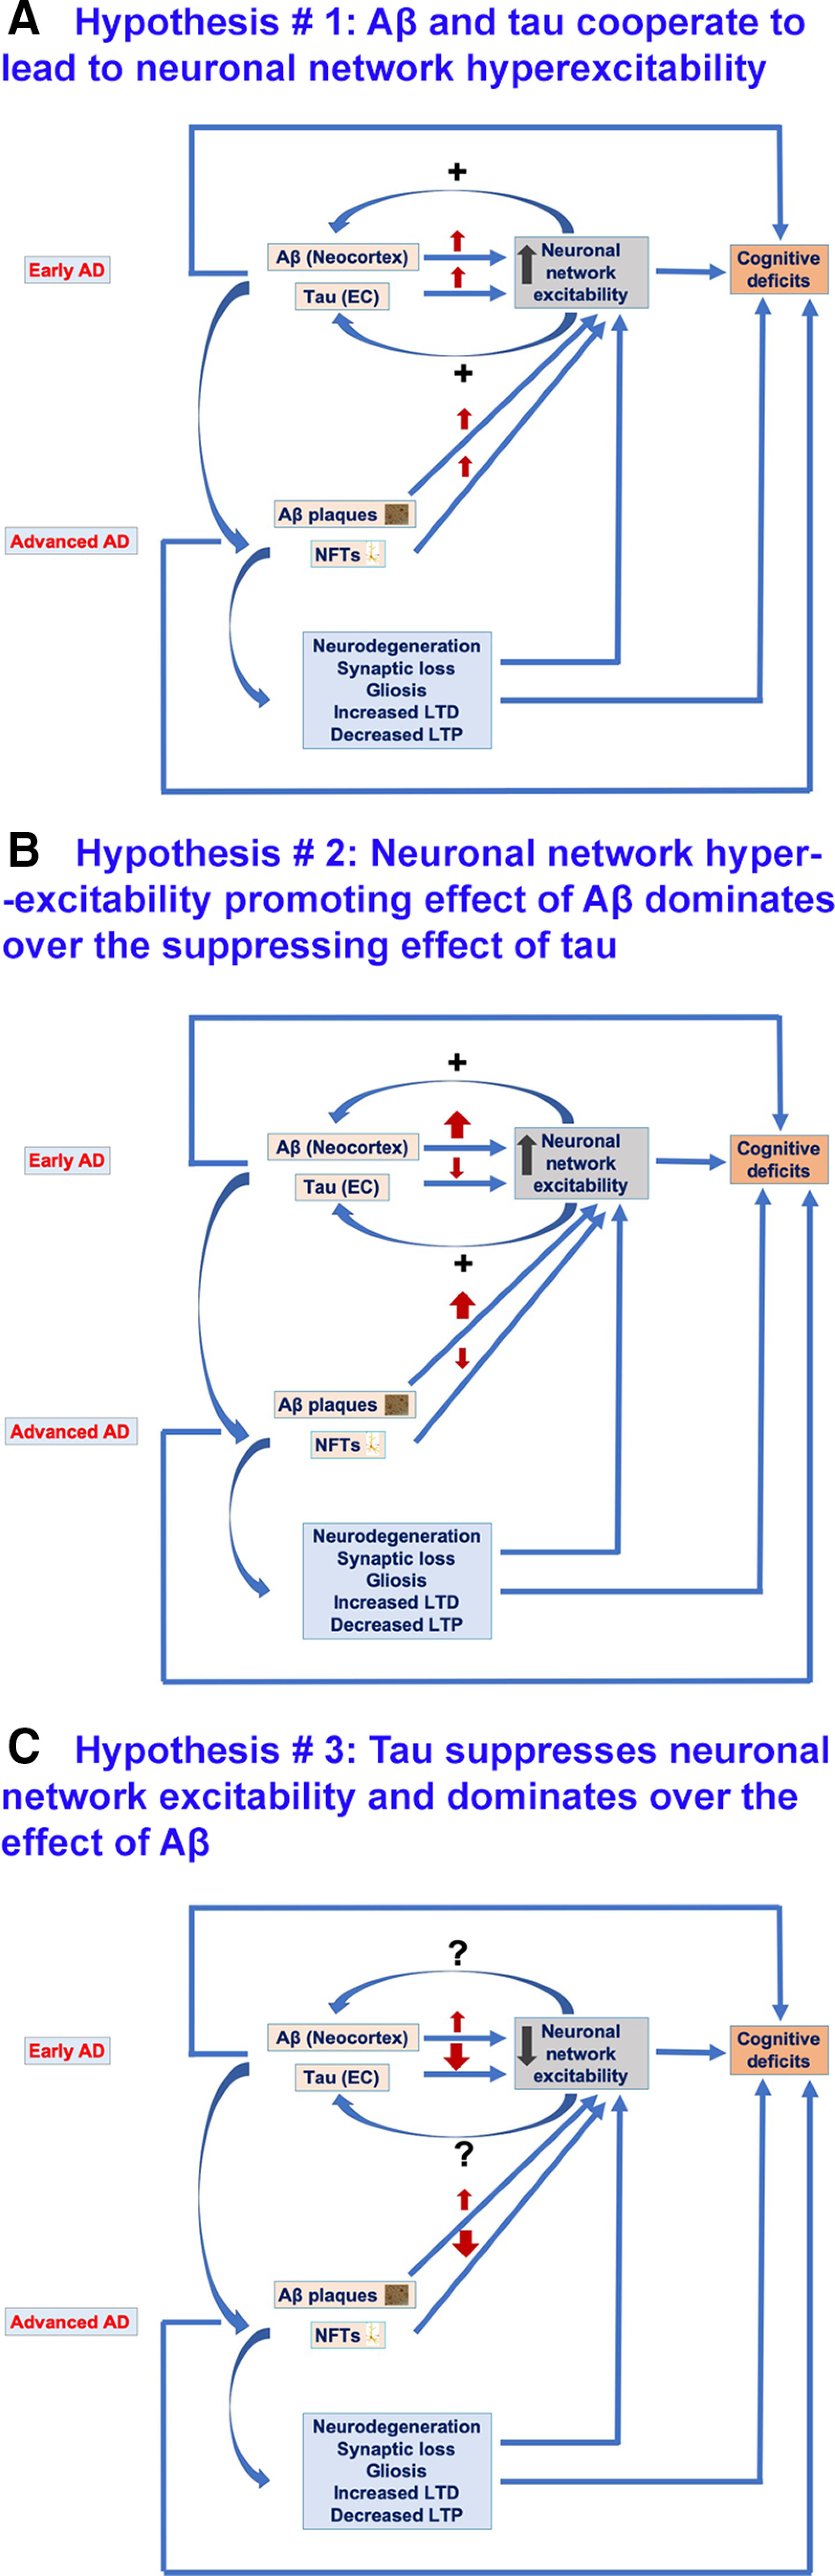
Alzheimer's disease (AD) is the most frequent neurodegenerative disorder that commonly causes dementia in the elderly. Recent evidence indicates that network abnormalities, including hypersynchrony, altered oscillatory rhythmic activity, interneuron dysfunction, and synaptic depression, may be key mediators of cognitive decline in AD. In this review, we discuss characteristics of neuronal network excitability in AD, and the role of Aβ and tau in the induction of network hyperexcitability. Many patients harboring genetic mutations that lead to increased Aβ production suffer from seizures and epilepsy before the development of plaques. Similarly, pathologic accumulation of hyperphosphorylated tau has been associated with hyperexcitability in the hippocampus. We present common and divergent roles of tau and Aβ on neuronal hyperexcitability in AD, and hypotheses that could serve as a template for future experiments.

Keywords: amyloid β; neuronal excitability; seizures; tau.


Figures

Figure 1.
Figure 1.
Neuronal network hyperexcitability at advanced stages of pathology in hAPP/Aβ mouse models of AD. A, B, Aberrant synchronous neuronal network activity, spontaneous nonconvulsive seizures, and increased susceptibility to PTZ-induced seizures in four- to seven-month-old hAPP-J20 mice. Reproduced from Palop et al. (2007) with permission from Elsevier. A, Chronic cortical EEG recordings performed in freely moving, untreated hAPP-J20 mice, and non-transgenic (NTG) controls. L, left; R, right; F, frontal; T, temporal; P, parietal; O, posterior-parietal, indicate the position of recording electrodes. In contrast to NTG mice, which showed normal EEG activity (left), hAPP-J20 mice exhibited frequent (5–50/min) generalized cortical epileptiform (interictal) spike discharges (right). Calibration: 1 s and 400 mV. B, Mice were injected intraperitoneally with PTZ (GABAA antagonist), behavior was videorecorded, and seizure severity was scored off-line. Compared with NTG controls, hAPP-J20 mice had shorter latencies to reach a given seizure severity (left), greater overall seizure severity (center), and more seizure-associated deaths (right); ∗∗p < 0.01 versus NTG by Student’s t test; #p < 0.05 by Fisher’s exact test. Quantitative data represent mean ± SEM. C–F, Clusters of hyperactive neurons near amyloid plaques in APP23xPS45 mice. In vivo two-photon calcium imaging from layer 2/3 cortical neurons. Reproduced with permission from Busche et al. (2008). C, D, Spontaneous Ca2+ transients (D) recorded in vivo in the corresponding neurons of the frontal cortex shown in C in a WT (top) and a APP23xPS45 (bottom) mouse. Traces in D, bottom, are color-coded to mark neurons that were either inactive during the recording period (blue) or showed an increased frequency of Ca2+ transients (red). E, F, Histograms showing the frequency distribution of Ca2+ transients in WT and APP23xPS45 mice (in both cases n = 564 cells). There is a substantial increase in the amount of silent and hyperactive neurons in APP23xPS45 mice. (Insets) Pie charts showing the relative proportion of silent, normal, and hyperactive neurons in WT (n = 10) and APP23xPS45 (n = 20) mice.
Figure 2.
Figure 2.
Early-onset neuronal network hyperexcitability in hAPP/Aβ mouse models of AD. A–C, Tg2576 mice exhibit spontaneous epileptiform activity and high susceptibility to pharmacologically induced seizures as young as 1.5 months of age. Reproduced with permission from Bezzina et al. (2015). A, Representative EEG traces from non-transgenic (NTg; top) and Tg2576 (bottom) mice from left and right parietal cortices. Note that only transgenic animals displayed sharp, high-voltage spikes that characterize epileptiform activity (inset). B, Quantitative analysis of the frequency of interictal spikes (mean ± SEM). Two-way ANOVA shows a significant genotype effect (p = 0.013) but no age effect (p = 0.4091) and no interaction (p = 0.3865). Numbers over the horizontal axis indicate the number of mice used in each experimental group. C, Seizure severity score of 1.5-, 3-, and 6-month-old Tg2576 male mice and NTg age-matched littermates. Whiskers boxes represent the interquartile distribution. Number of mice in each group is indicated below the boxes. Tg2576 mice exhibit more severe seizures than NTg at 1.5 and 6 months of age (Dunn’s tests: p < 0.05 for Tg2576 vs NTg at 1.5 and 6 months old). Note that only transgenic animals exhibit lethal seizures. Numbers over the horizontal axis indicate the number of mice used in each experimental group. D, Early hyperactivity of hippocampal neurons of 1.5-month-old APP23xPS45 mice (an age when no plaques are detectable). Reproduced with permission from Busche et al. (2012). Left, CA1 neurons imaged in vivo in a WT and a transgenic mouse, respectively. Center, Activity maps in which hue is determined by the frequency of spontaneous Ca2+ transients, overlaid with the anatomic image (left). Right, Spontaneous Ca2+ transients of the corresponding neurons marked (left). E–G, Early-onset seizure susceptibility and epileptiform activities in three-week-old 3xTg-AD mice (much before plaques and overt cognitive impairment). Reproduced with permission from Kazim et al. (2017). E, Incidence of convulsive seizures after audiogenic stimulation was markedly higher in three-week-old 3xTg-AD mice (blue bar) compared with WT mice (red bar). The data are presented as percent incidence with 95% confidence interval and compared using exact logistic regression stratified by litter; ***p < 0.001, compared with WT. WT (n = 35) and 3xTg-AD (n = 20) mice. F, Ictal-like epileptiform discharges in CA3 pyramidal cells of hippocampal slices from three-week-old 3xTg-AD mice. Left, CA3 intracellular recording from a WT slice after bicuculline addition (50 μm). Within 20 min, bicuculline induced rhythmic, short epileptiform discharges (≤1.5 s in duration) that were ongoing for at least 1 h of continuous recording. Membrane potential at the beginning of recording: −60 mV. Right, CA3 intracellular recording from a 3xTg-AD slice after bicuculline. Bicuculline first induced short synchronized epileptiform discharges that were similar to those in WT slices. However, continuous perfusion with bicuculline induced prolonged epileptiform (ictal-like) discharges (>1.5 s) in 3xTg-AD slice. Membrane potential at the beginning of recording: −65 mV. G, Positive correlation of intraneuronal human APP/Aβ expression in CA3 neurons and ictal-like activity in CA3 region. Correlation analyses revealed a positive relationship between intraneuronal human APP/Aβ immunoreactivity in the CA3 neurons (analyzed by 6E10, human APP/Aβ) and average duration of the five longest epileptiform discharges recorded during a 5-min period after 90 min of bicuculline application in the CA3 region of hippocampal slices from the same mice. Data from Saline-3xTg-AD (n = 9) and 6E10–3xTg-AD (n = 9) was pooled together to evaluate the correlation. The sigmoidal curve based on nonlinear regression is also shown. H, I, Early-onset epileptic activity in one- and two-month-old hAPP-J20 mice. Reproduced with permission from Fu et al. (2019). H, Representative EEG traces from NTg and hAPP-J20 mice at one and two months of age, with epileptiform spikes at one month of age and a seizure at two months of age in hAPP-J20 mice. Electrodes were in left and right frontal cortices (LFC and RFC), hippocampus (HIP), and parietal cortex (PC). Scale bars: 1 mV, 10 s. I, The number of epileptic spikes per hour in NTg or hAPP-J20 mice at one, two, and four to six months of age (n = 3−5 mice per genotype and age).
Figure 3.
Figure 3.
Neuronal network hyperexcitability in tau mouse models. A–G, Hyperexcitability and epileptic seizures in a mouse model of a tauopathy (FTDP-17). Reproduced from García-Cabrero et al. (2013) with permission from Elsevier. A, Intracranial recording of background activity (6–7 Hz) in control mice. B, Spindle-shaped polyspike discharge at 8–10 Hz, during an initial tonic phase (thin arrow indicates the beginning) and a short clonic phase (open arrow signals the beginning) in a FTDP-17 mouse. C, Spontaneous interictal epileptic activity in FTDP-17 mice corresponding to (c1) single spike, (c2) polyspike, (c3) slow wave, and (c4, c5) polyspike-wave discharges. D, Nonconvulsive spontaneous seizure with EEG correlates corresponding to rhythmic, spindle-shaped discharges. E, Spontaneous generalized tonic–clonic seizure in a FTDP-17 mouse manifested in the EEG record as generalized low-frequency (3–6 Hz) poyspike-wave discharge, 36 s in length. Figure shows the records from monopolar electrodes placed over the left frontal cortex with the reference electrodes implanted posterior to λ. F, G, Analysis of seizure latency and length of PTZ-induced generalized seizures in FTDP-17 mice. Mice at three different age spans (1–5, 6–14, and 15–22 months) were injected with a convulsive dose of PTZ (50 mg/kg). F, The time interval between drug administration and development of generalized tonic–clonic seizures and (G) the seizure length were measured. Data are presented as mean ± SEM. Student’s t test was performed for statistical evaluation; *p <0.05, **p <0.01, ***p <0.001 (n = 15–24). H, I, Increased spontaneous synaptic activity in whole-cell patch clamp recordings of layer 3 frontal cortex pyramidal neurons of rTg4510 (hTau P301L) mice. Reproduced with permission from Crimins et al. (2011). Increased frequency of sEPSCs in TG (rTg4510) cells. H, Representative sEPSCs from non-transgenic (NT) and TG cells. I, Bar graphs of mean frequency sEPSCs in NT and TG cells. J, Increased PTZ-induced seizure susceptibility in three-month-old Tau58/4 (htau P301S) mice. Young HET (Tau58/4) mice had higher mean severity scores than WT littermates. Reproduced with permission from Van Erum et al. (2020).
Figure 4.
Figure 4.
In vivo evidence of suppression of neuronal activity in tau mouse models. A–F, Neuronal silencing in rTg4510 mice as compared with neuronal hyperactivity in APP/PS1 mice. Reproduced with permission from Busche et al. (2019). A–C, top, In vivo two-photon fluorescence images of GCaMP6f-expressing (green) layer 2/3 neurons in the parietal cortex and corresponding activity maps from WT controls (A), APP/PS1 (B), and rTg4510 (C) mice. In APP/PS1 mice, plaques were labeled with methoxy-X04 (blue); in the activity maps, neurons were color-coded as a function of their mean Ca2+ transient activity. Scale bars: 10 μm. Bottom, spontaneous Ca2+ transients of neurons indicated in the top panel. D, Mean neuronal frequencies for controls (1.69 ± 0.05 transients per minute), APP/PS1 (3.42 ± 0.20 transients per minute), and rTg4510 (0.66 ± 0.07 transients per minute); F(2,18) = 171.2, p = 1.93 × 10−12. All post hoc multiple comparisons between genotypes were highly significant: p = 5.42 × 10−9 for controls versus APP/PS1, p = 1.38 × 10−6 for controls versus rTg4510, and p = 1.01 × 10−12 for APP/PS1 versus rTg4510. E, Fractions of hyperactive neurons. Controls: 2.91 ± 0.35%, APP/PS1: 19.11 ± 1.50%, rTg4510: 0.93 ± 0.35%; F(2,18) = 176.2, p = 1.51 × 10−12. Post hoc multiple comparisons were p = 2.84 × 10−11 for controls versus APP/PS1, p = 1.64 × 10−12 for APP/PS1 versus rTg4510 and not significant, p = 0.1045, for controls versus rTg4510. F, Fractions of silent neurons. Controls: 15.05 ± 1.87%, APP/PS1: 9.20 ± 2.36%, rTg4510: 53.48 ± 3.24%; F(2,18) = 77.18, p = 1.48 × 10−9. Post hoc multiple comparisons were p = 2.02 × 10−8 for controls versus rTg4510 and p = 1.08 × 10−8 for APP/PS1 versus rTg4510 and not significant, p = 0.3972, for controls versus APP/PS1. Each solid circle represents an individual animal (controls, n = 7; APP/PS1, n = 5; rTg4510, n = 9), and all error bars reflect the mean ± SEM; the differences between genotypes were assessed by one-way ANOVA followed by Tukey’s multiple comparisons test, ****p < 0.0001. NS, not significant. G, H, Neuronal activity is reduced in P301S mice independently of presence of NFTs. Reproduced with permission from Marinković et al. (2019). G, left, Representative in vivo recordings from WT vehicle and P301S tau-PFFs (tau preformed fibrils-injected) mice. AAV1 transduced neurons are labeled with mRuby2 (red) and GCaMP6s (green). NFTs are labeled with FSB (white). Images are made by averaging 450 time-series frames acquired in vivo at 410 Hz with two-photon lasers tuned to 940 nm for CGaMP6s/mRuby2 and to 750 nm for FSB. Scale bar: 50 mm. Right, Traces (blue) extracted from annotated regions of interest (black) during quiet and active (gray shade) behavioral states classified based on changes in whisking movement (gray trace in the bottom). Note that traces 2 and 4 in P301S tau-PFFs group are from NFT-bearing neurons. Black bars mark detected calcium transients. H, Mean frequency of calcium transients during quiet and active states of all neurons detectable in three or more time points. WT vehicle (black), WT tau-PFFs (cyan), P301S vehicle (green), all P301S tau-PFFs: all neurons are denoted as magenta circles, with NFT-free as magenta squares and NFT-bearing as magenta triangles. Data points represent individual mice, n = 5–7 mice per group; black lines represent mean value ± SEM; ***p < 0.001, ****p < 0.0001, WT versus P301S (two-way ANOVA, genotype factor, not significant; Student’s t test).
Figure 5.
Figure 5.
Hypotheses regarding the possible effects of Aβ and tau on neuronal network excitability in AD. A, Hypothesis #1, Aβ and tau cooperate to lead to neuronal network hyperexcitability in AD. At early stages of AD, Aβ is more abundant in the neocortex whereas tau is localized to EC. Both Aβ and tau at early AD stages promote neuronal network hyperexcitability which not only contributes to cognitive impairments but also reciprocally increases Aβ deposition and tau release and spread to other cortical areas across connected neuroanatomical circuitry. Also, at advanced AD stages, both Aβ and tau promote neuronal network hyperexcitability, thus leading to cognitive deficit. Furthermore, Aβ-induced and tau-induced neuronal and synaptic loss, gliosis, and impaired synaptic plasticity (decreased LTP and increased LTD) contribute to neuronal network hyperexcitability and to cognitive deficits, effects also at play in scenarios illustrated in B, C. B, Hypothesis #2, Aβ enhances neuronal network hyperexcitability whereas tau suppresses excitability; the overall phenotype is hyperexcitability as Aβ effect dominates over tau effect. Aβ at early AD stages promotes neuronal network hyperexcitability which not only contributes to cognitive impairments but also increases Aβ deposition and tau release and spread to other cortical areas across connected neuroanatomical circuitry. However, tau at early AD stages suppresses neuronal activity, thus leading to silencing of neuronal networks which could also contribute to AD-related network dysfunction and cognitive deficit. Also, at advanced AD stages, Aβ enhances and tau suppresses neuronal network excitability, both leading to cognitive deficits. This could also be the case in AD patients with higher Aβ deposits than NFTs in their brains. C, Hypothesis #3, tau suppresses neuronal network excitability, whereas Aβ enhances it; the overall phenotype is suppressed excitability as tau suppressive effect dominates over Aβ enhancing effect. Tau both at early and advanced AD stages suppresses neuronal excitability thus leading to silencing of neuronal networks contributing to AD cognitive deficits. Contrarily, Aβ both at early and advanced AD stages promotes neuronal network hyperexcitability however this is dominated by tau suppressive effect. However, this hypothesis cannot explain the tau spread from EC to other cortical areas as increased neuronal activity has been identified to promote propagation of tau. Nonetheless, there could be other mediators of tau spread besides neuronal network hyperexcitability.

Similar articles

Cited by

References

    1. Adaikkan C, Middleton SJ, Marco A, Pao P-C, Mathys H, Kim DN-W, Gao F, Young JZ, Suk H-J, Boyden ES, McHugh TJ, Tsai LH (2019) Gamma entrainment binds higher-order brain regions and offers neuroprotection. Neuron 102:929–943.e8. 10.1016/j.neuron.2019.04.011 - DOI - PMC - PubMed
    1. Ahnaou A, Moechars D, Raeymaekers L, Biermans R, Manyakov NV, Bottelbergs A, Wintmolders C, Van Kolen K, Van De Casteele T, Kemp JA, Drinkenburg WH (2017) Emergence of early alterations in network oscillations and functional connectivity in a tau seeding mouse model of Alzheimer’s disease pathology. Sci Rep 7:14189. 10.1038/s41598-017-13839-6 - DOI - PMC - PubMed
    1. Aimone JB, Wiles J, Gage FH (2006) Potential role for adult neurogenesis in the encoding of time in new memories. Nat Neurosci 9:723–727. 10.1038/nn1707 - DOI - PubMed
    1. Aimone JB, Deng W, Gage FH (2010) Adult neurogenesis: integrating theories and separating functions. Trends Cogn Sci 14:325–337. 10.1016/j.tics.2010.04.003 - DOI - PMC - PubMed
    1. Alexander GE, Chen K, Pietrini P, Rapoport SI, Reiman EM (2002) Longitudinal PET evaluation of cerebral metabolic decline in dementia: a potential outcome measure in Alzheimer’s disease treatment studies. Am J Psychiatry 159:738–745. 10.1176/appi.ajp.159.5.738 - DOI - PubMed

Publication types

LinkOut - more resources