Review
. 2021 Apr;70(4):831-841.
doi: 10.2337/db20-1185.

Uncovering Pathways to Personalized Therapies in Type 1 Diabetes

Affiliations
Review

Uncovering Pathways to Personalized Therapies in Type 1 Diabetes

Peter S Linsley et al. Diabetes. 2021 Apr.

Abstract

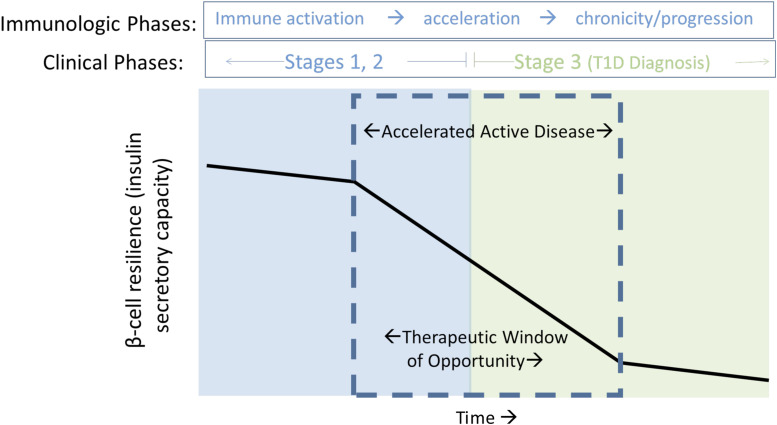
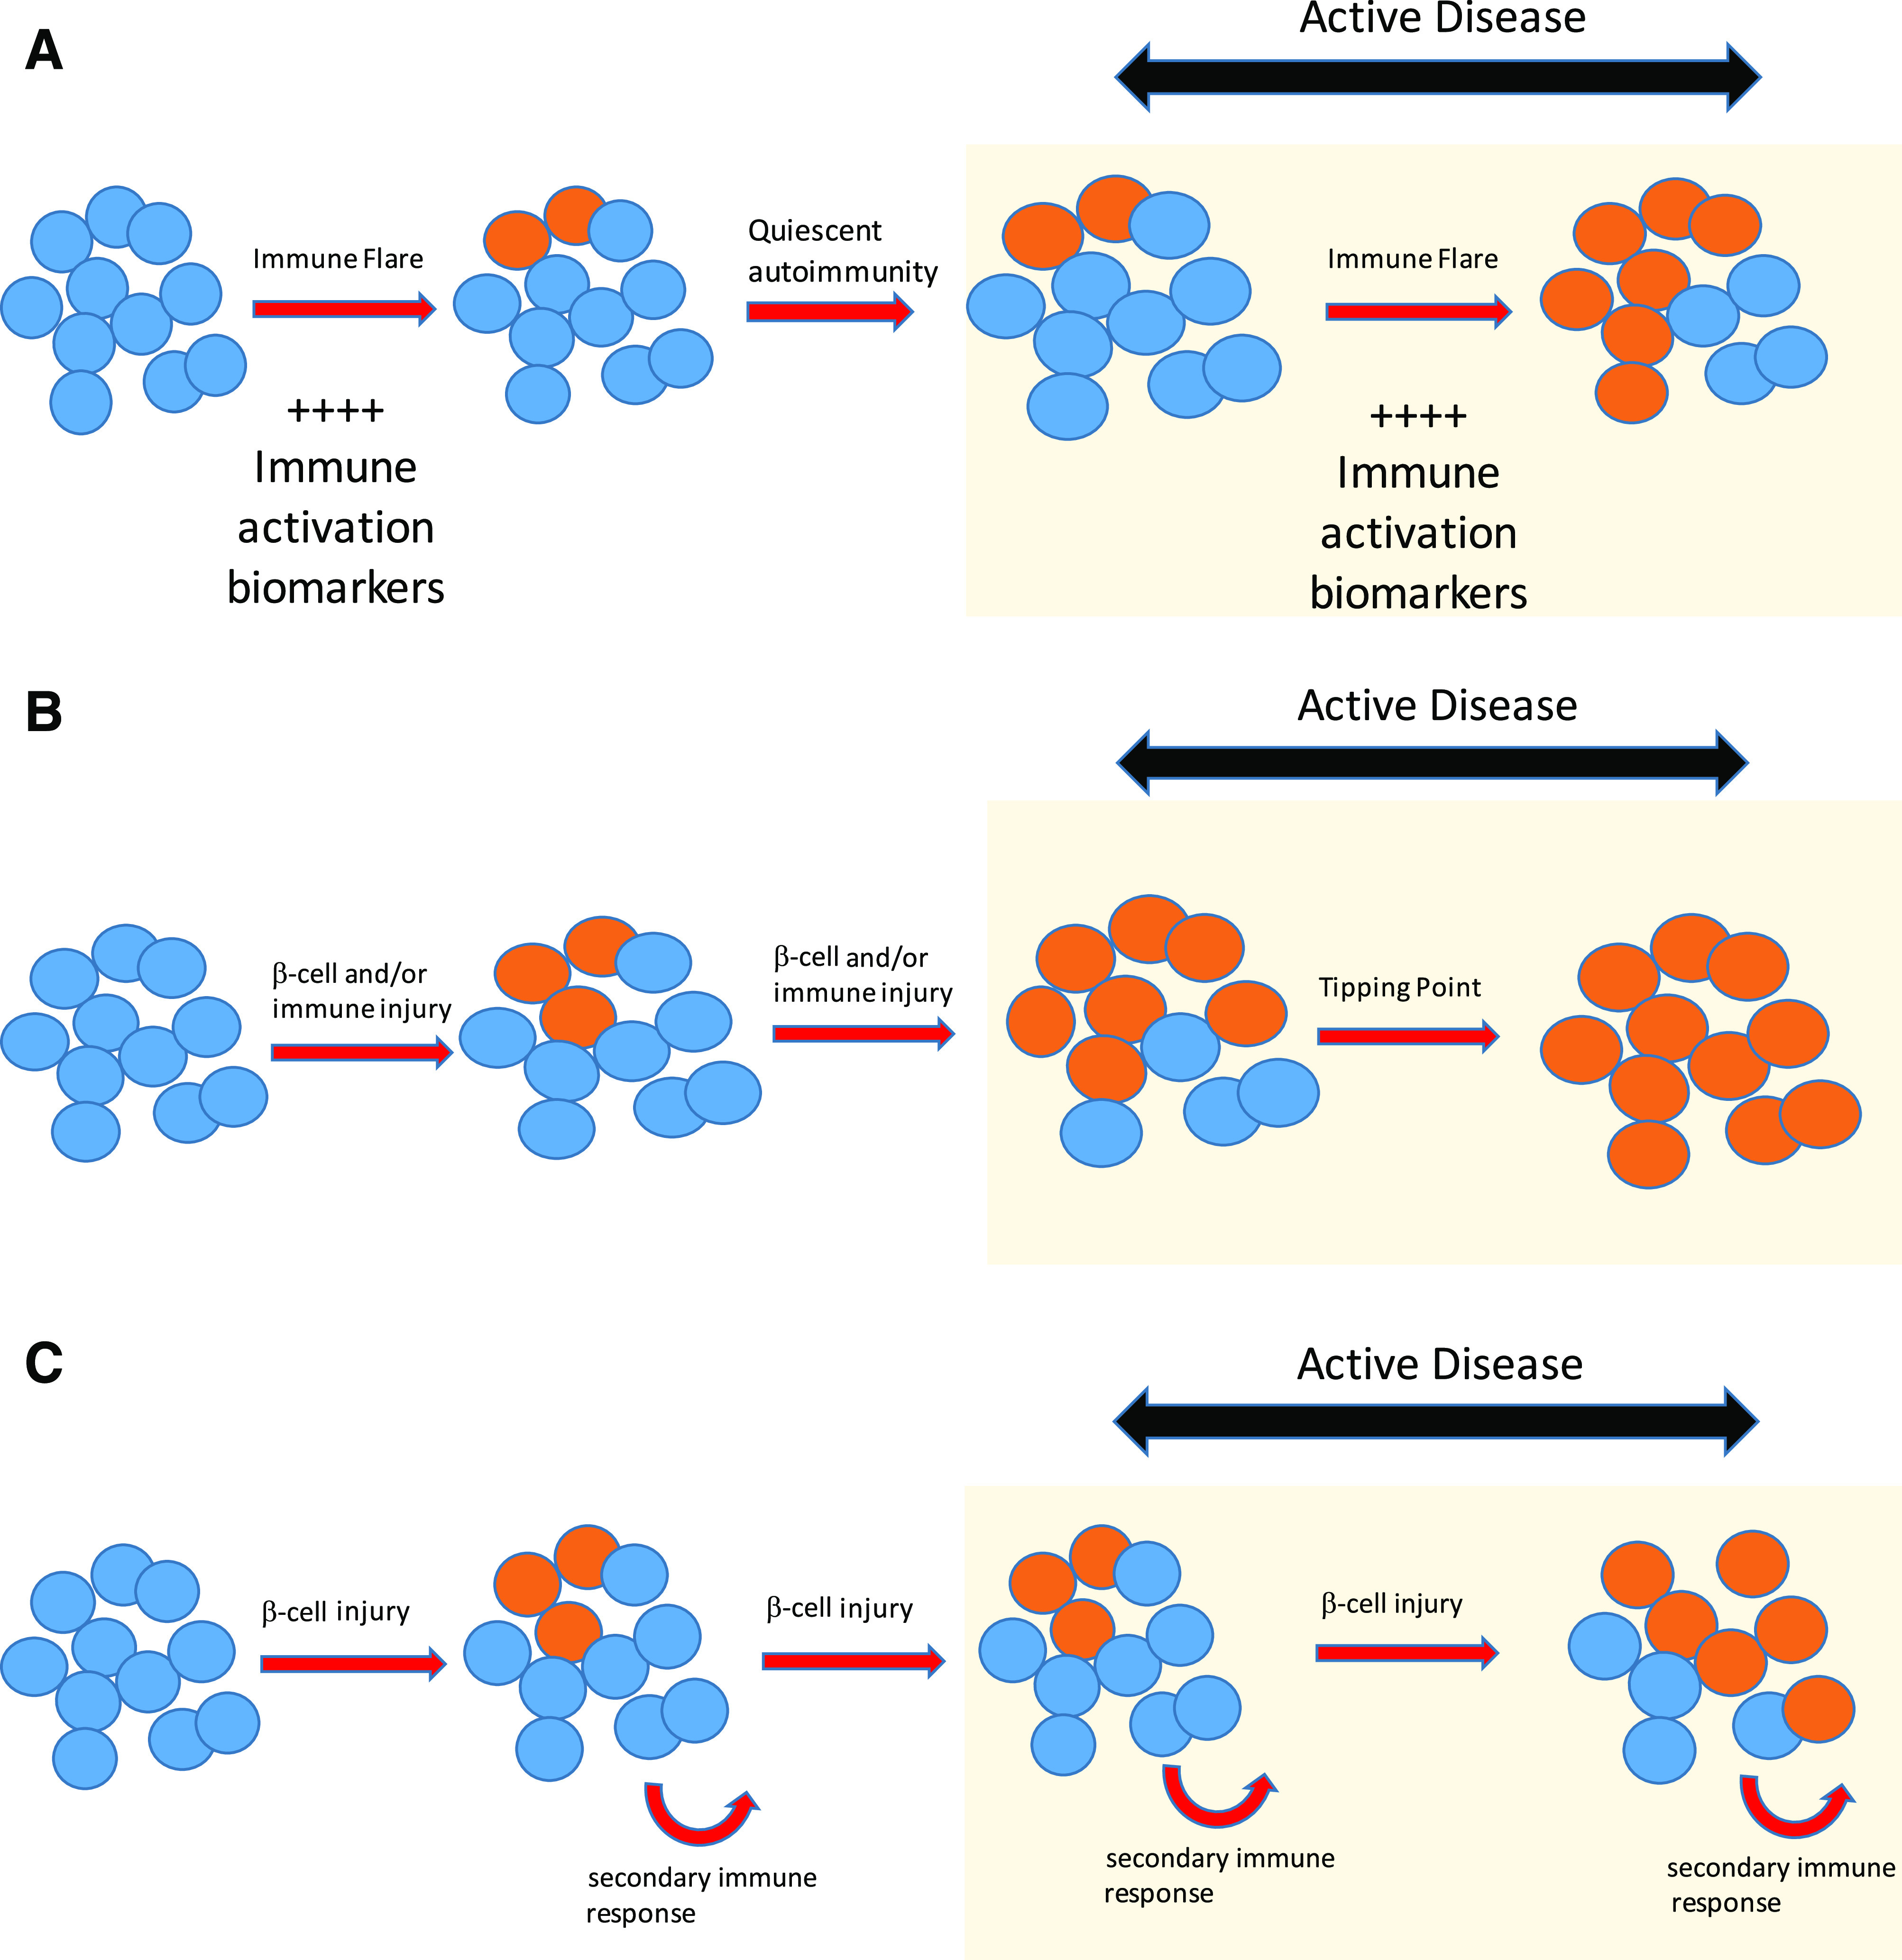
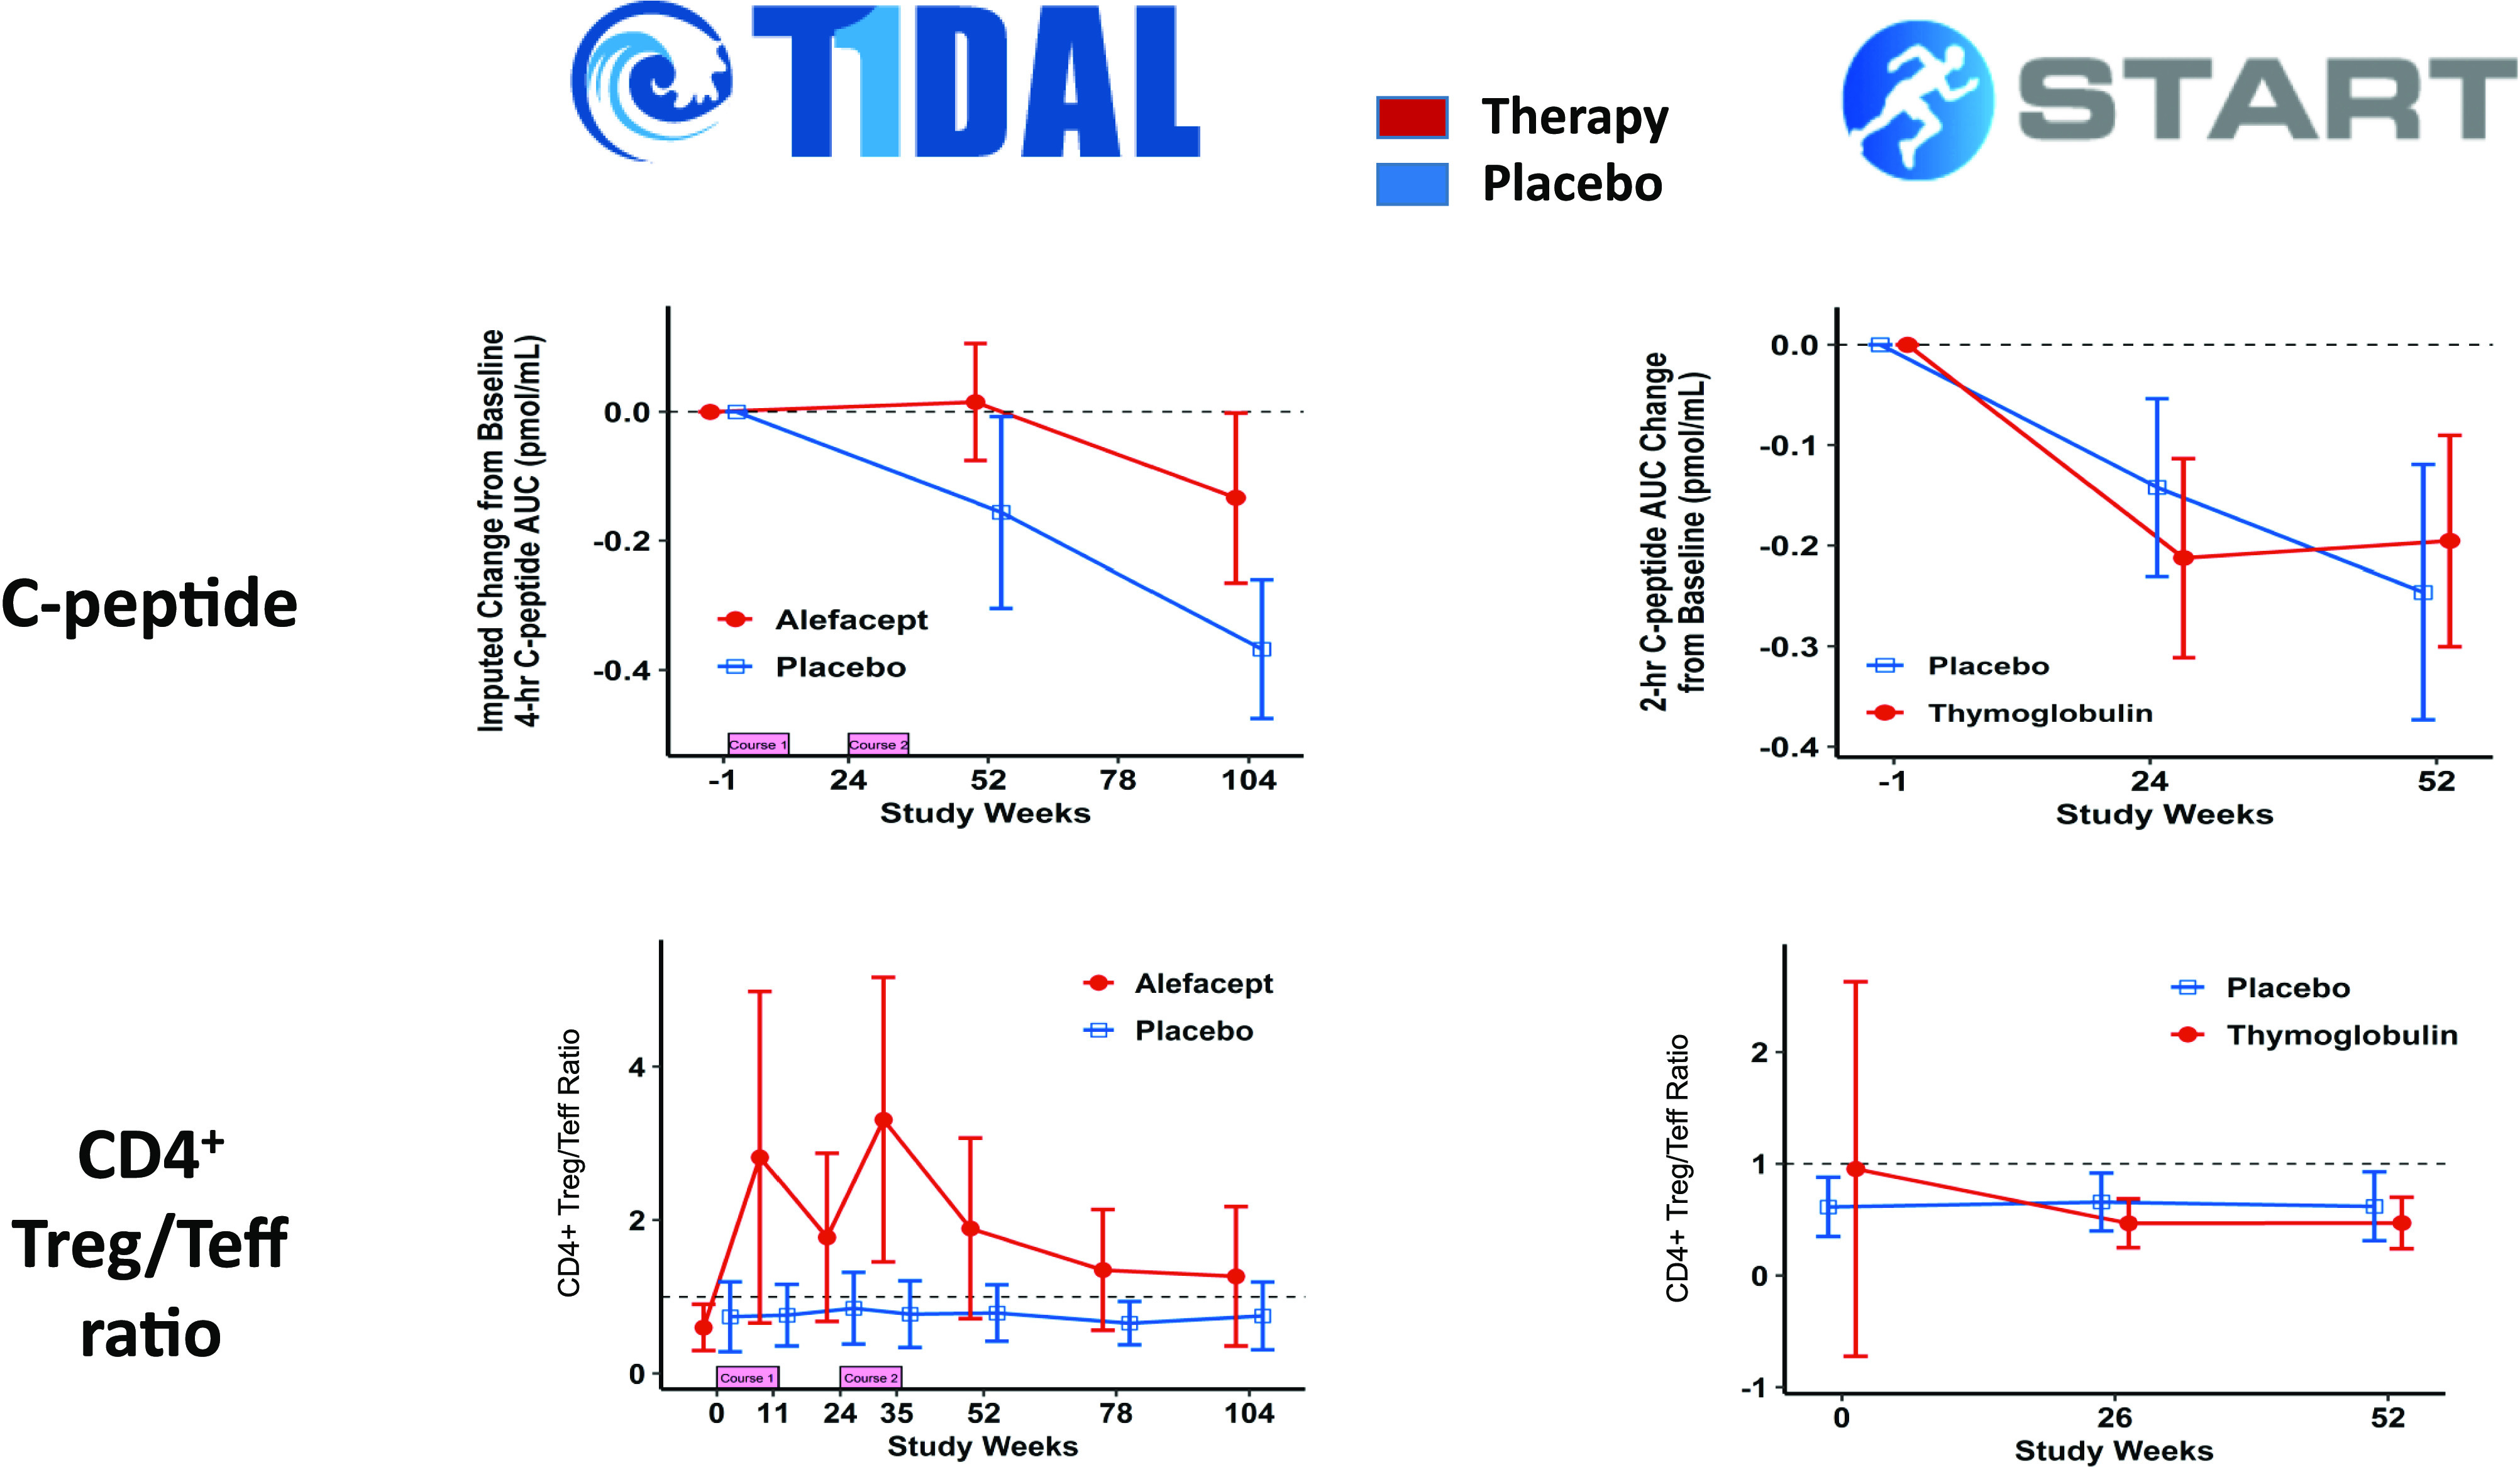
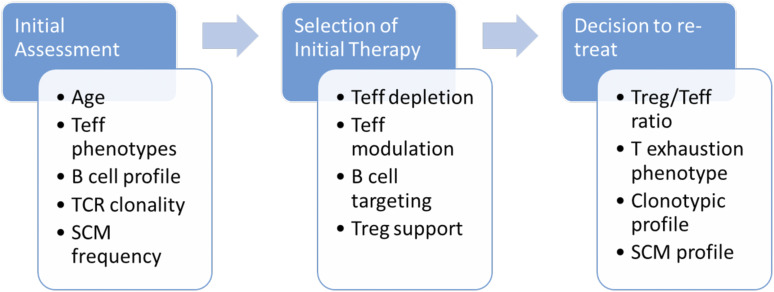
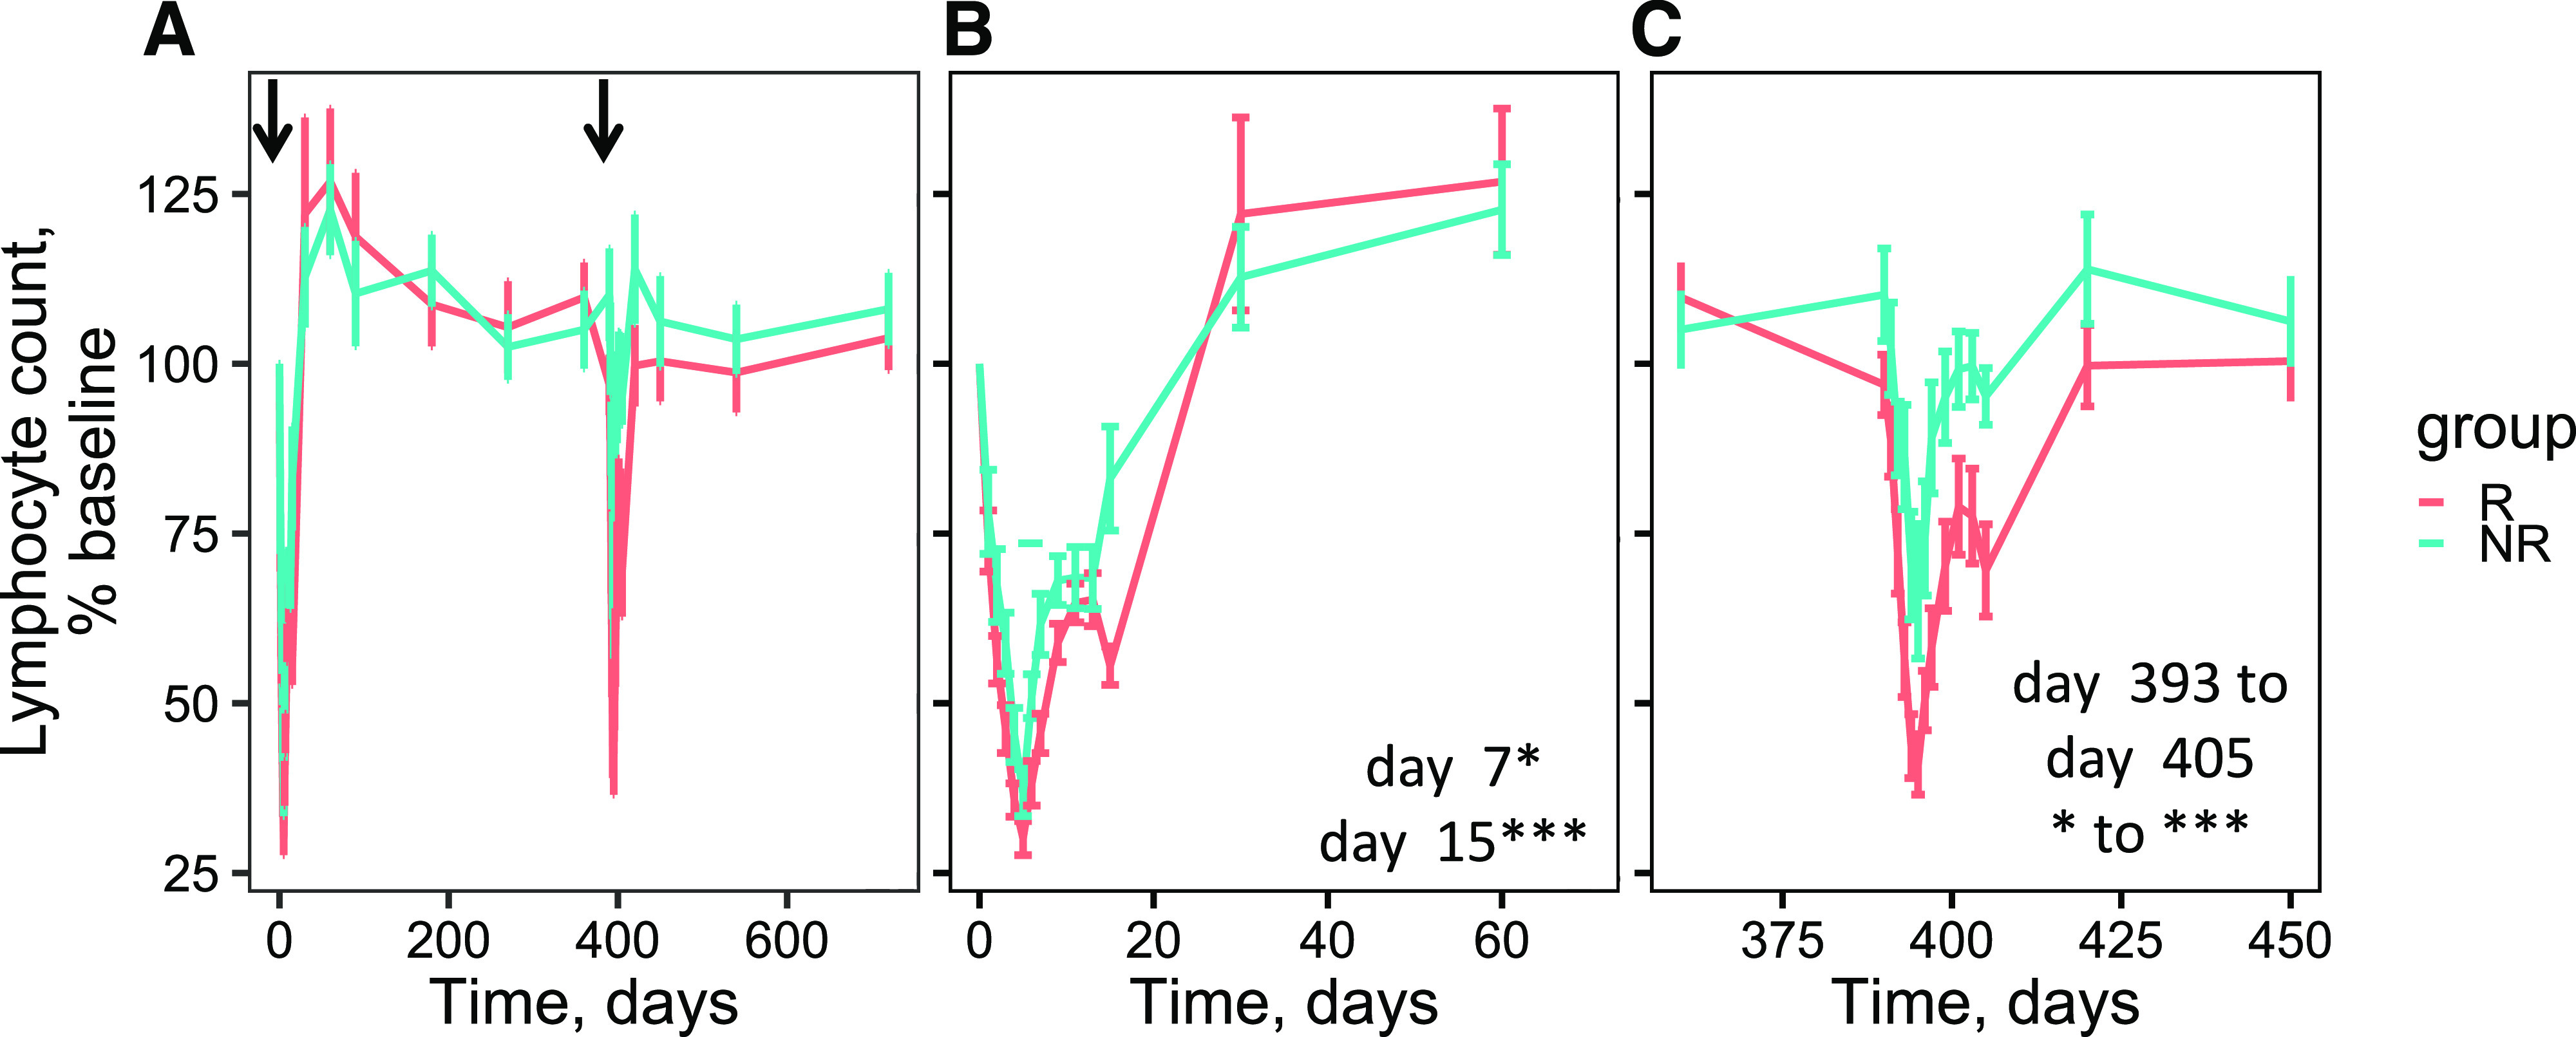
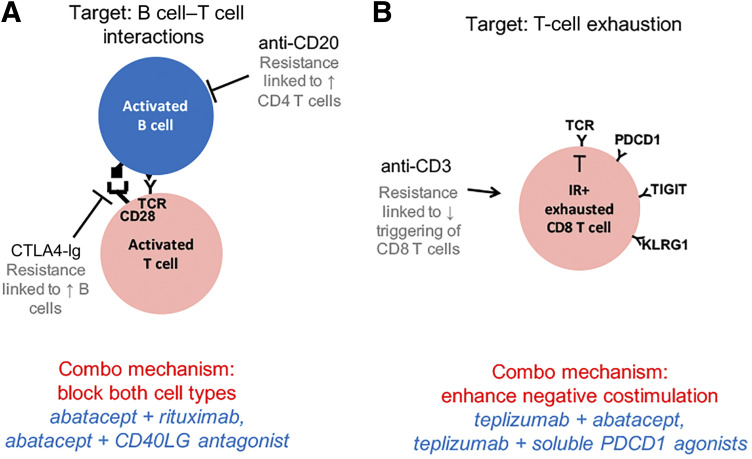
The goal of personalized medicine is to match the right drugs to the right patients at the right time. Personalized medicine has been most successful in cases where there is a clear genetic linkage between a disease and a therapy. This is not the case with type 1 diabetes (T1D), a genetically complex immune-mediated disease of β-cell destruction. Researchers over decades have traced the natural history of disease sufficiently to use autoantibodies as predictive biomarkers for disease risk and to conduct successful clinical trials of disease-modifying therapy. Recent studies, however, have highlighted heterogeneity associated with progression, with nonuniform rate of insulin loss and distinct features of the peri-diagnostic period. Likewise, there is heterogeneity in immune profiles and outcomes in response to therapy. Unexpectedly, from these studies demonstrating perplexing complexity in progression and response to therapy, new biomarker-based principles are emerging for how to achieve personalized therapies for T1D. These include therapy timed to periods of disease activity, use of patient stratification biomarkers to align therapeutic target with disease endotype, pharmacodynamic biomarkers to achieve personalized dosing and appropriate combination therapies, and efficacy biomarkers for "treat-to-target" strategies. These principles provide a template for application of personalized medicine to complex diseases.


Figures

Figure 1
Figure 1
Nonlinear progression of β-cell loss characterizes stages of T1D. The peri-diagnostic period is highlighted, reflecting a period of accelerated β-cell dysfunction, superimposed on a slow progressive functional decline that begins prior to clinical diagnosis and continues through the early post-diagnostic interval (“Stage 3” disease, or clinical T1D). Observations of immunological acceleration occur within this period, presenting an opportunity for targeted immune intervention based on identification of individualized immune characteristics associated with rapid decline—both prior to diagnosis (blue box, “prevention therapy”) and after diagnosis (green box, “intervention therapy”). Adapted from Greenbaum et al. Strength in numbers: opportunities for enhancing the development of effective treatments for T1D—the TrialNet experience. Diabetes 2018;67:1216–1225.
Figure 2
Figure 2
Potential mechanisms accounting for a period of accelerated change in insulin secretion during the development of T1D. Functional loss of β-cells is associated both with intrinsic properties of damaged or stressed islets and with extrinsic properties of activated and aggressive immune responses. The interplay between these two factors manifests in an accelerated phase of disease activity associated with biomarker changes in both intrinsic and extrinsic compartments and manifested by a rapid change in β-cell function. Blue ovals show functional β-cells. Orange ovals show dead or dysfunctional β-cells. A: Hypothesis: Immune activation causes active disease. Prediction: Immune biomarkers will associate only with periods of β-cell change. B: Hypothesis: β-Cell injury and associated autoimmunity continue over time. Active disease occurs due to β-cell destruction at threshold or tipping point. Prediction: No association of immune markers and active disease. Nonlinear changes in markers of β-cell injury. C: Hypothesis: β-Cell injury from nonimmune source is primary cause of dysfunction. Immunity is in response to tissue injury. Active disease occurs due to episodic acute (exogenous/environmental) injury. Prediction: No association of immune markers and active disease. Markers of β-cell injury will be strongly associated with changes of β-cell function.
Figure 3
Figure 3
Frequencies of regulatory T cells (Treg) and effector T cells (Teff) following use of anti–T-cell immunomodulatory therapy correlate with persistence or loss of insulin secretory capacity. Shown are stimulated C-peptide area under the curve (AUC) measurements from the T1DAL trial of alefacept (top left panel) and the START trial of ATG (top right panel), documenting transient preservation of β-cell function following alefacept treatment. The bottom panels display a ratio of the frequencies of regulatory and effector T lymphocytes in peripheral blood during these clinical trials, illustrating a marked increase in this ratio during the period of C-peptide preservation in T1DAL but not in START. Data are adapted from Rigby et al. (17) and Gitelman et al. (34).
Figure 4
Figure 4
Opportunities for individualized therapeutic decision-making using T1D immune profiles. Targeted therapeutics for particular T or B lymphocytes, specific cytokines, or other selected immune pathways provide alternatives for disease intervention, tailored to individualized patients. Such personalized approaches will require biomarker stratification that reflects several types of immune characteristics, examples of which are listed here. The choice of biomarker and choice of therapeutic may be different during initial patient assessment compared with later in the disease course, reflecting changes in the immunobiology of T1D during disease progression. Teff, effector T lymphocytes; TCR, T-cell receptor; SCM, stem cell memory; Treg, regulatory T lymphocytes.
Figure 5
Figure 5
The extent of lymphocyte reduction is linked to therapeutic outcome after teplizumab treatment outcome in the AbATE study. Shown are mean lymphocyte counts ± SE (error bars) as determined by complete blood count at various intervals after treatment with teplizumab. Patient groups corresponding to responders (R) and nonresponders (NR) to teplizumab treatment were designated as previously described (13). A: Complete study. Arrows represent initiation of the two treatment cycles. B: First treatment cycle. C: Second treatment cycle. P values for individual time points: ***P value >1e-4 and <1e-3; *P value >1e-2 and <0.05. Unless otherwise indicated, P values were > 0.05 and considered not significant.
Figure 6
Figure 6
Combination therapy options to overcome mechanisms of resistance to monotherapies. Shown are therapeutic options for T1D based on targeting B cell–T cell interactions (A) and T-cell exhaustion (B). Black font, currently tested monotherapies; gray font, mechanism of resistance to monotherapy; red font, proposed combination (Combo) mechanism (B cell–T cell interactions [49] and T-cell exhaustion [4,50]); blue font, specific combination options. IR+, inhibitory receptor-positive.

Similar articles

Cited by

References

    1. Bingley PJ, Wherrett DK, Shultz A, Rafkin LE, Atkinson MA, Greenbaum CJ. Type 1 Diabetes TrialNet: a multifaceted approach to bringing disease-modifying therapy to clinical use in type 1 diabetes. Diabetes Care 2018;41:653–661 - PMC - PubMed
    1. Bundy BN; Type 1 Diabetes TrialNet Study Group . A quantitative measure of treatment response in recent-onset type 1 diabetes. Endocrinol Diabetes Metab 2020;3:e00143. - PMC - PubMed
    1. Greenbaum CJ, Schatz DA, Haller MJ, Sanda S. Through the fog: recent clinical trials to preserve β-cell function in type 1 diabetes. Diabetes 2012;61:1323–1330 - PMC - PubMed
    1. Long SA, Thorpe J, DeBerg HA, et al. . Partial exhaustion of CD8 T cells and clinical response to teplizumab in new-onset type 1 diabetes. Sci Immunol 2016;1:eaai7793. - PMC - PubMed
    1. Linsley PS, Greenbaum CJ, Rosasco M, Presnell S, Herold KC, Dufort MJ. Elevated T cell levels in peripheral blood predict poor clinical response following rituximab treatment in new-onset type 1 diabetes. Genes Immun 2019;20:293–307 - PMC - PubMed

Publication types

MeSH terms