Role of Phylogenetic Structure in the Dynamics of Coastal Viral Assemblages
- PMID: 33741635
- PMCID: PMC8208158
- DOI: 10.1128/AEM.02704-20
Role of Phylogenetic Structure in the Dynamics of Coastal Viral Assemblages
Abstract
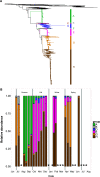
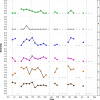
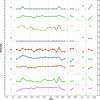
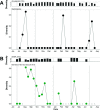
Marine microbes, including viruses, are an essential part of the marine ecosystem, forming the base of the food web and driving biogeochemical cycles. Within this system, the composition of viral assemblages changes markedly with time, and some of these changes are repeatable through time; however, the extent to which these dynamics are reflected within versus among evolutionarily related groups of viruses is largely unexplored. To examine these dynamics, changes in the composition of two groups of ecologically important viruses and communities of their potential hosts were sampled every 2 weeks for 13 months at a coastal site in British Columbia, Canada. We sequenced two marker genes for viruses-the gene encoding the major capsid protein of T4-like phages and their relatives (gp23) and the RNA-dependent RNA polymerase (RdRp) gene of marnavirus-like RNA viruses-as well as marker genes for their bacterial and eukaryotic host communities, the genes encoding 16S rRNA and 18S rRNA. There were strong lagged correlations between viral diversity and community similarity of putative hosts, implying that the viruses influenced the composition of the host communities. The results showed that for both viral assemblages, the dominant clusters of phylogenetically related viruses shifted over time, and this was correlated with environmental changes. Viral clusters contained many ephemeral taxa and few persistent taxa, but within a viral assemblage, the ephemeral and persistent taxa were closely related, implying ecological dynamics within these clusters. Furthermore, these dynamics occurred in both the RNA and DNA viral assemblages surveyed, implying that this structure is common in natural viral assemblages.IMPORTANCE Viruses are major agents of microbial mortality in marine systems, yet little is known about changes in the composition of viral assemblages in relation to those of the microbial communities that they infect. Here, we sampled coastal seawater every 2 weeks for 1 year and used high-throughput sequencing of marker genes to follow changes in the composition of two groups of ecologically important viruses, as well as the communities of bacteria and protists that serve as their respective hosts. Different subsets of genetically related viruses dominated at different times. These results demonstrate that although the genetic composition of viral assemblages is highly dynamic temporally, for the most part the shuffling of genotypes occurs within a few clusters of phylogenetically related viruses. Thus, it appears that even in temperate coastal waters with large seasonal changes, the highly dynamic shuffling of viral genotypes occurs largely within a few subsets of related individuals.
Keywords: 16S rRNA; 18S rRNA; Myoviridae; Picornavirales; bacteria; coastal; dynamics; phylogeny; phytoplankton; seed bank; time series; virus.
Copyright © 2021 American Society for Microbiology.
Figures
References
-
- DuRand MD, Olson RJ, Chisholm SW. 2001. Phytoplankton population dynamics at the Bermuda Atlantic Time-series station in the Sargasso Sea. Deep Sea Res Part II Top Stud Oceanogr 48:1983–2003. 10.1016/S0967-0645(00)00166-1. - DOI
-
- Morris RM, Vergin KL, Cho J-C, Rappé MS, Carlson CA, Giovannoni SJ. 2005. Temporal and spatial response of bacterioplankton lineages to annual convective overturn at the Bermuda Atlantic Time-series Study site. Limnol Oceanogr 50:1687–1696. 10.4319/lo.2005.50.5.1687. - DOI
Publication types
MeSH terms
Substances
LinkOut - more resources
Full Text Sources
Other Literature Sources
Research Materials

