. 2021 Mar 19;6(57):eabc8122.
doi: 10.1126/sciimmunol.abc8122.

Resident memory T cells form during persistent antigen exposure leading to allograft rejection

Affiliations

Resident memory T cells form during persistent antigen exposure leading to allograft rejection

Khodor I Abou-Daya et al. Sci Immunol. .

Abstract

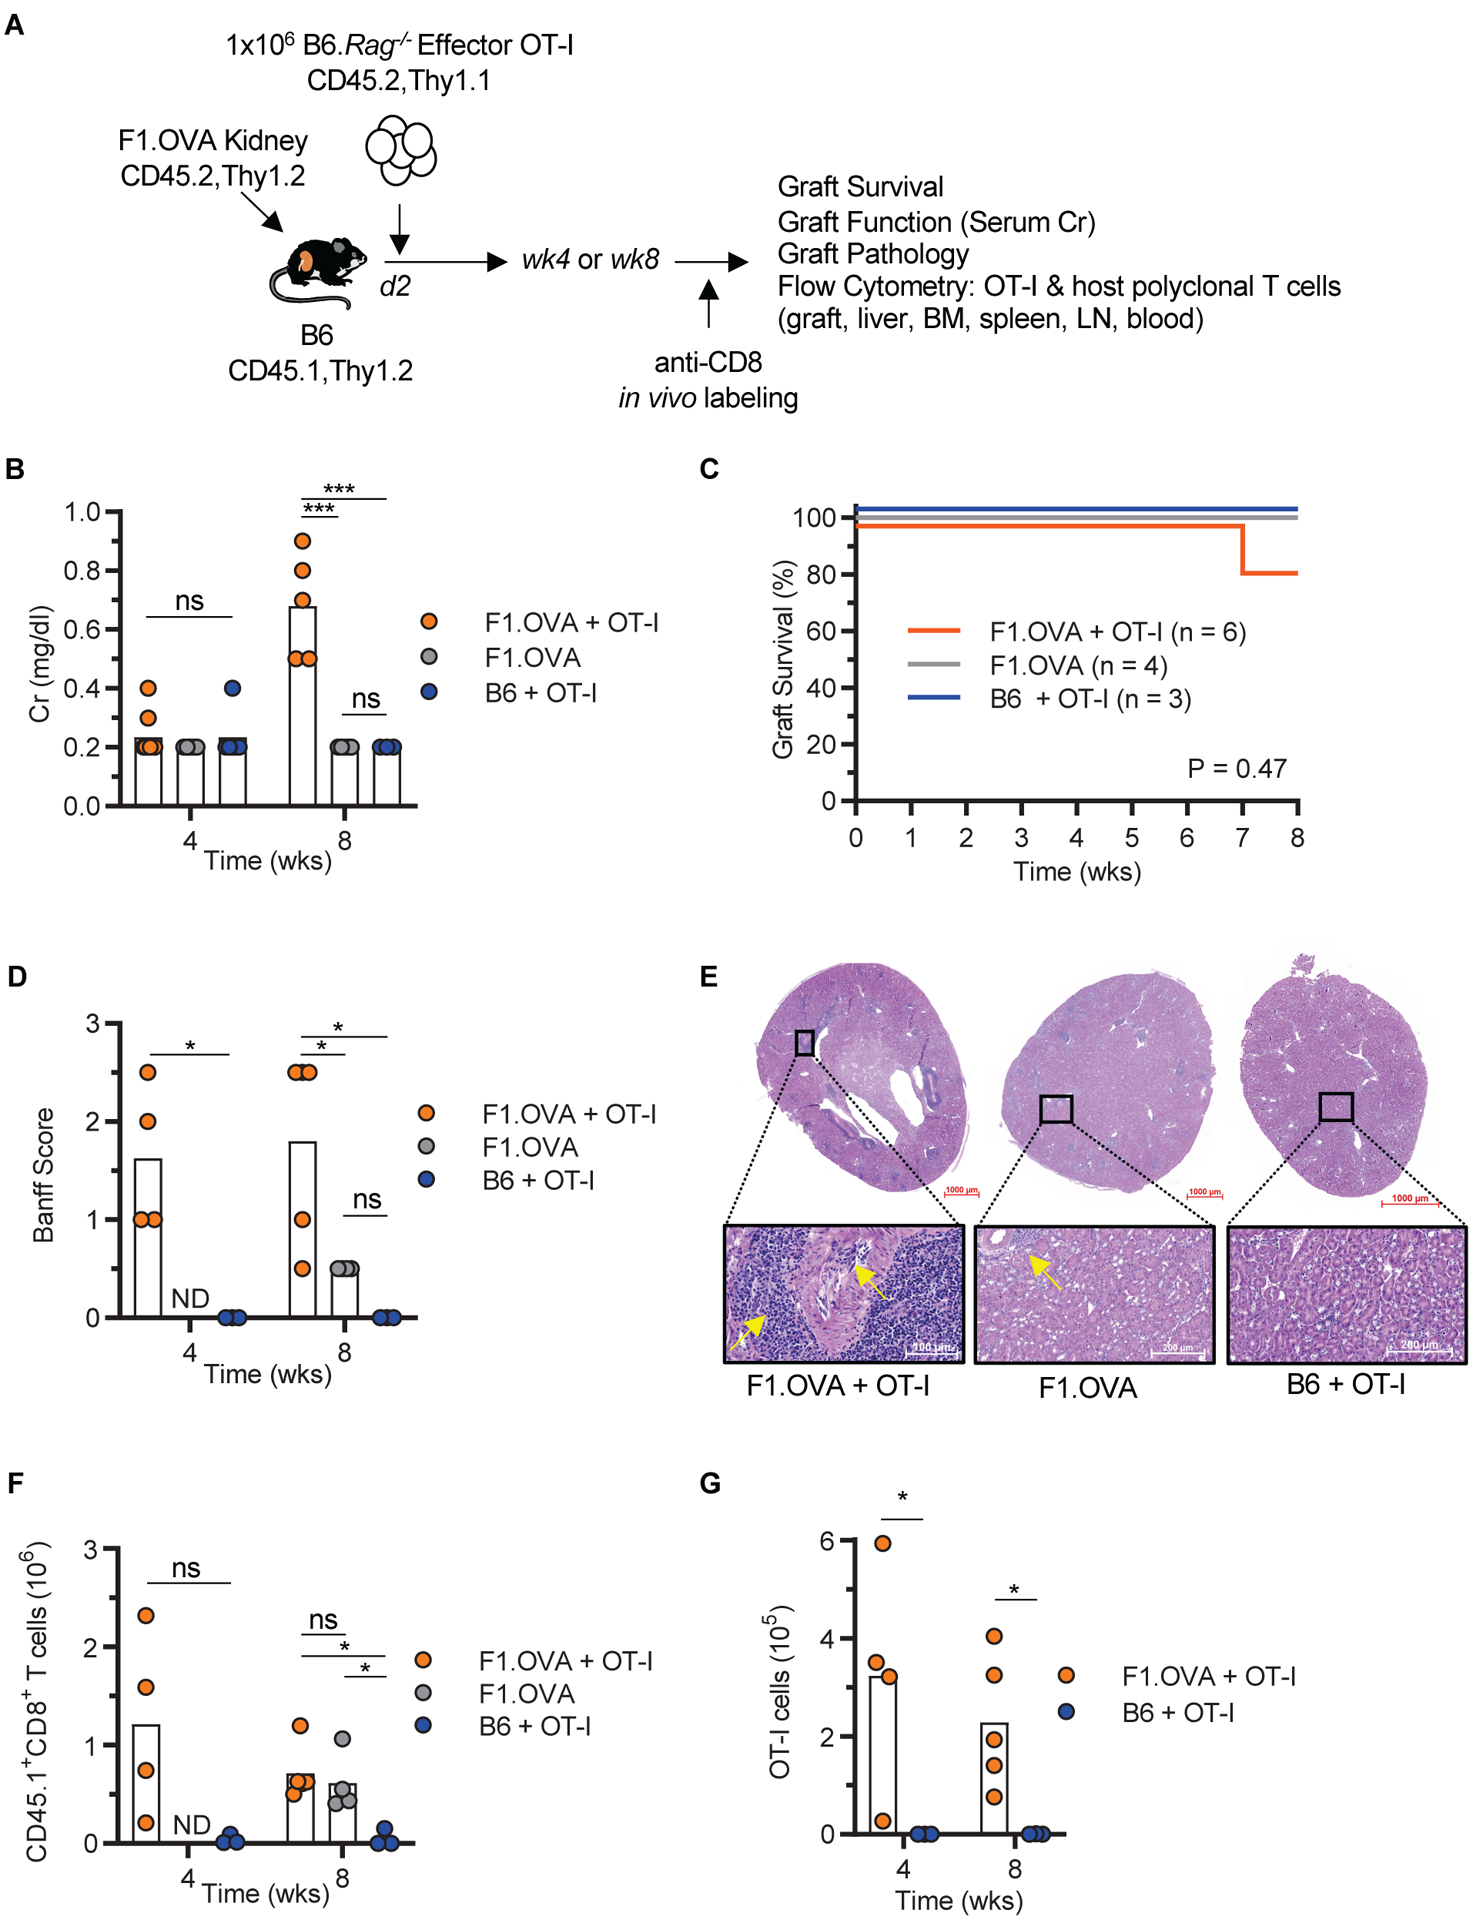
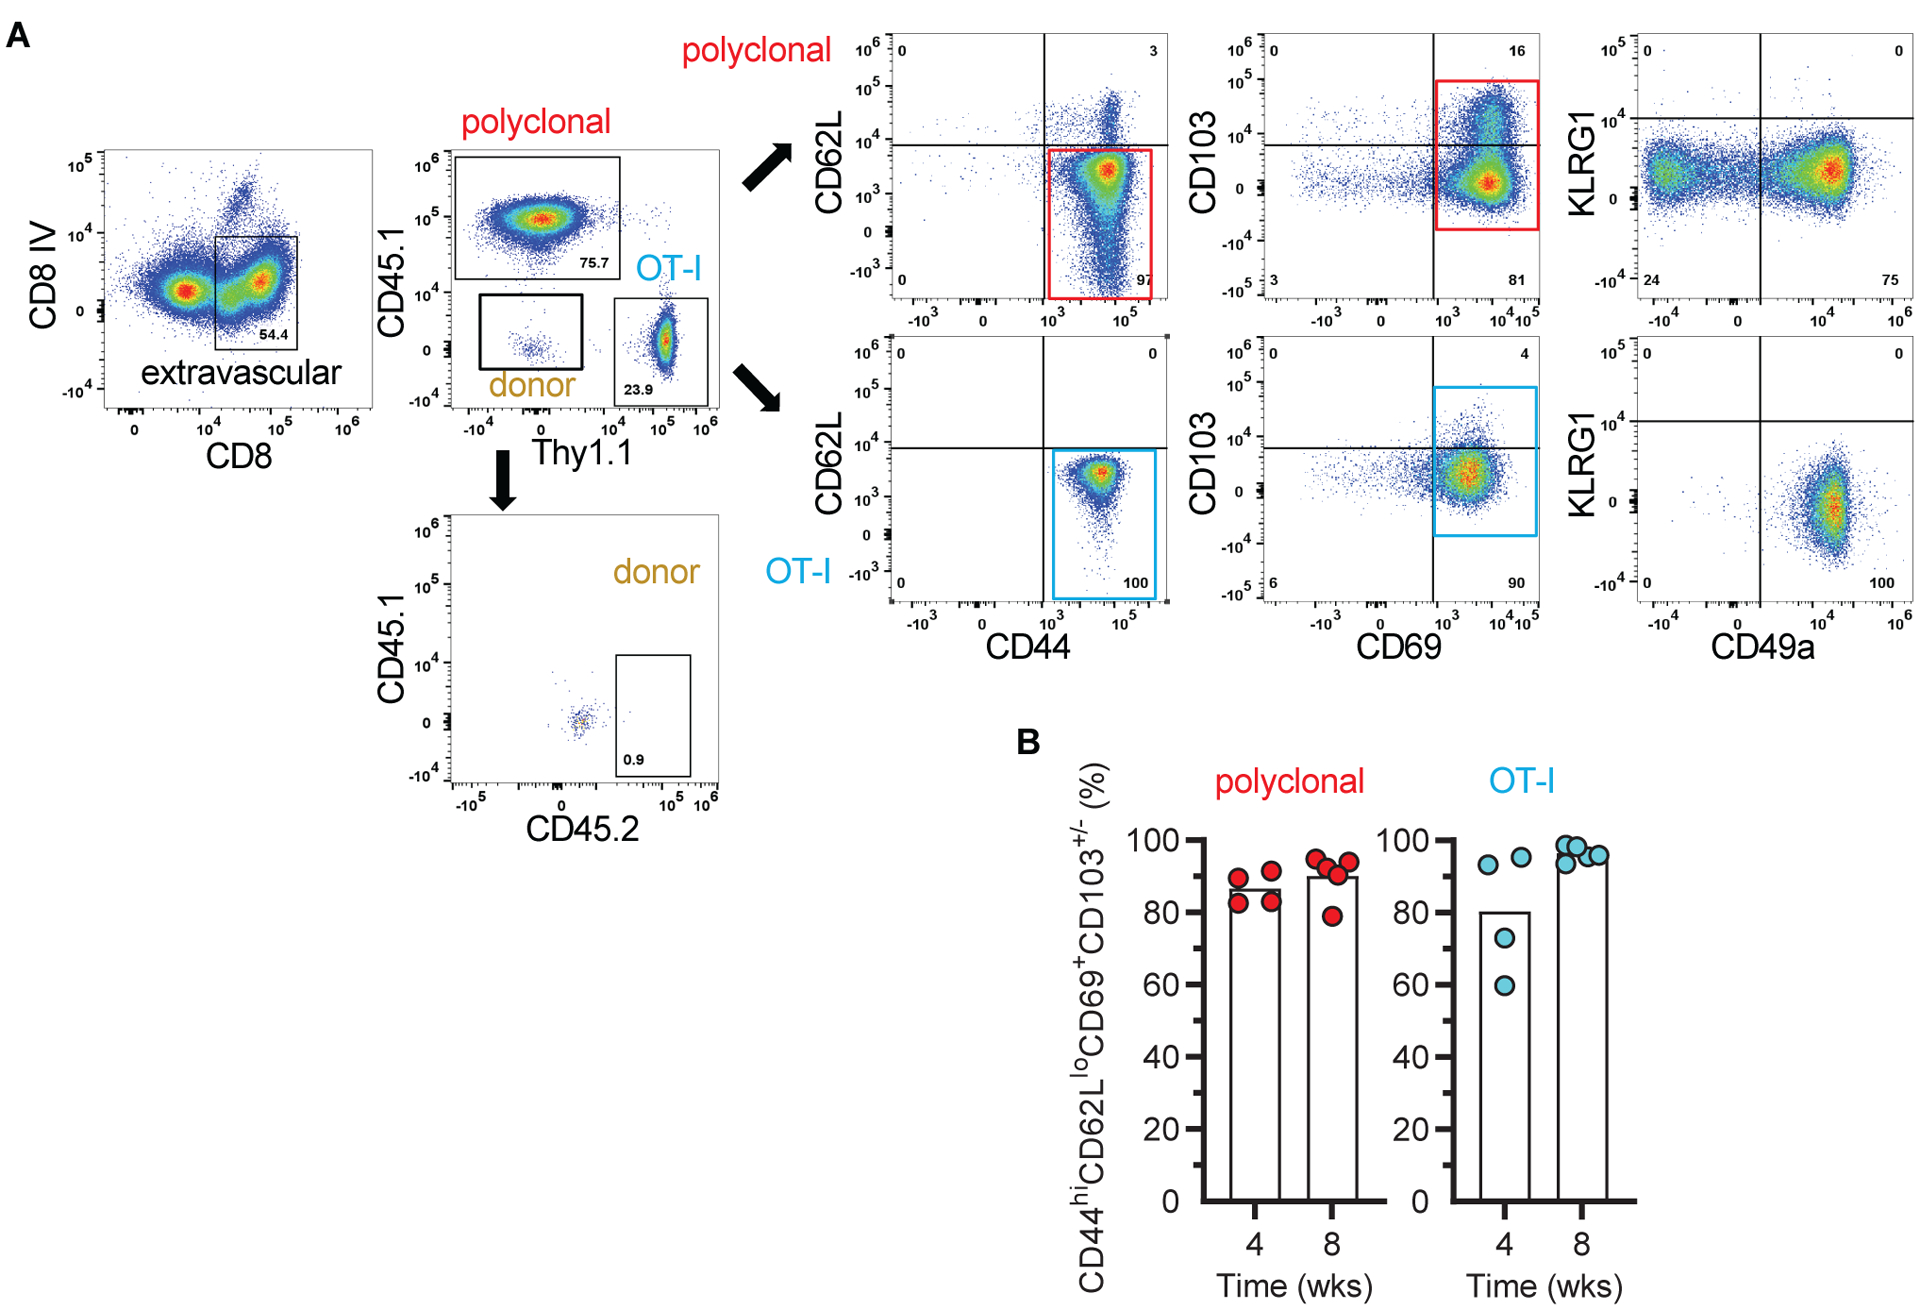
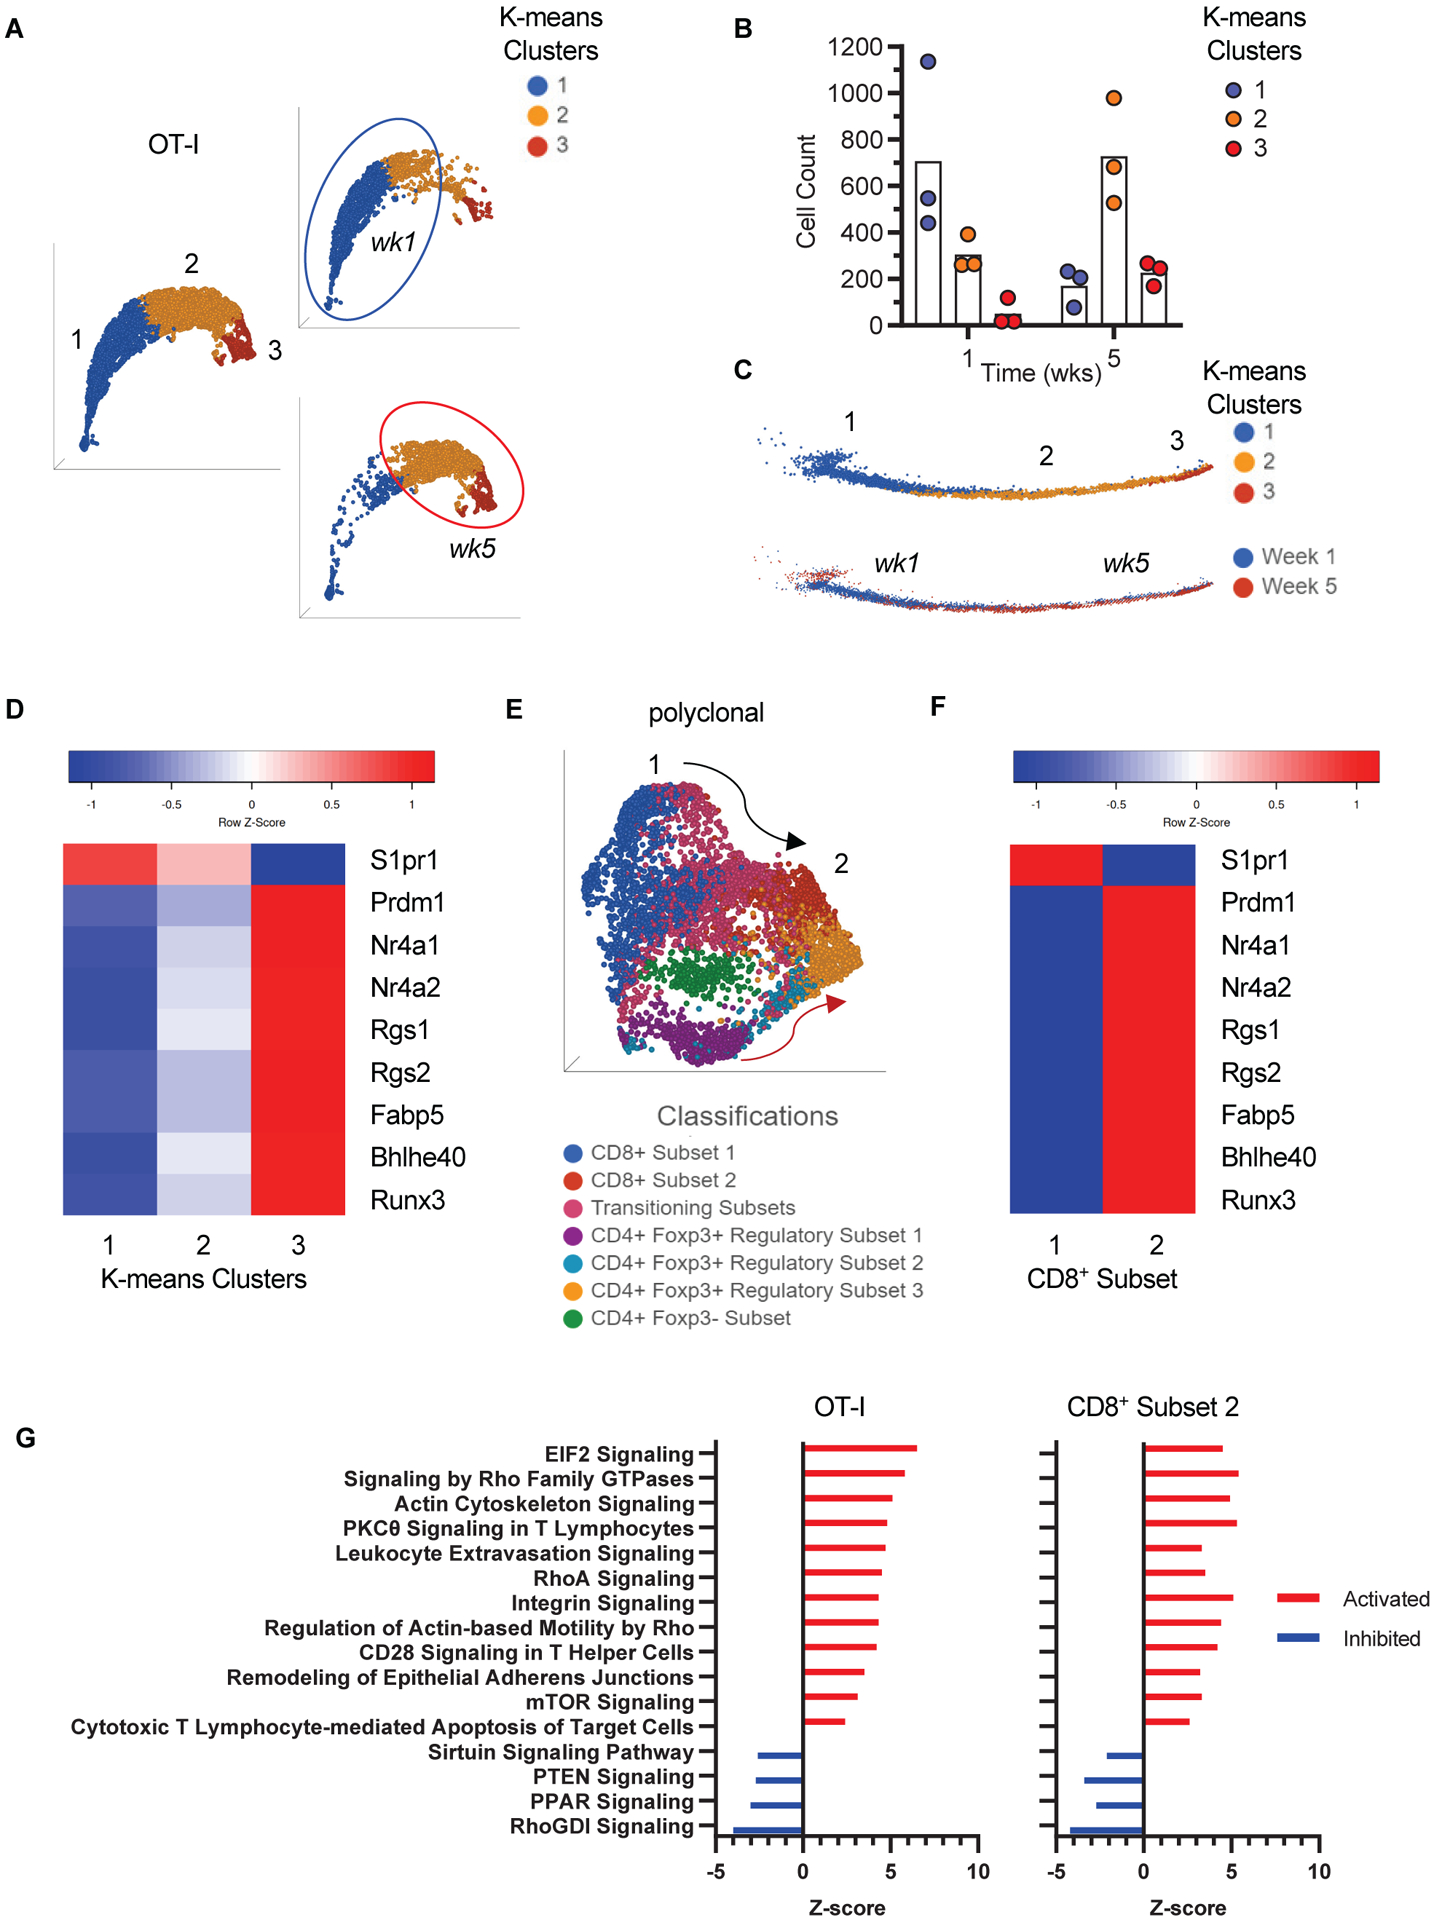
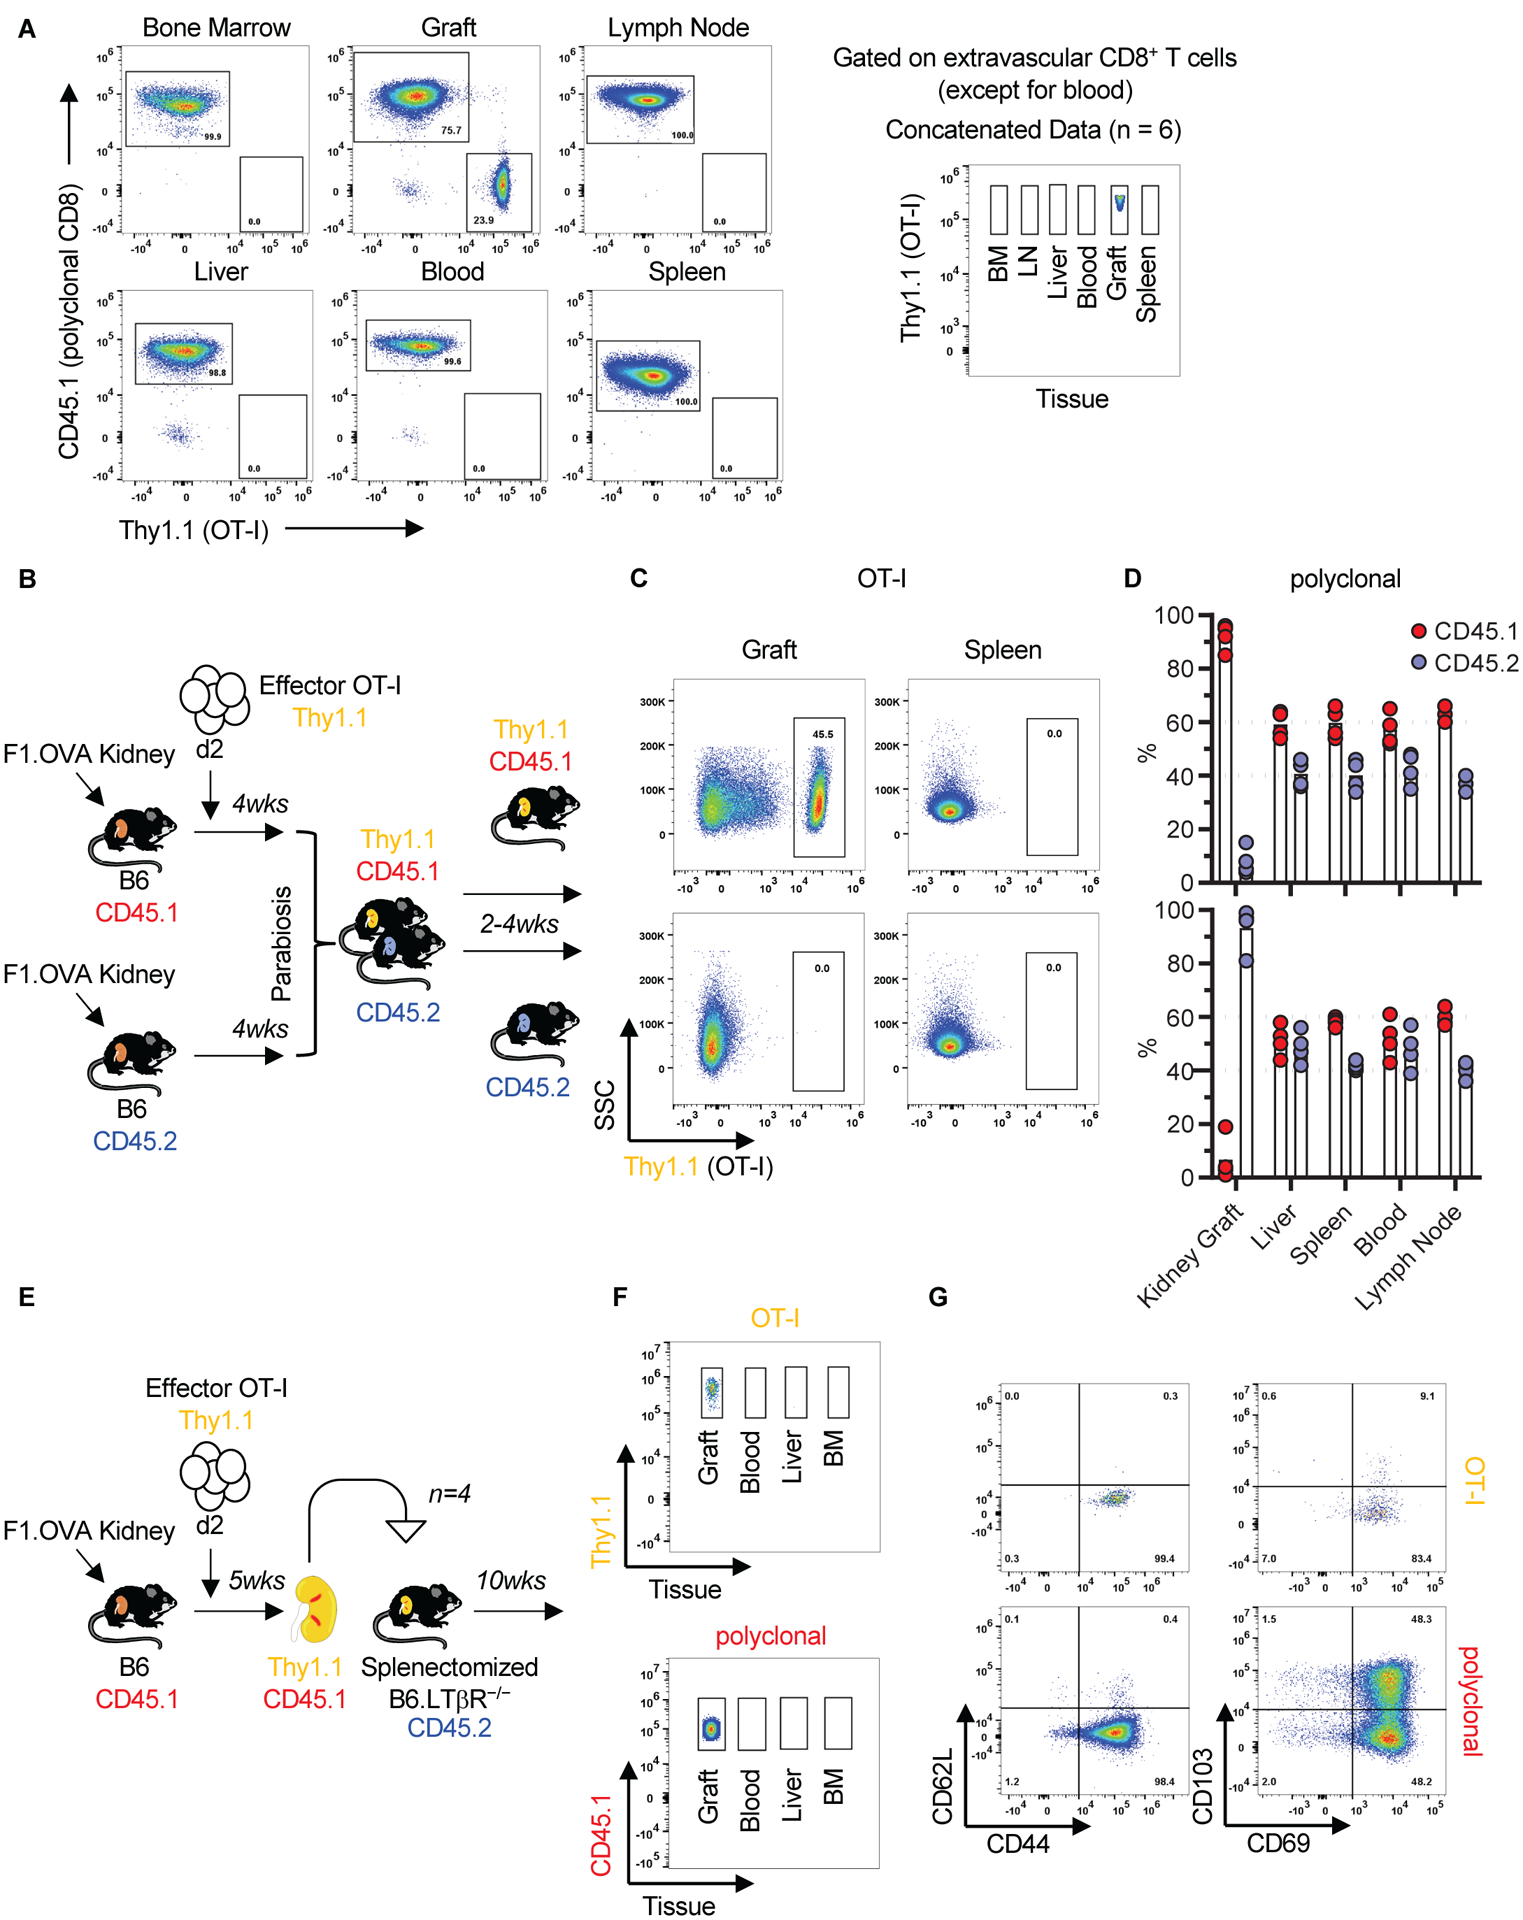
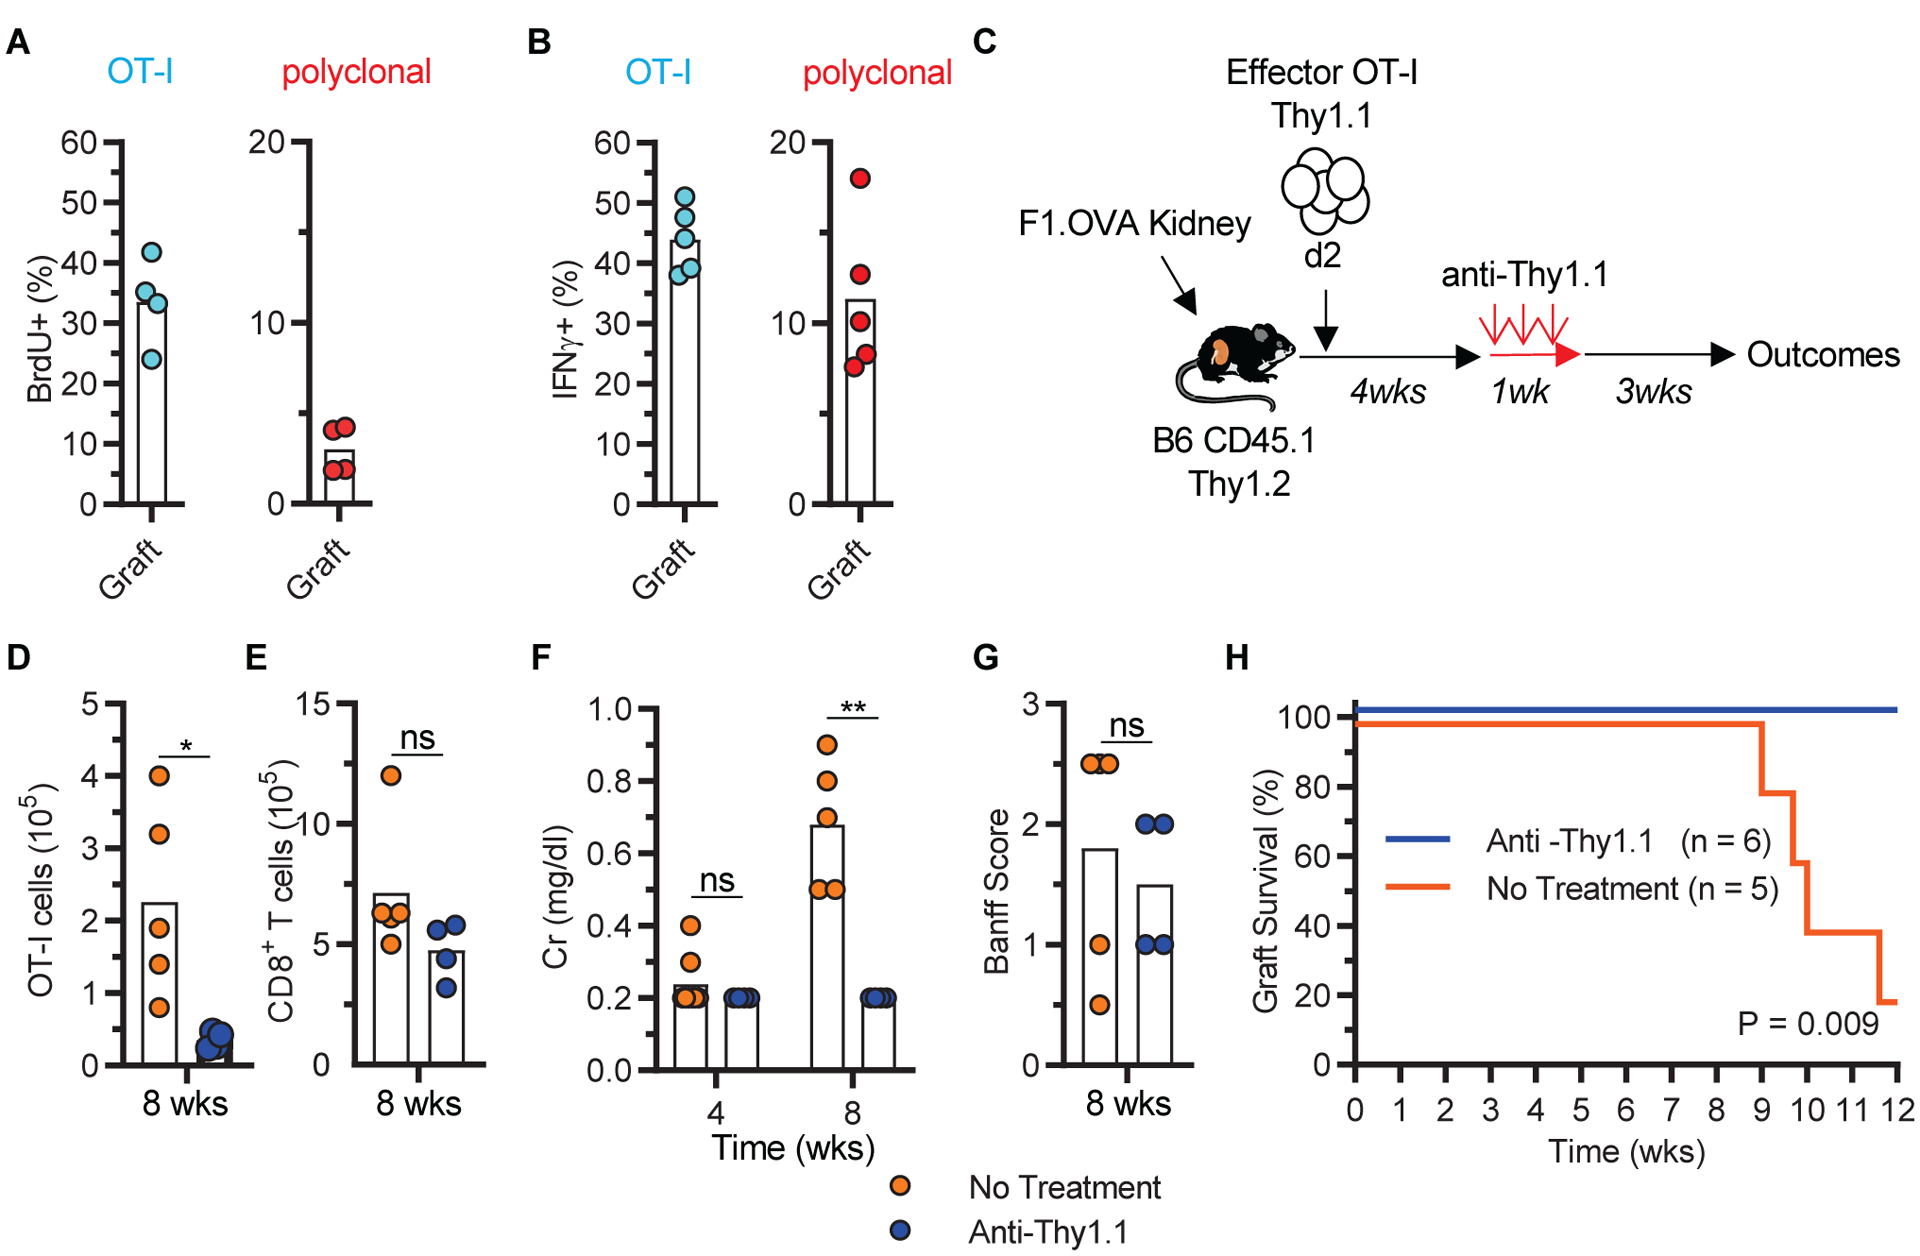
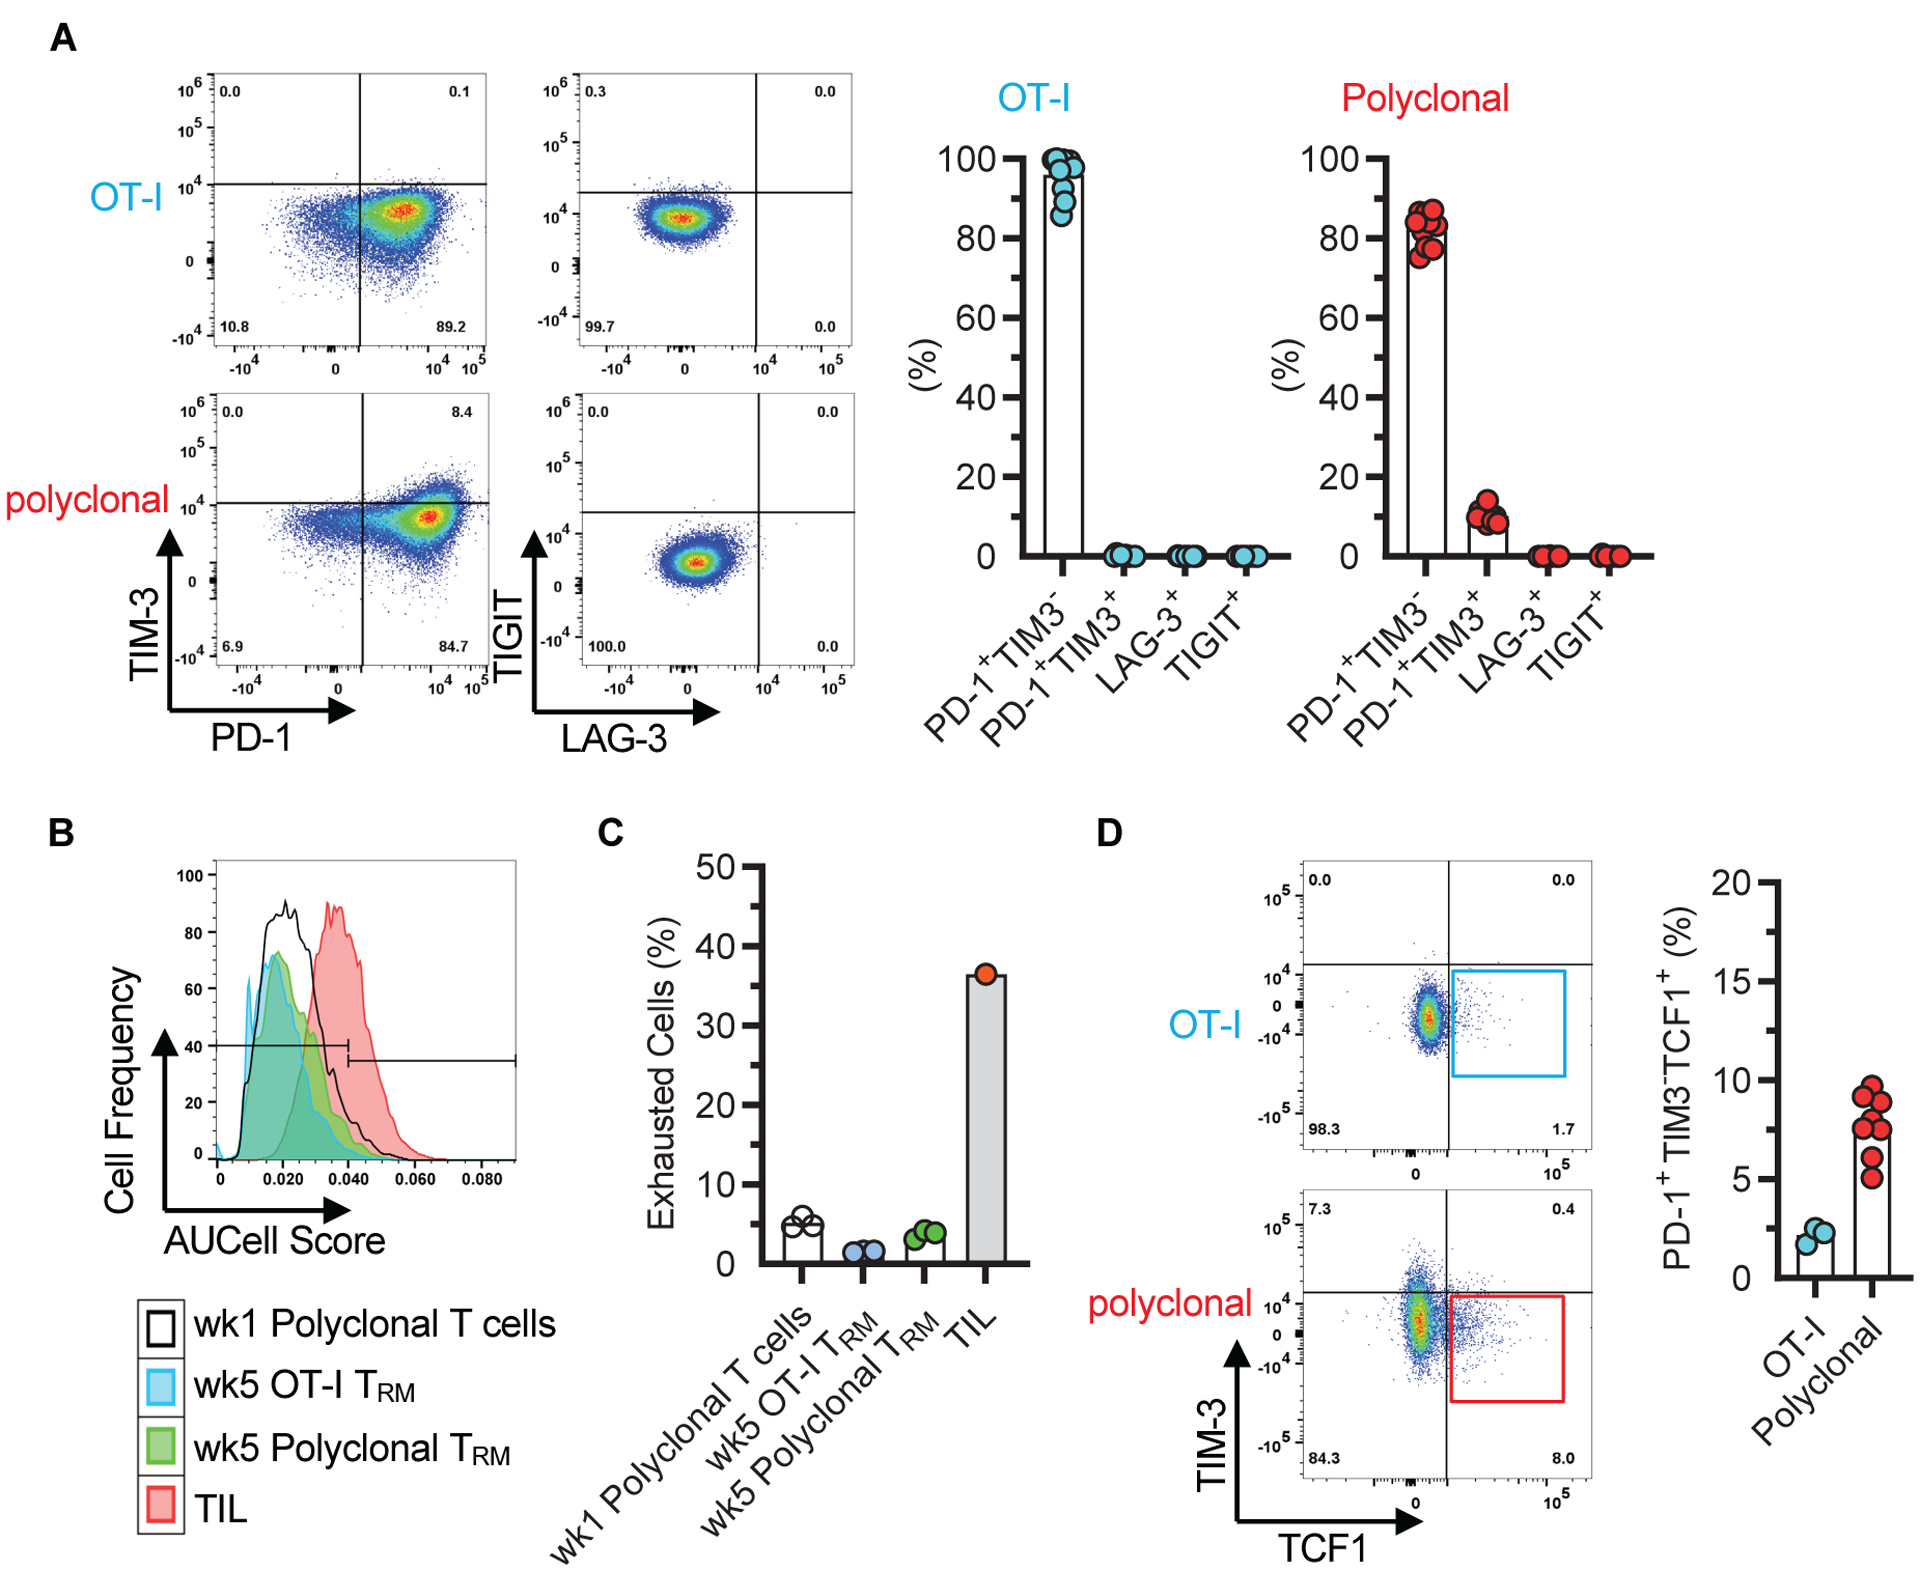
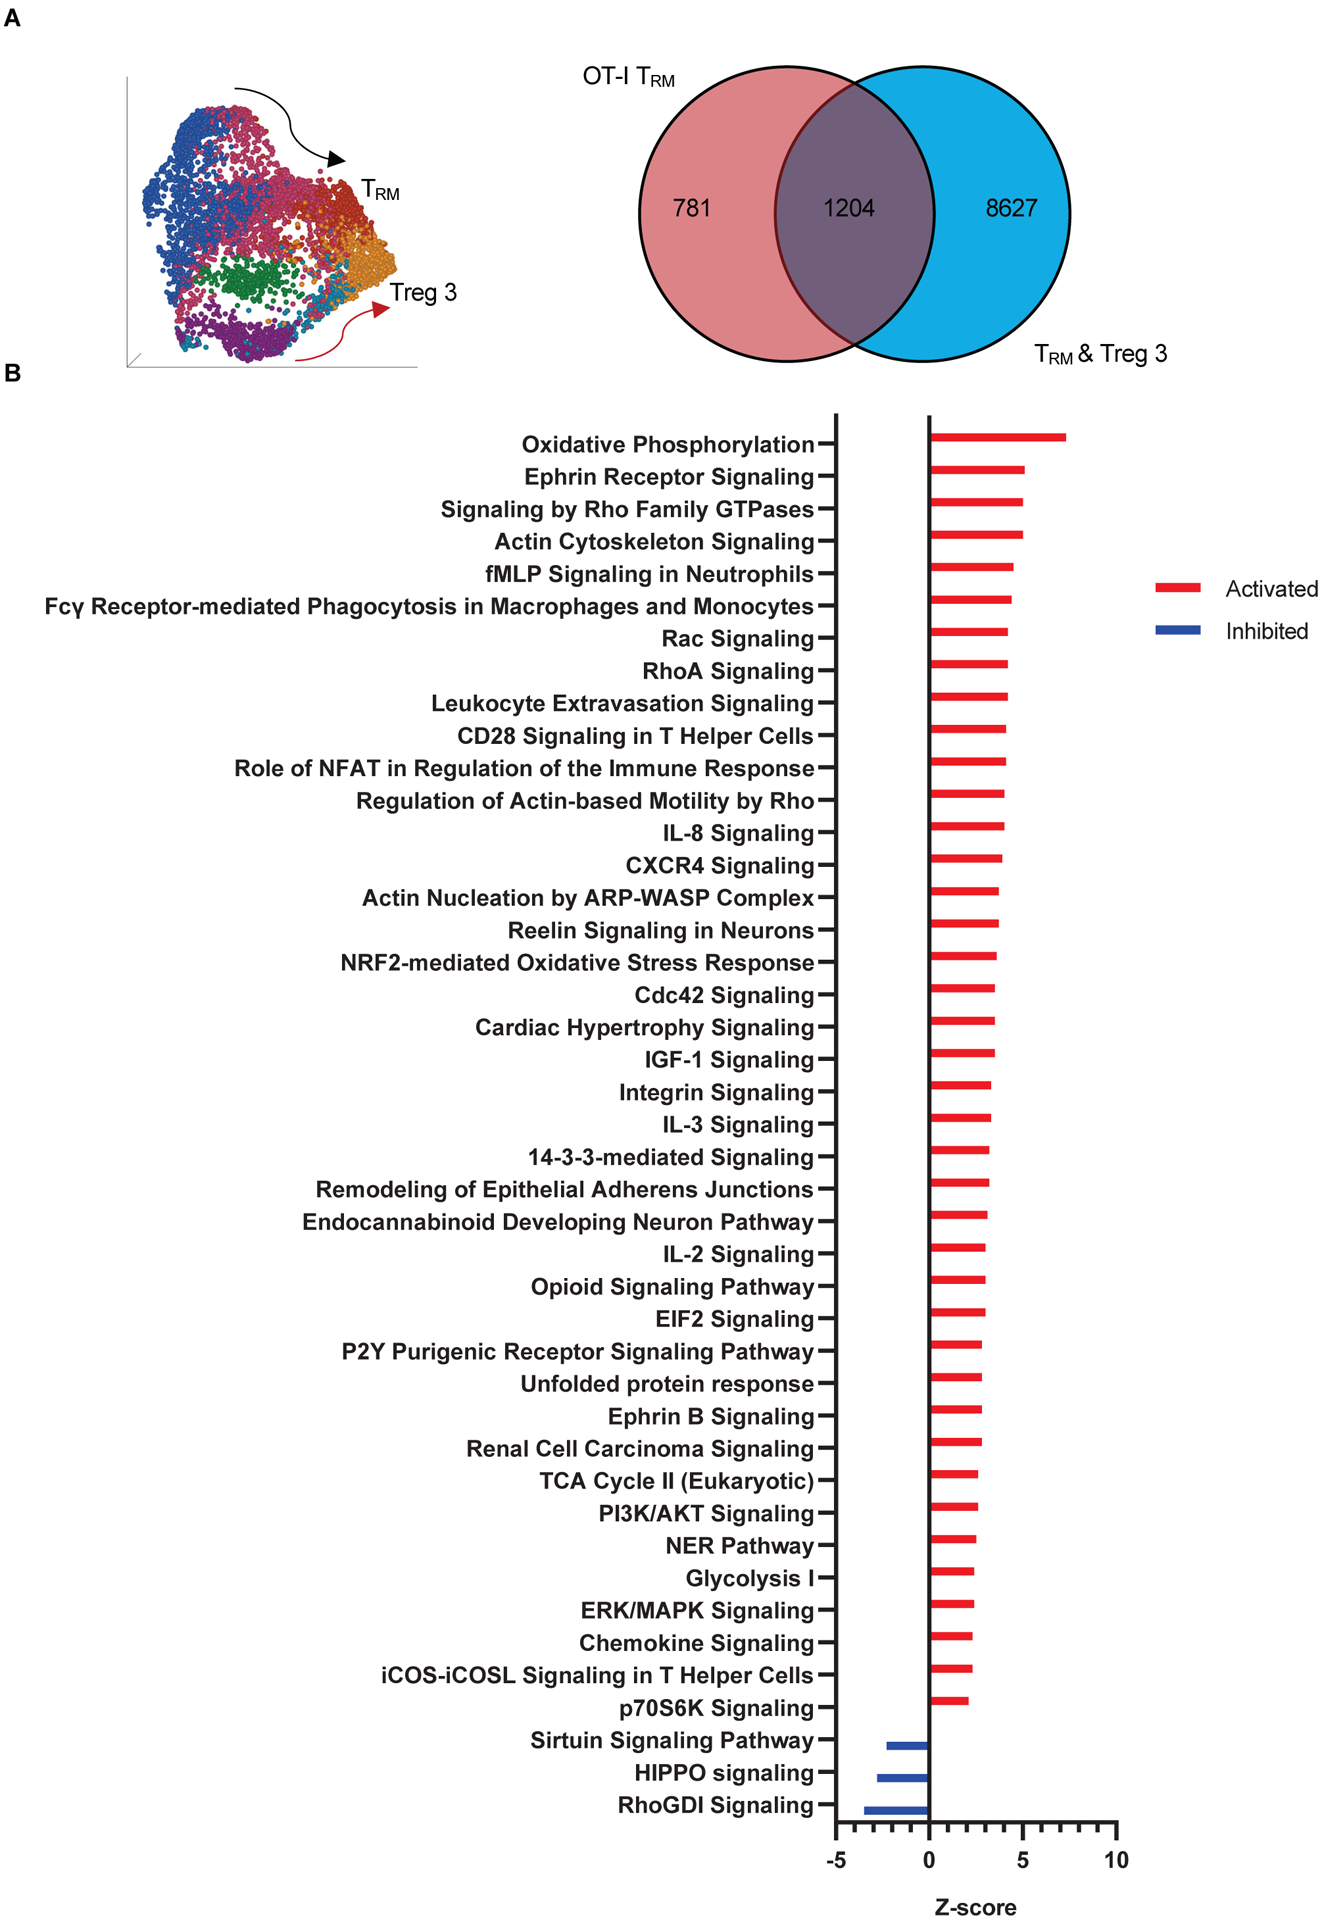
Tissue-resident memory T cells (TRM) contained at sites of previous infection provide local protection against reinfection. Whether they form and function in organ transplants where cognate antigen persists is unclear. This is a key question in transplantation as T cells are detected long term in allografts, but it is not known whether they are exhausted or are functional memory T cells. Using a mouse model of kidney transplantation, we showed that antigen-specific and polyclonal effector T cells differentiated in the graft into TRM and subsequently caused allograft rejection. TRM identity was established by surface phenotype, transcriptional profile, and inability to recirculate in parabiosis and retransplantation experiments. Graft TRM proliferated locally, produced interferon-γ upon restimulation, and their in vivo depletion attenuated rejection. The vast majority of antigen-specific and polyclonal TRM lacked phenotypic and transcriptional exhaustion markers. Single-cell analysis of graft T cells early and late after transplantation identified a transcriptional program associated with transition to the tissue-resident state that could serve as a platform for the discovery of therapeutic targets. Thus, recipient effector T cells differentiate into functional graft TRM that maintain rejection locally. Targeting these TRM could improve renal transplant outcomes.


Conflict of interest statement

Competing interests: The authors declare no competing interests.

Figures

Fig 1.
Fig 1.. Chronic kidney allograft rejection model.
A, Schematic depicting the mouse kidney transplantation model. (Balb/c × B6)F1.OVA kidney allografts were transplanted to B6 mice that received OT-I effectors (F1.OVA + OT-I group, n = 4 to 6 mice, N = 2). Control groups consisted of B6 mice that received F1.OVA allografts without OT-I (F1.OVA group, n = 4 mice, N = 2) or syngeneic grafts with OT-I (B6 + OT-I group, n = 3 mice, N = 1). B-D, Graft outcome assessed by serum creatinine (Cr) (B), graft survival (C), and graft pathology score (Banff Score) (D). E, Representative micrographs (H&E staining) of graft pathology depicting perivascular cellular infiltrate and vasculitis in the F1.OVA + OT-I group (arrows), mild interstitial inflammation in the F1.OVA group (arrow), and normal histology in the B6 + OT-I group. F-G, Quantitation of total host polyclonal CD8+ (F) and monoclonal OT-I (G) T cell infiltrates in the grafts. ND = not done. Individual biological replicates and mean are displayed. One-way analysis of variance (ANOVA) (B, D, and F wk 8), two-tailed student t-test (D, F wk4, and G), and log-rank test (C), *P<0.05, **P<0.01, ****P<0.0001, ns = not significant.
Fig 2.
Fig 2.. Graft infiltrating CD8+ T cells acquired a TRM phenotype.
A, Flow cytometry panels depicting the gating strategy to identify and phenotype extravascular, host polyclonal and OT-I CD8+ T cells in grafts of F1.OVA + OT-I group. Minimal number of donor cells were detected in the graft. Representative of 5 mice at week 8 and 4 mice at week 4. B, Proportion of polyclonal and OT-I T cells that acquired a TRM phenotype in the same grafts at week 4 (n = 4, N = 2) and week 8 (n = 5, N = 2). Individual biological replicates and mean displayed.
Fig 3.
Fig 3.. Single cell RNA sequencing analysis of graft infiltrating CD8+ T cells.
A, Uniform Manifold Approximation and Projection (UMAP) and K-means clustering of combined week 1 (wk1) and week 5 (wk5) OT-I cells. The right panels highlight projections of wk1 and wk5 cells separately. Circles delineate where the majority of wk1 and wk5 cells are (n = 3, N = 1 for each timepoint). B, Scatter plot showing the number of cells in each K-means cluster at week 1 and week 5 (individual biological replicates and Mean). C, Pseudotime trajectory inference and K-means clustering of combined week 1 and week 5 cells (top trajectory). The bottom trajectory highlights progression from week 1 to week 5 cells in pseudotime. D, Heat map of genes associated with TRM phenotype in clusters 1 to 3 depicted in A-C. E, UMAP of week 5 polyclonal T cells classified as shown in Supplementary Figure S2. The numbers 1 and 2 point to CD8+ subsets at either end of the UMAP space (black arrow). The red arrow highlights the CD4+Foxp3+ trajectory. F, Heat map of genes associated with TRM phenotype in CD8+ subsets 1 and 2 depicted in e. G, Ingenuity Pathway Analysis (IPA) of DEG in OT-I and CD8+ subset 2 showing similarity in canonical pathway activity between the two cell populations. Top pathways (highest ratio and z-score) from Table S1 are shown.
Fig 4.
Fig 4.. Graft infiltrating CD8+ T cells with TRM phenotype did not recirculate.
A, OT-I cells at week 8 were present only in the kidney allograft. Representative flow cytometry panels and concatenated data (n = 6, N = 2) after gating on extravascular CD8+ T cells (except for blood) are shown. B-D, Graft OT-I and polyclonal CD8+ T cells did not recirculate after parabiosis. B, Parabiosis model. C, Flow cytometry plots of allografts and spleens of parabionts, gating on OT-I cells (rectangles). Representative of n = 4 parabiosis pairs, N = 3. One pair was harvested at 2 weeks, 2 pairs at 3 weeks, and 1 pair at 4 weeks. D, Cumulative data (individual biological replicates and mean) of polyclonal CD8+ T cells in the grafts and various tissues of parabiosis pairs (n = 4, N = 3). E-G, Graft OT-I and polyclonal CD8+ T cells did not recirculate after kidney allograft re-transplantation. E, Re-transplantation model. F, Concatenated flow cytometry data of graft and other tissues of secondary recipients, gating on OT-I (Thy1.1) and polyclonal CD8+ T cells (CD45.1) of primary recipient (n = 4, N = 1). G, Representative flow cytometry plot depicting phenotype of OT-I and polyclonal CD8+ T cells that persist in the graft 10 weeks after re-transplantation. Quantification of flow cytometry data in Fig. 4A, C, F, and G are shown in fig. S4.
Fig 5.
Fig 5.. Graft TRM were functional.
A, Proliferation (BrdU uptake) of week 8 graft OT-I and polyclonal CD8+ T cells (n = 4, N = 2) after 3 days of oral BrdU administration. B, IFNγ production (intracellular staining) by week 8 graft OT-I and polyclonal CD8+ T cells (n = 5, N = 2) after ex vivo re-stimulation with allogeneic donor splenocytes. C-G, Depletion of graft OT-I cells attenuated graft rejection. C, Depletion model. D-G, Quantitation of graft OT-I (D), graft polyclonal CD8+ T cells (E), serum creatinine (F), graft pathology (G) in non-depleted (No Treatment, n = 5, N = 2) and depleted (anti-Thy1.1, n = 4, N = 1) groups. Data shown are individual biological replicates and mean. H, Kaplan Meier curve depicting graft survival after OT-I depletion (n = 5 to 6, N = 1). Two-tailed student t-test (A, B, D, E, F, and G) and log-rank test (H). *P<0.05, ****P<0.0001, ns = not significant.
Fig 6.
Fig 6.. Lack of exhaustion characteristics in graft TRM.
A, Representative flow cytometry panels depicting exhaustion marker expression on graft OT-I and polyclonal CD8+ T cells after gating on the CD44hiCD62LloCD69+ population 8 weeks after transplantation. Data shown in corresponding bar graphs are individual biological replicates and mean (n = 10, N = 4). B, Lack of enrichment for the exhaustion gene set (GSE9650) in week 5 graft OT-I and polyclonal TRM. Gene set enrichment was scored based on scRNAseq data of OT-I and CD8+ subset 2 depicted in Fig. 3. Enrichment of exhaustion gene set in tumor infiltrating lymphocytes (TIL) and in week 1 polyclonal graft T cells are included as positive and negative controls, respectively. C, Quantitative representation of data shown in B, individual biological replicates and mean (n = 3 except for TIL (n = 1), N = 1). D, Representative flow cytometry panels showing the proportion of graft OT-I and polyclonal CD8+ T cells that are TIM3TCF1+ after gating on the CD44hiCD62LloCD69+PD-1+ population at 4 – 10 weeks after transplantation. Data are individual biological replicates and mean (n = 3 and N = 2 for OT-I, n = 8 and N = 3 for polyclonal).
Fig 7.
Fig 7.. A common T cell tissue residency program.
A, Venn diagram illustrating the number of genes shared between DEG of OT-I TRM and non-DEG of polyclonal TRM and CD4+Foxp3+ regulatory subset 3 (Treg 3) depicted in UMAP on left and in Fig. 3E. B, Ingenuity Pathway Analysis of the shared gene set. Pathways listed were identified as significant based on −log(BH p-value)>1.3, ratio>0.1, z-score>[2].

Similar articles

Cited by

References

    1. Masopust D, Soerens AG, Tissue-Resident T Cells and Other Resident Leukocytes. Annu Rev Immunol 37, 521–546 (2019). - PMC - PubMed
    1. Snyder ME, Farber DL, Human lung tissue resident memory T cells in health and disease. Curr Opin Immunol 59, 101–108 (2019). - PMC - PubMed
    1. Masopust D, Vezys V, Marzo AL, Lefrancois L, Preferential localization of effector memory cells in nonlymphoid tissue. Science 291, 2413–2417 (2001). - PubMed
    1. Clark RA et al., The vast majority of CLA+ T cells are resident in normal skin. J Immunol 176, 4431–4439 (2006). - PubMed
    1. Milner JJ, Goldrath AW, Transcriptional programming of tissue-resident memory CD8(+) T cells. Curr Opin Immunol 51, 162–169 (2018). - PMC - PubMed

Publication types

MeSH terms