. 2021 Mar 23;118(12):e2017168118.
doi: 10.1073/pnas.2017168118.

Conductance selectivity of Na+ across the K+ channel via Na+ trapped in a tortuous trajectory

Affiliations

Conductance selectivity of Na+ across the K+ channel via Na+ trapped in a tortuous trajectory

Kenichiro Mita et al. Proc Natl Acad Sci U S A. .

Abstract

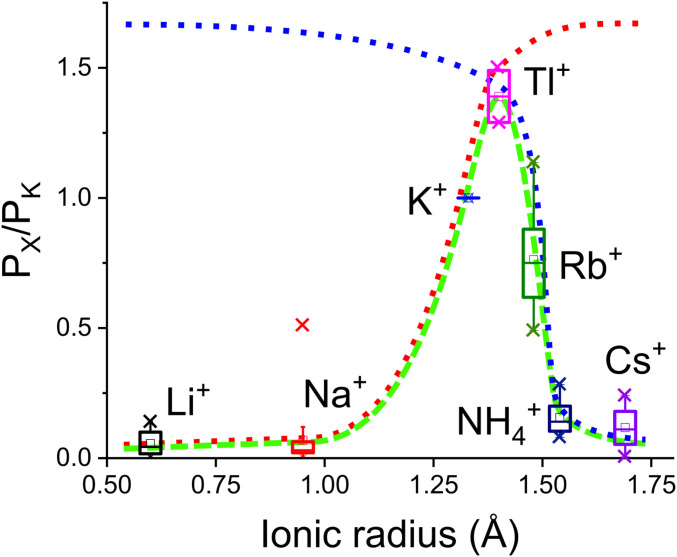
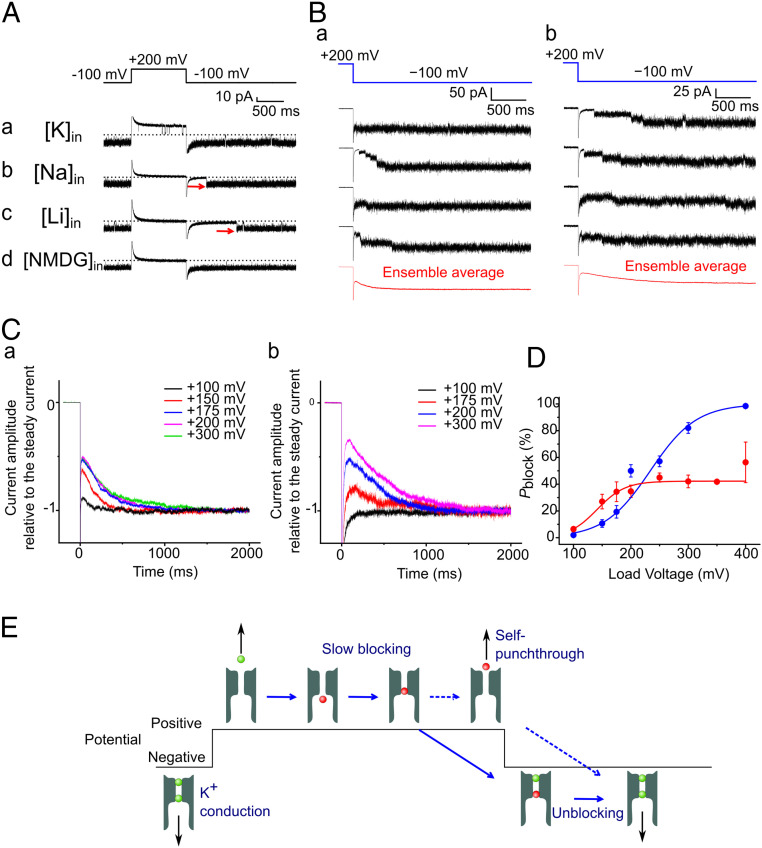
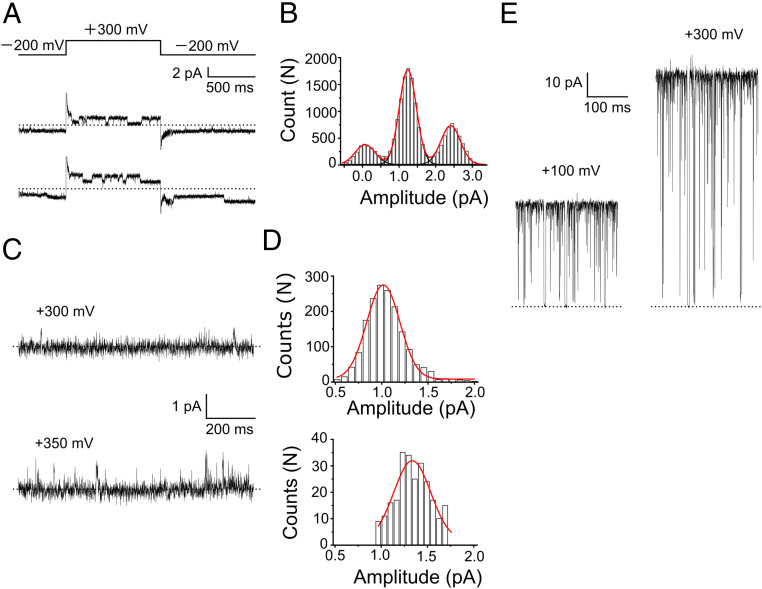
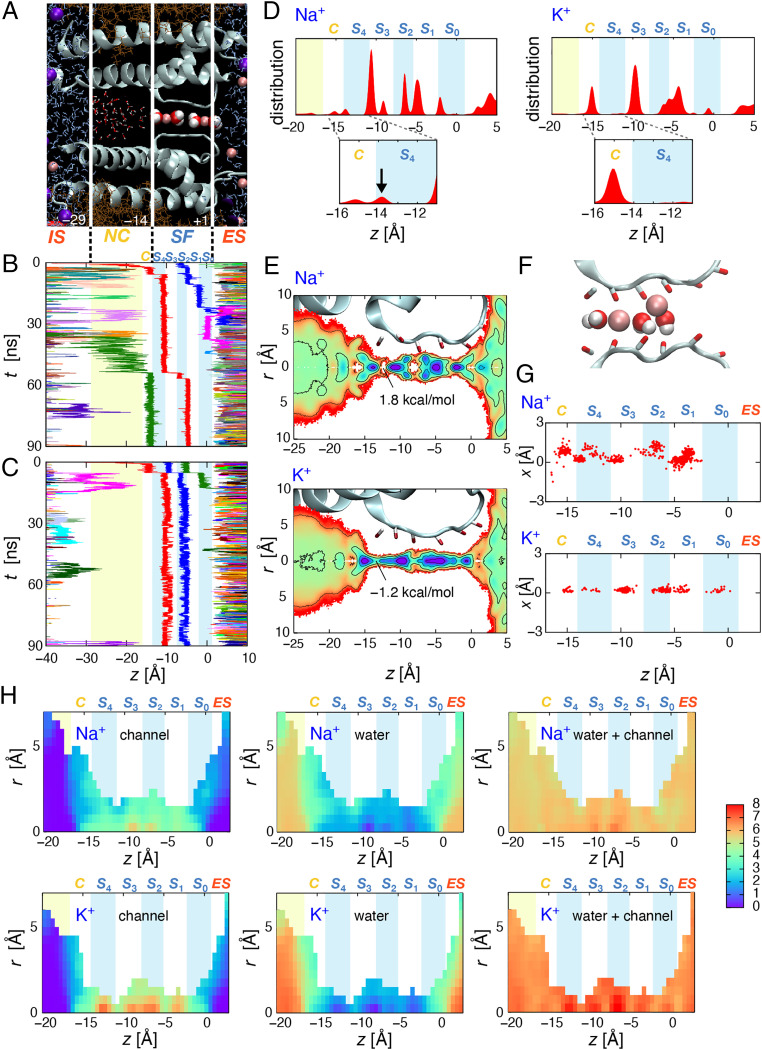
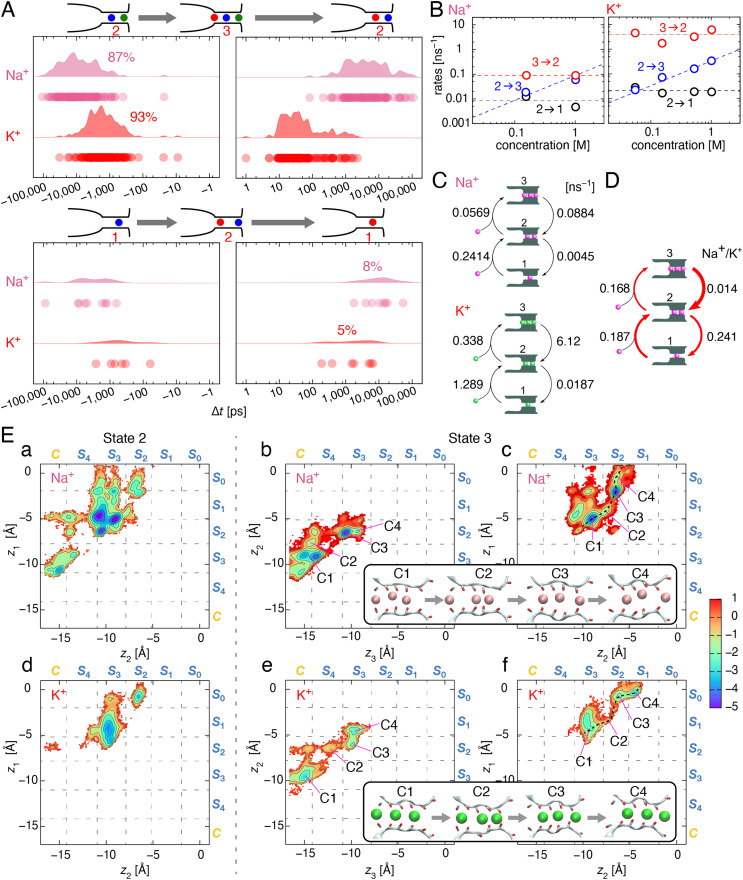
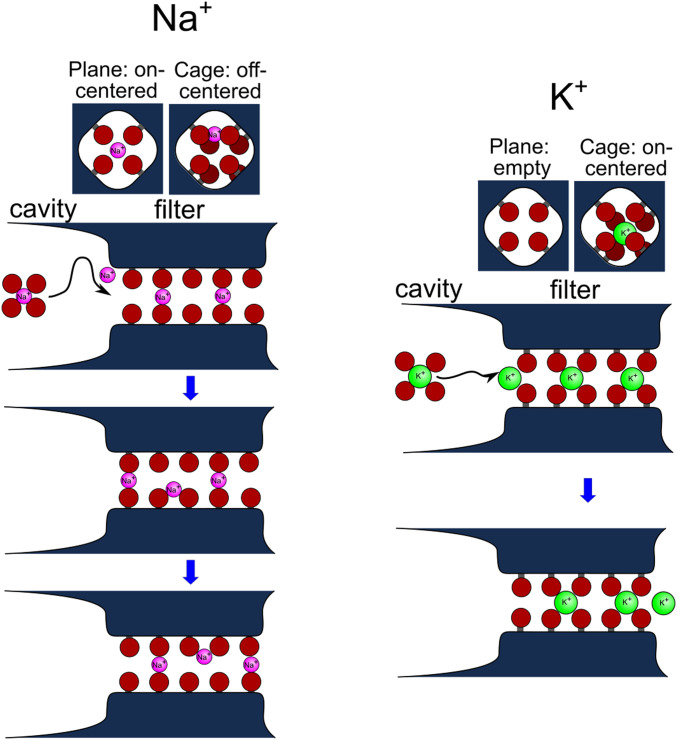
Ion selectivity of the potassium channel is crucial for regulating electrical activity in living cells; however, the mechanism underlying the potassium channel selectivity that favors large K+ over small Na+ remains unclear. Generally, Na+ is not completely excluded from permeation through potassium channels. Herein, the distinct nature of Na+ conduction through the prototypical KcsA potassium channel was examined. Single-channel current recordings revealed that, at a high Na+ concentration (200 mM), the channel was blocked by Na+, and this blocking was relieved at high membrane potentials, suggesting the passage of Na+ across the channel. At a 2,000 mM Na+ concentration, single-channel Na+ conductance was measured as one-eightieth of the K+ conductance, indicating that the selectivity filter allows substantial conduit of Na+ Molecular dynamics simulations revealed unprecedented atomic trajectories of Na+ permeation. In the selectivity filter having a series of carbonyl oxygen rings, a smaller Na+ was distributed off-center in eight carbonyl oxygen-coordinated sites as well as on-center in four carbonyl oxygen-coordinated sites. This amphipathic nature of Na+ coordination yielded a continuous but tortuous path along the filter. Trapping of Na+ in many deep free energy wells in the filter caused slow elution. Conversely, K+ is conducted via a straight path, and as the number of occupied K+ ions increased to three, the concerted conduction was accelerated dramatically, generating the conductance selectivity ratio of up to 80. The selectivity filter allows accommodation of different ion species, but the ion coordination and interactions between ions render contrast conduction rates, constituting the potassium channel conductance selectivity.

Keywords: KcsA channel; MD simulation; conductance ratio; lipid bilayer; single-channel current.


Conflict of interest statement

The authors declare no competing interest.

Figures

Fig. 1.
Fig. 1.
Ion selectivity of potassium channels. Permeability ratios of monovalent cations relative to K+ as a function of ionic radius are shown for various types of potassium channels. The data were collected from literature (SI Appendix, Table S1) and are presented as a box plot, where the box covers the 25th to 75th percentiles, with the center line indicating the median. The potassium channel selectivity is characterized as a band-pass filter with a limited ion-size window (broken green line). The band-pass is arbitrarily decomposed into plausible small-pass (or low-pass; broken blue line) and large-pass (or high-pass; broken red line) filters. The lines do not have physical meanings.
Fig. 2.
Fig. 2.
Voltage-dependent blocking by Na+ and Li+. (A) Single-channel current recordings from the E71A mutant of the KcsA channel in different intracellular cationic solutions. The single-channel currents were measured using a pulse protocol (+200 mV) of 1-s duration followed by a negative potential (−100 mV; holding potential was −100 mV). The extracellular solution contained 200 mM K+, and the intracellular solution contained 200 mM K+ (a), Na+ (b), Li+ (c), and NMDG+ (d). In the symmetric K+ solution (A), signature E71A currents were recorded, such as the single-channel current amplitude of 17.7 pA at a positive potential, flickering currents at the negative potential, and the open probability of almost 100% at both −100 mV and +200 mV. (B) Delayed openings at negative potentials in Na+ (a) and Li+ (b) solutions. A repeated pulse protocol similar to that mentioned in A was applied to the membrane containing a few channels, and the representative current traces are shown. The ensemble current trace (red) obtained from 100 raw traces is shown. (C) Voltage-dependent blocking for Na+ (a) and Li+ (b). The ensemble current traces for different positive potentials for Na+ (a) and Li+ (b) are shown. (D) Steady-state blocking probability (Pblock) of the channel by Na+ (red) or Li+ (blue) ions as a function of the membrane potential. Pblock was evaluated as the instantaneous current level at the negative potential relative to the steady-state current amplitude. The error bars represent SEM (n = 3 to 30 for Na+ and 3 to 26 for Li+). The data are fitted with the Boltzmann function (see SI Appendix) with the parameter z = 0.62 ± 0.12 for Li+. For Na+, the blocking model and fitted parameters are shown in SI Appendix, Fig. S13. (E) Schematic for the slow Na+ (red) blocking. The channel remains either blocked or unblocked at positive potentials, and unblocking occurs by self-punchthrough (broken arrow). Upon a negative jump, the blocked channel is unblocked, leading to a delayed opening with inward K+ (green) conduction. The unblocked channel allows inward K+ conduction from the beginning of the negative jump.
Fig. 3.
Fig. 3.
Single-channel Na+ currents of the KcsA channel. (A) Representative Na+ current traces of the E71A mutant with a positive pulse of +300 mV (2 M NaCl intracellular solution and 0.1 M KCl with 1.9 M Tris+ extracellular solution). The currents were low-pass filtered at 800 Hz. (B) Single-channel current histogram at +300 mV (all-points amplitude histogram). The membrane contains two channels, and the histogram is fitted with a binomial distribution, which gives an open probability of ∼50%. The single-channel current amplitude was 1.2 ± 0.4 pA (n = 3) at +300 mV. (C) Representative single-channel current traces of the WT channel at +300 (Upper) and +350 mV (Lower). The dashed line represents the zero-current level. The same solutions as those for the E71A experiments were used. The currents were low-pass filtered at 800 Hz. (D) Single-channel amplitude histogram of the WT channel at +300 mV (Upper) and +350 mV (Lower). For the low-open probability channel, rare opening events were detected with an event-detecting algorithm (66) in which the amplitudes of current jumps upon openings were used to construct a histogram. The single-channel current amplitude was 1.02 ± 0.01 (n = 3) at +300 mV and 1.33 ± 0.02 pA (n = 3) at +350 mV. (E) Representative single-channel K+ current traces of the E71A mutant. These were recorded in a symmetric 2 M KCl solution at +100 and +300 mV. The single-channel current amplitude was 41.9 ± 1.1 (n = 3) at +100 mV and 94.4 ± 1.8 pA (n = 3) at +300 mV. The dashed line represents the zero-current level.
Fig. 4.
Fig. 4.
MD simulation of Na+ permeation through the KcsA channel. (A) KcsA channel embedded in the PC membrane. The names of the permeation pathways are as follows. IS, intracellular space; NC, (nano-)cavity; SF, selectivity filter; and ES, extracellular space. The site in the NC that is closest to the filter is termed as the C-site. Light red spheres corresponding to Na+, purple spheres indicate Cl, and red and white spheres indicate water molecules. (B) Representative Na+ trajectory. The time course of the movement of Na+ ions along the z-axis (z = 0 at the S0 site) is shown. Each color represents an individual trajectory of Na+. The light blue and white stripes are bound by the carbonyl oxygens of the filter backbone; these are the five cage sites for K+ binding, named S0 to S4. Na+ enters the NC frequently but returns to the IS. In the SF, Na+ ions occupy either plane or cage sites. The Na+ concentration was 1 M, and the membrane potential was +350 mV. (C) The additional trajectory involves three Na+ ions moving in concert. (D) Distribution of Na+ and K+ ions across the pore. In the cavity, Na+ ions are present at the entrance of the filter (C-site, arrow), wherein the K+ ions are not (Inset). In the filter, Na+ ions are present either at the cage (represented by integers, such as S2) or the plane (represented by real numbers, such as S3.5) sites, while K+ ions are mostly distributed at the cage sites. The vertical scale corresponds to 1.5 Å−1. (E) Two-dimensional (z- and r-axis) free energy distribution of Na+ (Upper) and K+ (Lower) around the selectivity filter. Each contour line corresponds to a free energy difference of 1 kcal/mol. At the cage site, Na+ distribution is split into two peaks away from the central pore axis, whereas K+ distribution remains centered across the filter. (F) Snapshot of Na+ ions in the filter. Two Na+ ions occupy S3.5 and S2. The on-center Na+ in the S3.5 plane site (Left) is flanked by two water molecules. The off-center Na+ in the S2 cage site (Right) is solvated by the carbonyl oxygens of two adjacent rings as well as water molecules. (G) Superimposed locations of permeating Na+ and K+ ions in two-dimensional coordinates of the filter. (H) The coordination numbers at z and r positions. The coordination number was calculated for water (Middle), atoms having less than −0.5e charges (including carbonyl oxygens, Left), and the sum of these atoms (Right) in the range within 3.2 Å for Na+ (Upper) and 3.5 Å for K+ (Lower). In the cage sites, K+ is coordinated by seven carbonyls, while Na+ is coordinated by up to five carbonyls.
Fig. 5.
Fig. 5.
Conductance rates of Na+ and K+ through the KcsA channel. (A) The residency time of Na+ and K+ for each ion-occupied state. Up to three ions can occupy the filter (States 1 to 3). The net ion flux occurs through transitions between less–ion-occupied states and more–ion-occupied states, such as State 2 and State 3 (Upper). Completing a cycle yields a net ion flux across the channel. The residency time of each ion-occupied state is shown (Upper Left, State 2; Upper Right, State 3; Lower Left, State1; Lower Right, State 2). The residency time sampled from the MD simulation data are expressed as a dot (raw data), from which the distributions of the residency time are derived based on kernel density estimations (31, 67). In this condition (1 M, +1,000 mV), conduction occurs predominantly through transitions between State 2 and 3 for both Na+ and K+. The residency time of State 3 for Na+ is prolonged 100 times relative to that for K+, which is responsible for the slow elution of Na+. (B) Concentration dependency of the rates of Na+ and K+ conduction. The transition rates were derived from the residency times and the number of the transitions (see SI Methods). The rates of transition for State 3 → 2 (red), State 2 → 1 (black), and State 2 → 3 (blue) are shown. The blue dashed line represents a linear fit for the State 2 → 3 rate (= [K+] · 0.33 ns−1), and the red dashed line is a constant rate for State 3 → 2 (3.89 ns−1). For Na+, the blue dashed line represents the State 2 → 3 rate (= [Na+] · 0.088 ns−1), and the red dashed line is a constant rate for State 3 → 2 (0.091 ns−1). (C) The simple permeation models for Na+ and K+ conduction involving State 1 to 3 (1-2-3 model) at 1.0 M (31). The continuous ion permeation process is coarse grained with a set of the occupied ion numbers (discrete random variables), and the probability and transitions among them yield the net ion flux (SI Appendix) (68, 69). The transition rates between states for Na+ were deduced from B. (D) Comparison of the rates for Na+ and K+. The thickness of the arrows (red) represents the transition rate of Na+ relative to K+, with the thicker ones indicating more attenuation. All rates are depressed for Na+ conduction, but the State 3 → 2 rate is the most prominently depressed, leading to the low Na+ conductance. (E) Two-dimensional free energy surfaces for a pair of Na+ (a, b, c) and K+ (d, e, f) ions in the filter at 1.0 M and 1,000 mV. The left column (a, d) is for State 2 and the middle (b, e) and right (c, f) columns are for State 3. The x- and y-axes represent the z coordinates of ions: z1 for Na+-1, z2 for Na+-2, and z3 for Na+-3, respectively. Snapshots are shown for different ion configurations (C1, C2, …, etc.), and each configuration was assigned on the energy surface. Most likely paths are shown by black dashed lines. The color bar at the right indicates the free energy in kcal/mol relative to that at the exit, and contour lines correspond to an energy interval of 1 kcal/mol. Free energy (F(z1, z2)) was evaluated by the following equation: F(z1, z2) = −kBT ln(P(z1, z2)), where kB, T, and P are the Boltzmann constant, temperature, and the probability of finding two ions at z1 and z2, respectively.
Fig. 6.
Fig. 6.
Distinct conductance features of Na+ and K+ through the KcsA channel filter via the large-pass filter. The origin of the large-pass filter is schematically shown. Na+ (pink) and K+ (green) in the cavity (fully hydrated) and the selectivity filter (cross-sectional view of the plane site [Upper Left] and the cage site [Upper Right]; Lower: longitudinal view) are shown. The dark red spheres represent the oxygen atoms of the water molecules (in the cavity), carbonyl, and hydroxyl groups of threonine (in the filter). Upon entering the filter, a much higher dehydration energy barrier was imposed for Na+, as deduced from the slow blockings. In the filter, K+ was on-center, while Na+ was off-center at the cage sites and on-center at the plane sites, leading to tortuous trajectories for Na+. An off-center Na+ interacts with the carbonyl oxygens of the adjacent rings (Right Upper), whereas an on-center Na+ interacts with the carbonyl oxygens of a ring (plane site). These affinities to multiple sites and high barriers between them are integrated into the longer residency time of multiple Na+ ions in the filter, leading to slow elution.

Similar articles

Cited by

References

    1. Hille B., Ion Channels of Excitable Membranes (Sinauer Associates Inc, Sunderland, ed. 3, 2001).
    1. Hodgkin A. L., Keynes R. D., The potassium permeability of a giant nerve fibre. J. Physiol. 128, 61–88 (1955). - PMC - PubMed
    1. Bezanilla F., Armstrong C. M., Negative conductance caused by entry of sodium and cesium ions into the potassium channels of squid axons. J. Gen. Physiol. 60, 588–608 (1972). - PMC - PubMed
    1. Eisenman G., Horn R., Ionic selectivity revisited: The role of kinetic and equilibrium processes in ion permeation through channels. J. Membr. Biol. 76, 197–225 (1983). - PubMed
    1. Nonner W., Chen D. P., Eisenberg B., Progress and prospects in permeation. J. Gen. Physiol. 113, 773–782 (1999). - PMC - PubMed

Publication types

LinkOut - more resources